



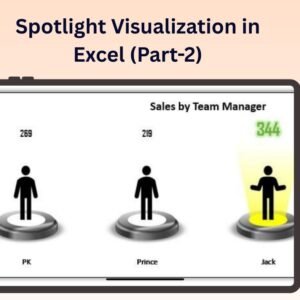
The Spotlight Visualization in Excel (Part-2) is an advanced Excel tool designed to help you highlight and emphasize key data points within your reports or dashboards. Building upon the concepts from Part 1, this version enhances your ability to draw attention to the most important parts of your dataset, providing a more interactive and visually engaging way to present your findings.
Using Excel’s built-in features, along with conditional formatting, this tool allows you to apply spotlight effects on specific cells, rows, or columns based on custom criteria. It’s perfect for financial reports, sales dashboards, or any presentation where you need to focus on important metrics or trends. The spotlight effect helps make critical data points stand out, guiding the viewer’s attention exactly where it’s needed.
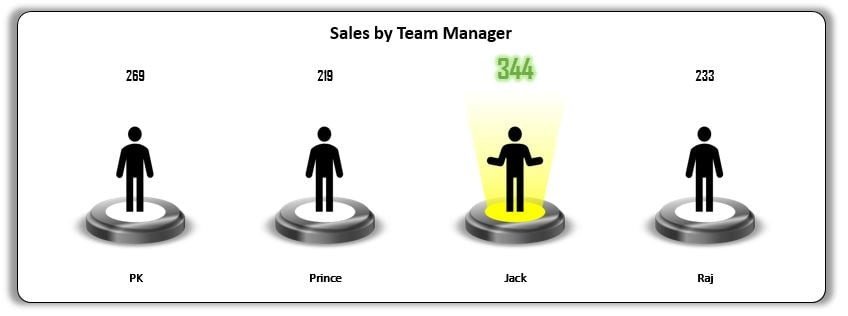
Key Features of the Spotlight Visualization in Excel (Part 2):
💡 Spotlight Effect on Key Data
Highlight key data points with a spotlight effect, ensuring the most important figures or trends stand out in your dataset.
⚙️ Conditional Formatting Integration
Utilize Excel’s conditional formatting tools to dynamically change the appearance of cells based on specific criteria, such as performance thresholds or target achievements.
📊 Customizable Spotlight Area
Customize the spotlight to focus on specific rows, columns, or cells, and set the conditions for when the spotlight effect should be triggered.
📈 Dynamic Updates
The spotlight effect updates automatically as new data is entered or modified, ensuring your visualizations stay up to date with the latest information.
🎨 Visually Engaging Design
Enhance your reports with visually compelling data visualizations that help make key data points pop out and grab attention instantly.
Why You’ll Love the Spotlight Visualization in Excel (Part 2):
✅ Draw Attention to Key Data – Use the spotlight effect to ensure that critical data points are highlighted, making them easier for your audience to notice and understand. ✅ Customizable to Your Needs – Customize the spotlight effect to suit your specific dataset, choosing which metrics or data points to focus on. ✅ Real-Time Updates – As you add or change data, the spotlight effect automatically adjusts to reflect the most important elements. ✅ Improves Data Presentation – Make your reports more engaging and easier to follow by focusing attention on key metrics, trends, or changes. ✅ Simple to Use – The tool integrates easily into your existing Excel reports, with no advanced Excel skills required to implement or use the spotlight effect.
What’s Inside the Spotlight Visualization in Excel (Part 2):
- Spotlight Effect – Apply a visual spotlight effect to key data points based on customizable conditions.
- Conditional Formatting – Use conditional formatting to change the appearance of cells and make critical data stand out.
- Real-Time Data Integration – The spotlight effect updates automatically as data is changed or updated.
- Customizable Design – Adjust the spotlight criteria to fit your specific needs or business requirements.
How to Use the Spotlight Visualization in Excel (Part 2):
1️⃣ Download the Template – Access the Excel file instantly after purchase. 2️⃣ Input Your Data – Add your data into the designated fields. 3️⃣ Apply the Spotlight Effect – Customize which data points or metrics should be highlighted with the spotlight. 4️⃣ Track and Visualize Key Data – Use the spotlight effect to keep your audience focused on the most critical metrics in your report or dashboard.
Who Can Benefit from the Spotlight Visualization in Excel (Part 2):
- Business Analysts
- Data Analysts
- Financial Analysts
- Sales Teams
- Marketing Teams
- Project Managers
- Anyone who needs to present data and emphasize key insights
The Spotlight Visualization in Excel (Part 2) is a fantastic tool for anyone who needs to draw attention to important data in a visually compelling way. Whether you’re working with financial data, sales figures, or any other performance metrics, this tool helps ensure that your key insights are always front and center.
Click here to read the Detailed blog post
https://www.pk-anexcelexpert.com/spotlight-visualization-in-excel-part-2/
Visit our YouTube channel to learn step-by-step video tutorials
Watch the step-by-step video tutorial:
Compatibility and Requirements
- Works in Microsoft Excel desktop (Excel 2016 or later, or Microsoft 365).
- The spotlight effect is built with conditional formatting, a standard Excel feature. Microsoft explains charts in Create a chart from start to finish.
Frequently Asked Questions
What does the spotlight effect do?
It highlights the key data points in your report so the most important figures stand out.
Can I choose what gets highlighted?
Yes. You can focus the spotlight on specific rows, columns or cells and set the conditions that trigger it.
Does it update when my data changes?
Yes. The spotlight effect updates automatically as data is entered or changed.
Is there a Part 1?
Yes. Spotlight Visualization in Excel (Part-1) is a separate template, linked below.
Related Excel Visualization Templates
- Spotlight Visualization in Excel (Part-1): the first spotlight template
- Dynamic Conditional Formatting in Excel: formatting that changes with your data
- Progress Bar in Excel Cells using Conditional Formatting: in-cell progress bars
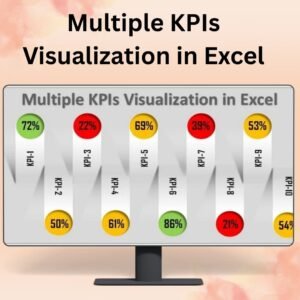
- Multiple KPIs Visualization in Excel: show several KPIs in one view
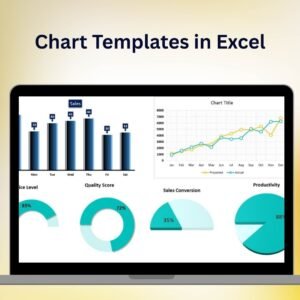
- Data Analyst’s Chart & Visualization Pack: 10 premium Excel and Google Sheets chart templates
Browse all Excel charts and visualizations.






Reviews
There are no reviews yet.