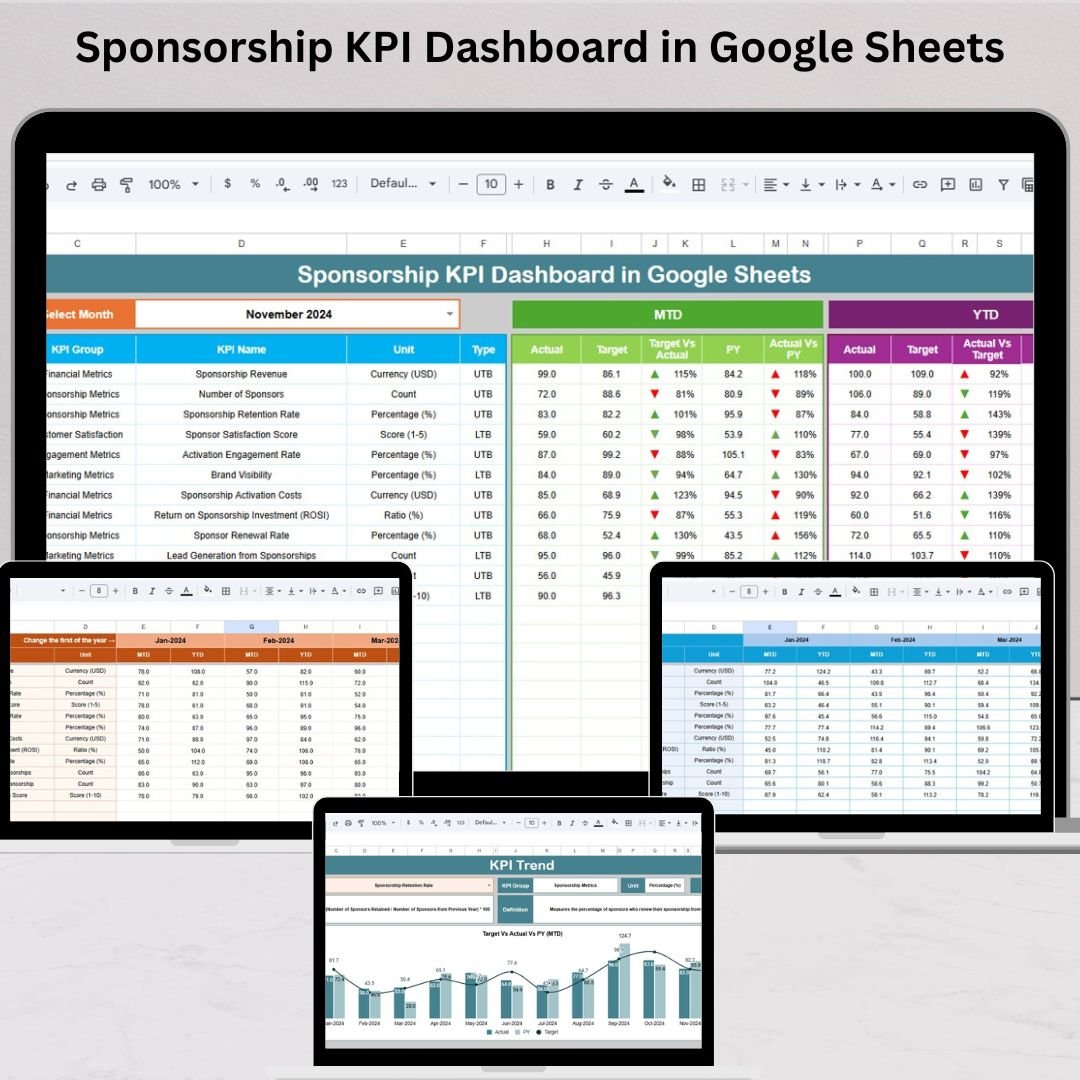
Sponsorships are one of the most powerful ways to grow a brand, host successful events, and build long-term business relationships. Whether you manage sports events, exhibitions, conferences, concerts, CSR projects, or digital partnerships, sponsorship revenue helps you scale your operations with confidence. But as competition increases, companies are no longer satisfied with guesswork—they want measurable results. That’s where the Sponsorship KPI Dashboard in Google Sheets becomes an essential tool for accurate, real-time performance tracking.Sponsorship KPI Dashboard in Google Sheets
This ready-to-use Google Sheets dashboard gives you a crystal-clear view of revenue, cost, engagement, exposure, impressions, deliverables, conversions, and sponsor satisfaction—everything needed to evaluate sponsorship performance. With automated calculations, clean visuals, and dropdown-driven navigation, this dashboard helps you make smarter decisions and improve sponsorship outcomes faster.
✨ Key Features of the Sponsorship KPI Dashboard in Google Sheets
📊 1. Complete MTD & YTD KPI Tracking
Analyze Month-To-Date and Year-To-Date performance in one click. Compare actual numbers with targets and last year’s values for every sponsorship KPI.
📈 2. Dynamic Trend Analysis
Use the KPI Trend sheet to view monthly performance patterns. Spot early issues, Discover seasonal peaks, track cost efficiency, and identify ROI opportunities.
📉 3. Auto-Updating Visual Dashboard
Change the month using the dropdown, and the full dashboard refreshes instantly. All arrows, indicators, and comparisons update automatically.
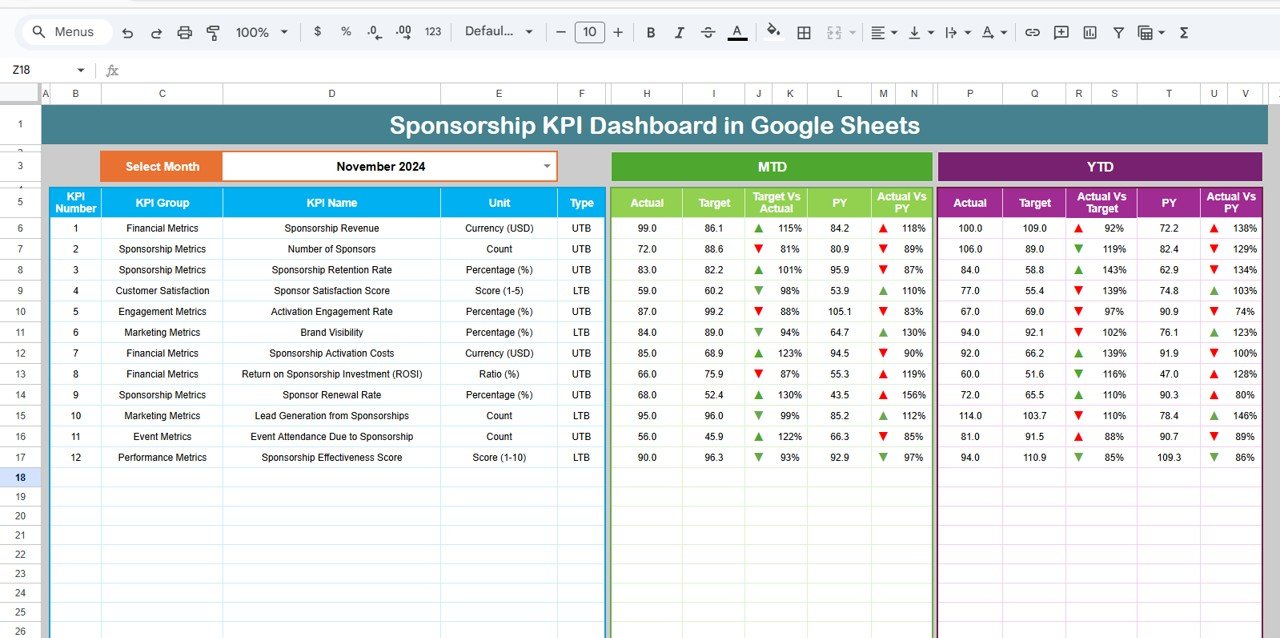
🔼🔽 4. Smart Comparison Arrows
Green arrow = improved performance
Red arrow = decline
This helps you understand results in seconds—no manual analysis required.
☁️ 5. Universal Access via Google Sheets
Enjoy cloud access, real-time edits, version history, and smooth collaboration across teams, clients, or departments.
📦 What’s Inside the Sponsorship KPI Dashboard in Google Sheets
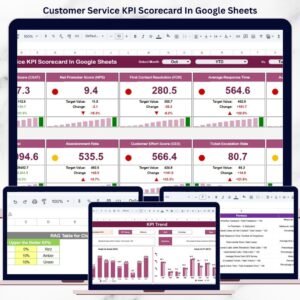
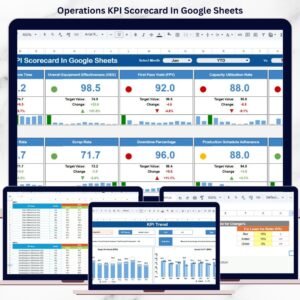
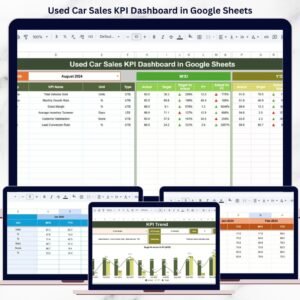
📍 1. Dashboard Sheet – Main Reporting Page
This is your control center for KPI tracking. It displays all MTD and YTD metrics with targets, last year’s numbers, variances, and arrow indicators. Select the month in Cell D3 and watch the entire dashboard transform instantly.
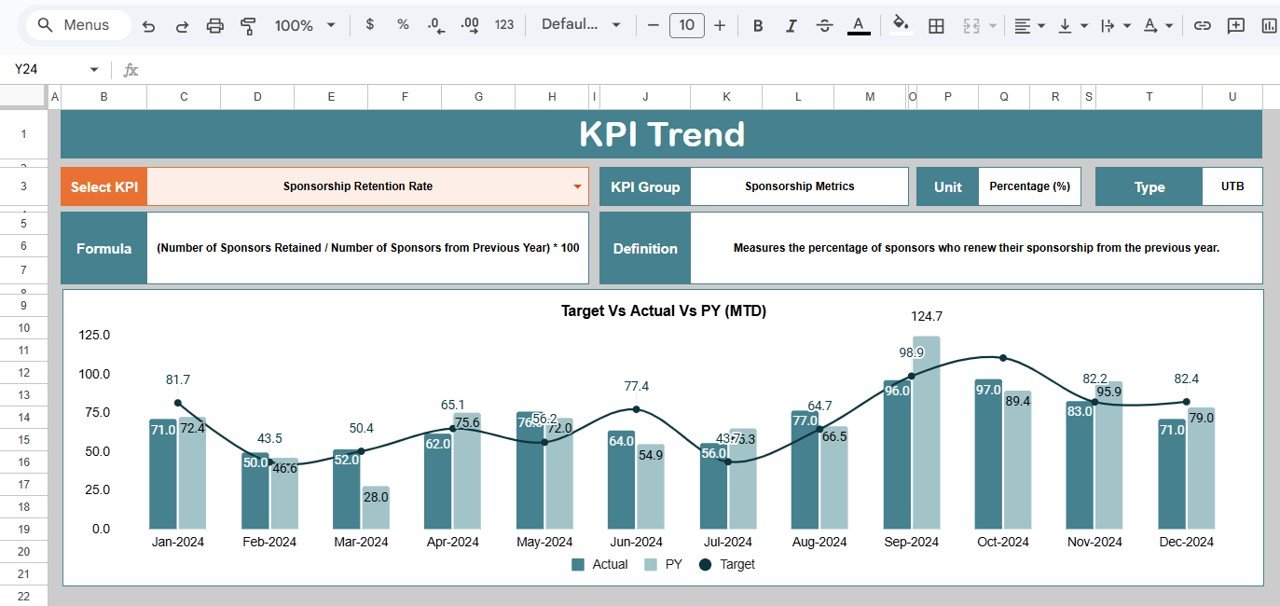
📈 2. KPI Trend Sheet – In-Depth KPI Analysis
Choose any KPI from the dropdown and instantly see:
-
KPI Group
-
KPI Unit
-
KPI Type (UTB/LTB)
-
KPI Formula
-
KPI Definition
-
Monthly Trend Chart
This sheet empowers decision-makers with deep insights into performance movement.
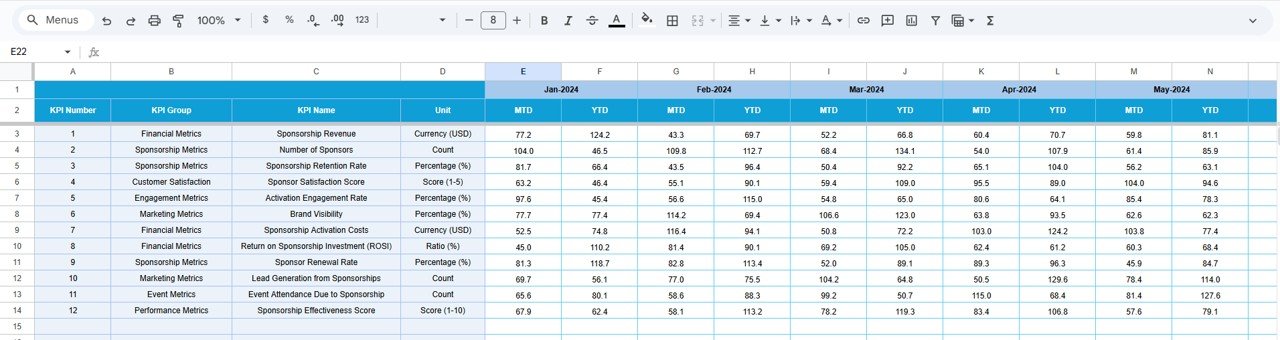
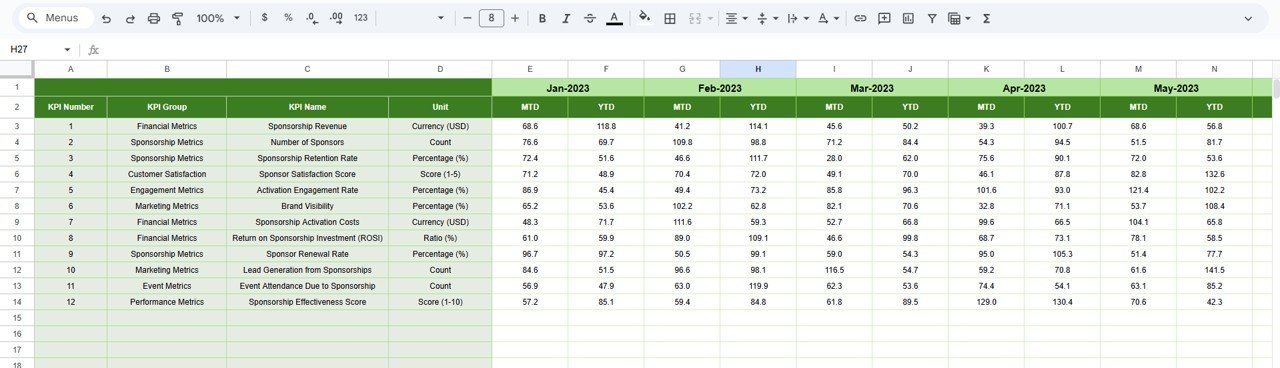
📝 3. Actual Number Sheet – Update Monthly Performance
Enter your real MTD and YTD performance values here. Selecting your starting month in Cell E1 aligns all dashboard calculations perfectly.
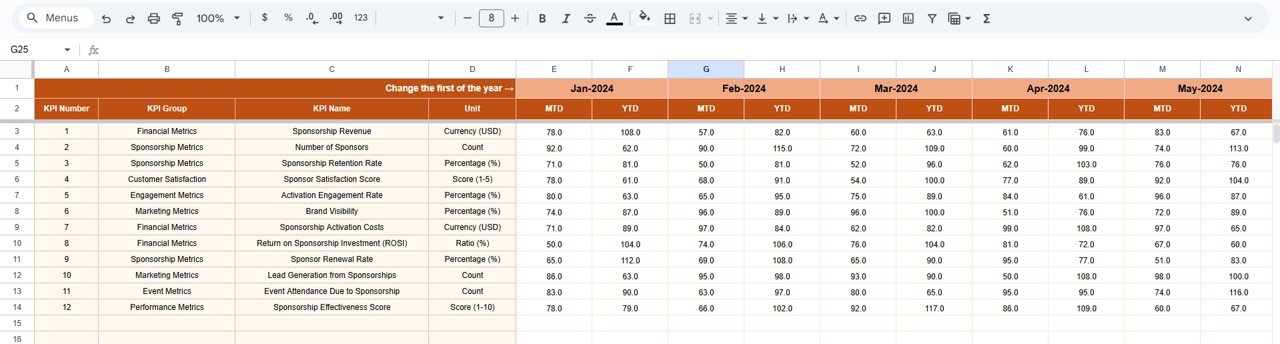
🎯 4. Target Sheet – Input Monthly & Yearly Goals
Add all your MTD and YTD target values. This makes target-vs-actual analysis simple and accurate.
📆 5. Previous Year Sheet – Track Last Year’s Results
Store your previous year’s data to compare long-term growth, retention, performance improvements, and cost changes.
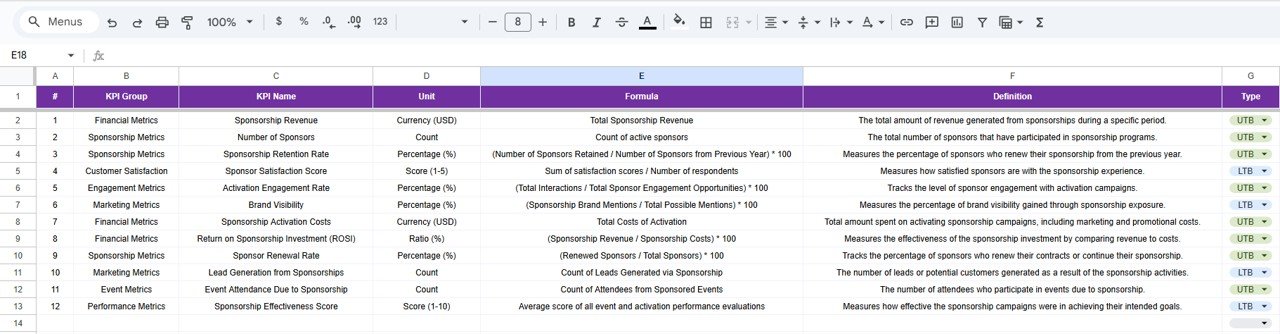
📚 6. KPI Definition Sheet – Complete Reference Guide
Includes KPI names, groups, units, formulas, definitions, and KPI types. Ideal for onboarding new team members and ensuring consistency.
🛠️ How to Use the Sponsorship KPI Dashboard in Google Sheets
1️⃣ Update Actual Values
Enter current MTD & YTD numbers regularly in the Actual sheet.
2️⃣ Add Targets
Input monthly and yearly target goals in the Target sheet.
3️⃣ Select the Month
Control your dashboard using the dropdown at the top.
4️⃣ Review KPI Comparisons
Check green/red arrows, target gaps, and previous-year comparisons.
5️⃣ Analyze Trends
Use the Trend Chart to study monthly movements and adjust strategies.
6️⃣ Use KPI Definitions
Refer to formulas and definitions for accurate reporting.
🎯 Who Can Benefit from This Sponsorship KPI Dashboard in Google Sheets
🏅 Sports Organizations
Track sponsorship value, revenue, and audience engagement.
🎤 Event Management Companies
Monitor impressions, deliverables, cost efficiency, and ROI.
🏢 Corporate Marketing Teams
Measure sponsorship impact on brand visibility and conversions.
🎪 Exhibitions & Trade Shows
Evaluate booth performance, leads generated, and sponsor satisfaction.
🎬 Entertainment & Media Companies
Track exposure, performance value, and content-driven sponsorship outcomes.
📈 Non-Profits & CSR Teams
Monitor sponsorship fulfillment, donor contributions, and impact results.
Click here to read the Detailed blog post
Watch the step-by-step video Demo:


Reviews
There are no reviews yet.