Managing smart city tenders without structured KPI tracking often results in delays, cost overruns, missed deadlines, and weak accountability. Because smart city projects involve public funds, multiple vendors, strict compliance rules, and high public visibility, even a small performance gap can create serious governance issues.
That is exactly why the Smart Cities Tender KPI Dashboard in Power BI is designed as a powerful, ready-to-use performance monitoring solution.
This dashboard converts complex tender data into clear KPIs, visual indicators, and actionable insights. Instead of relying on scattered Excel files and manual reporting, decision-makers get a single, centralized Power BI dashboard that highlights performance gaps, trends, and compliance status—month after month.
🚀 Key Features of Smart Cities Tender KPI Dashboard in Power BI
📊 Centralized KPI Monitoring
Track all smart city tender KPIs from one interactive Power BI dashboard without juggling multiple reports.
📅 Dynamic Month & KPI Group Slicers
Instantly filter KPIs by reporting month or tender category for focused analysis.
🎯 MTD & YTD Performance Tracking
Monitor Month-to-Date and Year-to-Date performance with automatic calculations.
📈 Target vs Actual Comparison
Quickly identify over-performance or under-performance using percentage metrics and visual indicators.
🔁 Current Year vs Previous Year Analysis
Understand year-over-year tender performance trends for better planning.
🟢🔴 Visual Performance Indicators
Green and red icons instantly highlight KPIs that meet or miss targets.
📂 Excel-Based Data Input
Simple Excel structure ensures easy data updates without technical complexity.
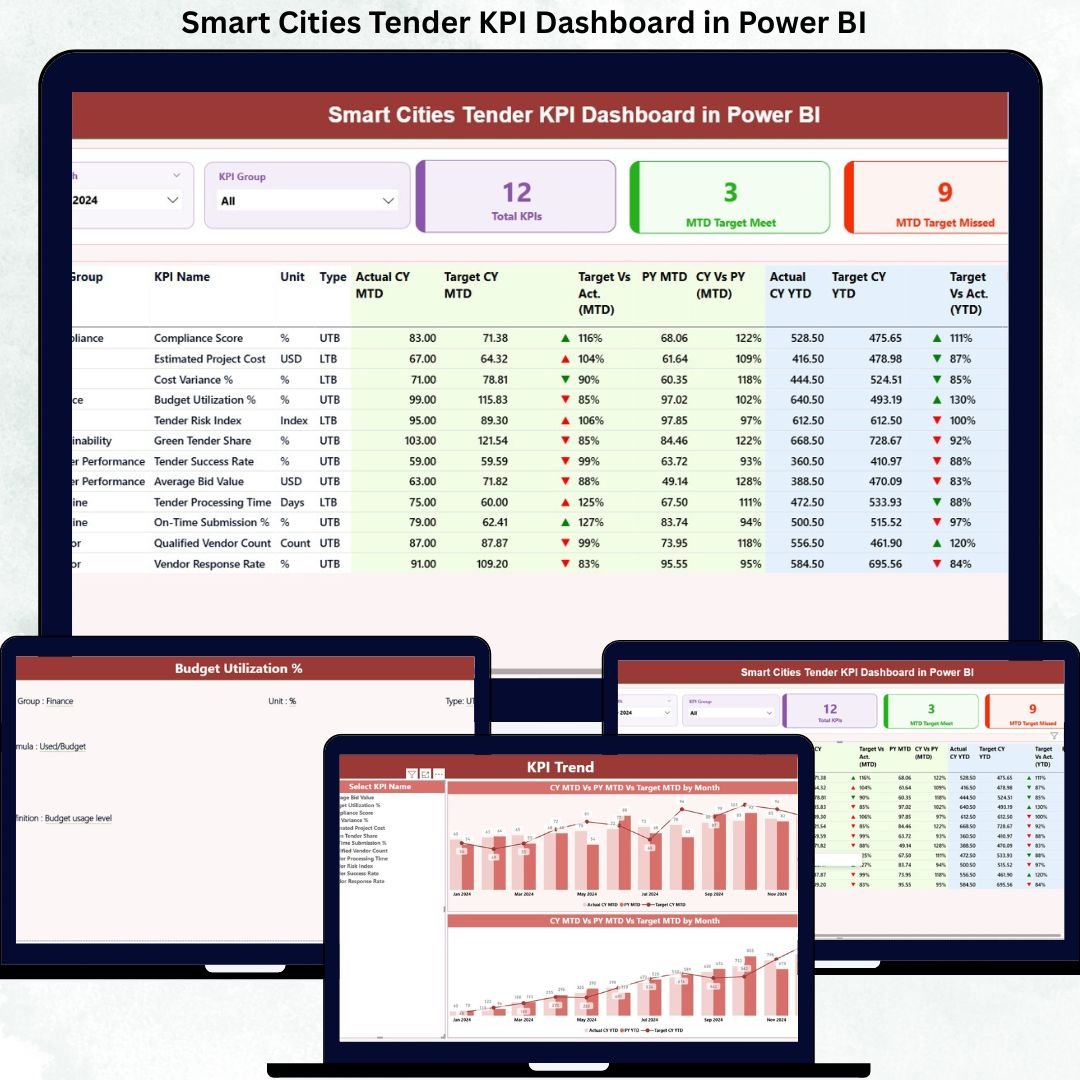
📦 What’s Inside the Smart Cities Tender KPI Dashboard
This Power BI file includes three powerful analytical pages, each serving a specific purpose:
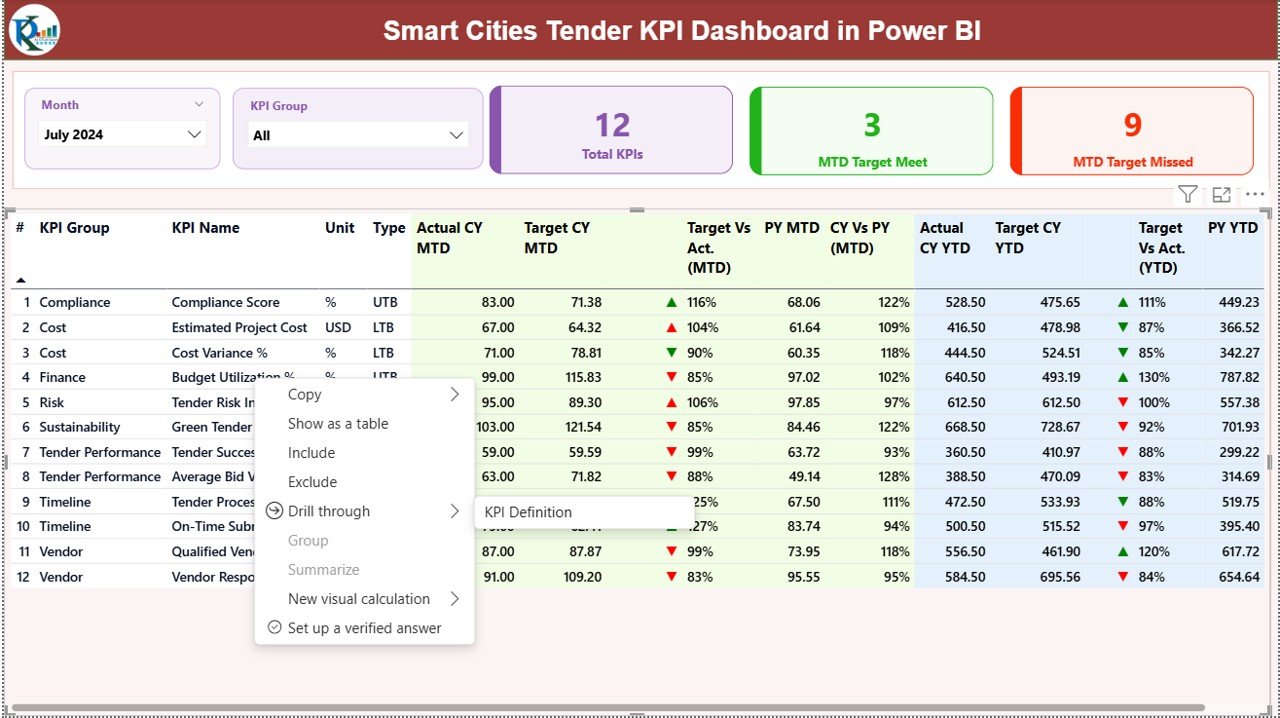
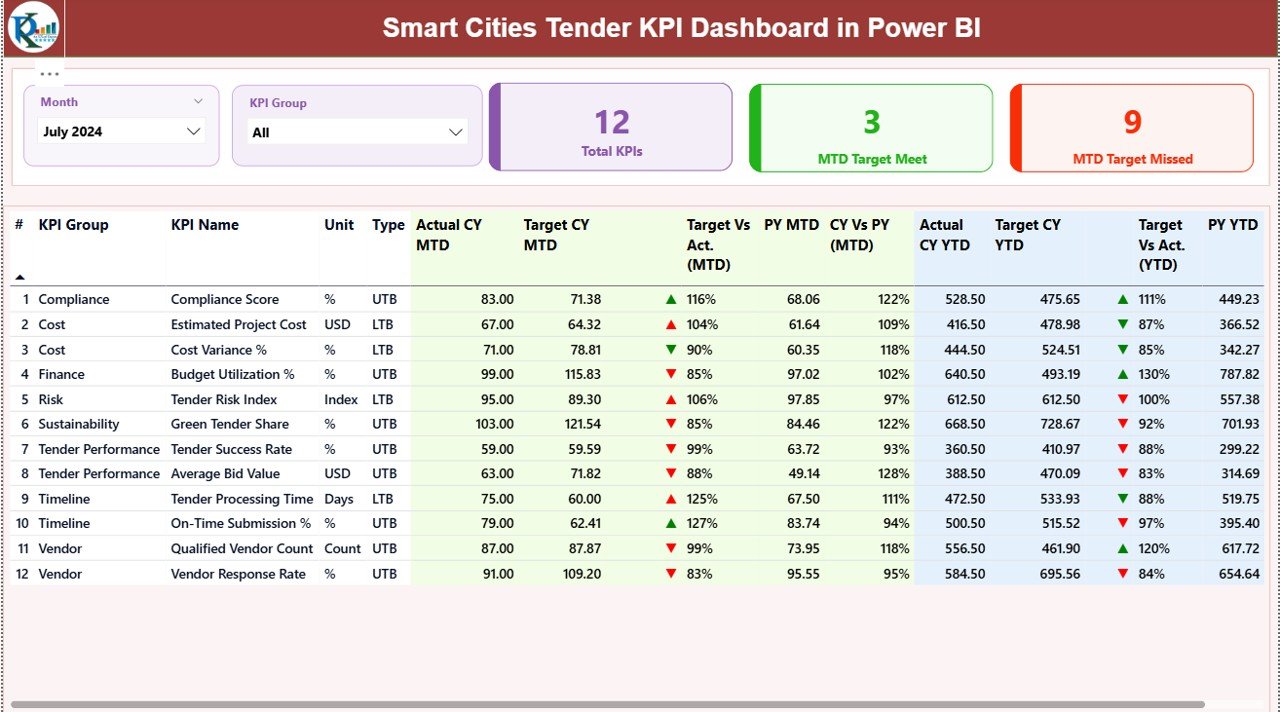
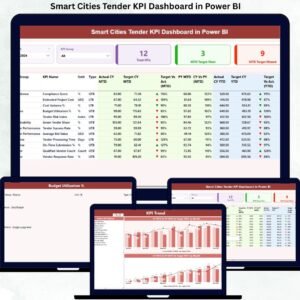
📌 Summary Page
Acts as the main control center showing:
-
Total KPI Count
-
MTD Target Met Count
-
MTD Target Missed Count
-
A detailed KPI table with MTD and YTD performance metrics
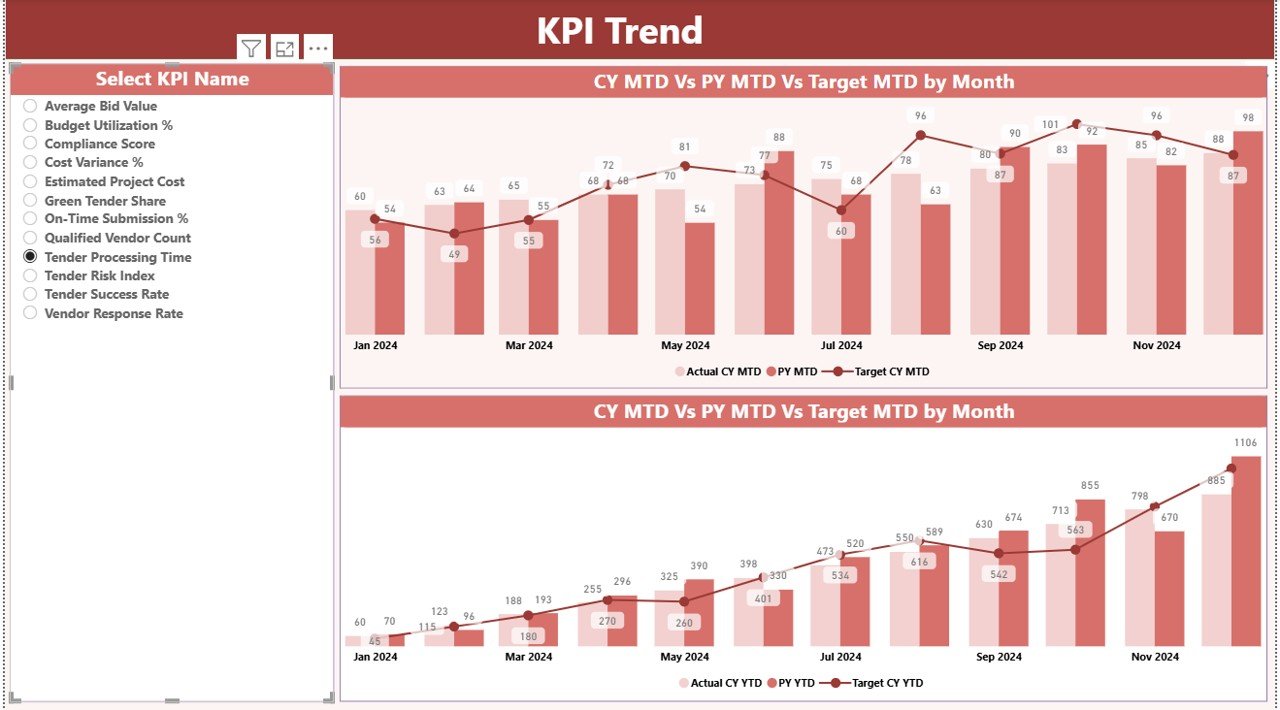
📌 KPI Trend Page
Helps analyze performance over time using:
-
MTD combo charts (Actual, Target, Previous Year)
-
YTD combo charts
-
KPI selection slicer for focused trend analysis
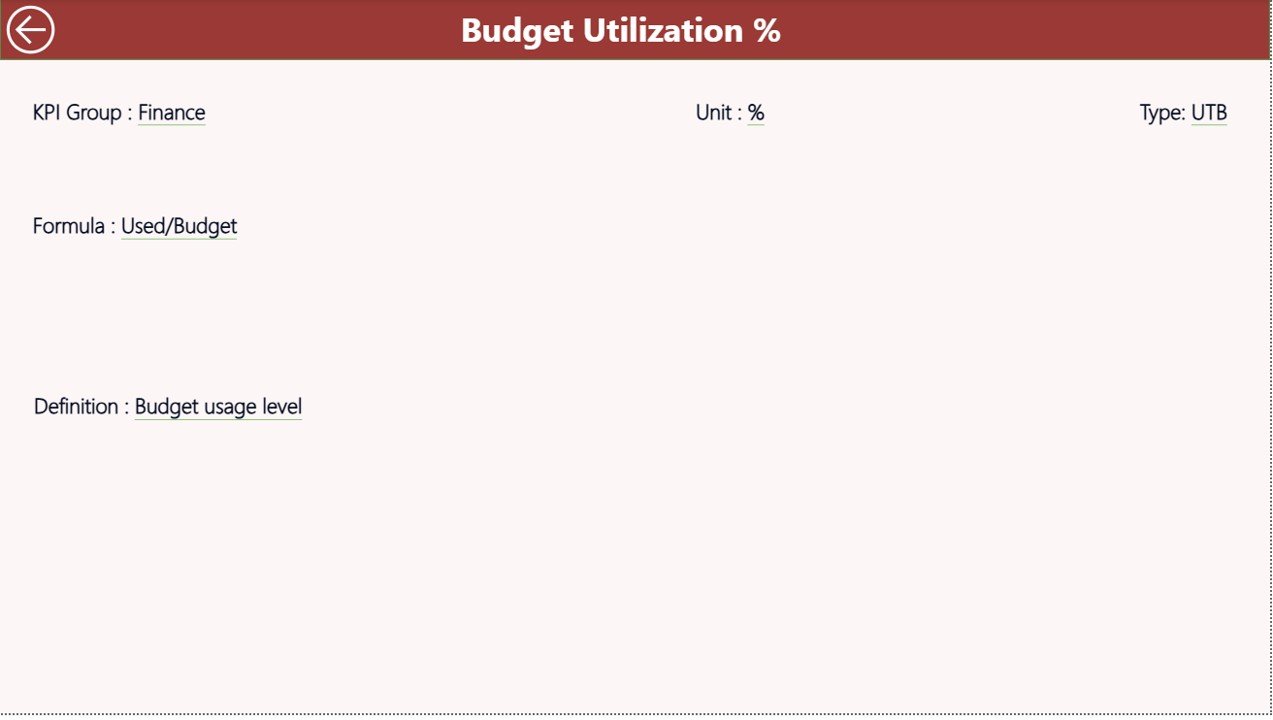
📌 KPI Definition Page
Provides complete KPI transparency with:
-
KPI formula
-
Definition
-
Unit of measurement
-
LTB / UTB logic
This structure ensures clarity, traceability, and trust in every KPI.
🛠️ How to Use the Smart Cities Tender KPI Dashboard
Using this dashboard is simple and user-friendly:
1️⃣ Enter actual tender performance data in the Input_Actual Excel sheet
2️⃣ Enter target values in the Input_Target Excel sheet
3️⃣ Define or modify KPIs in the KPI Definition sheet
4️⃣ Refresh the Power BI report
5️⃣ Use slicers, visuals, and drill-through options to analyze performance
No advanced Power BI skills are required, making it suitable for both technical and non-technical users.
👥 Who Can Benefit from This Smart Cities Tender KPI Dashboard
🏛️ Smart City Mission Offices
📑 Government Procurement Teams
🏙️ Urban Development Authorities
📊 Public Sector Project Managers
🛡️ Policy, Audit & Compliance Teams
📉 Monitoring & Evaluation Units
Anyone responsible for monitoring smart city tender performance will benefit from this dashboard.
Click here to read the Detailed Blog Post
Watch the step-by-step video tutorial:
Visit our YouTube channel to learn step-by-step video tutorials:
https://youtube.com/@PKAnExcelExpert


Reviews
There are no reviews yet.