Smart cities are reshaping urban living through large-scale infrastructure projects, digital services, and public–private partnerships. However, behind every successful smart city initiative lies one critical challenge—effective contract management. When hundreds of contracts across departments, cities, and vendors are tracked manually in scattered spreadsheets, visibility drops, costs rise, and decisions slow down.
That is exactly why the Smart Cities Contract Management Dashboard in Excel becomes an essential solution. 🚀
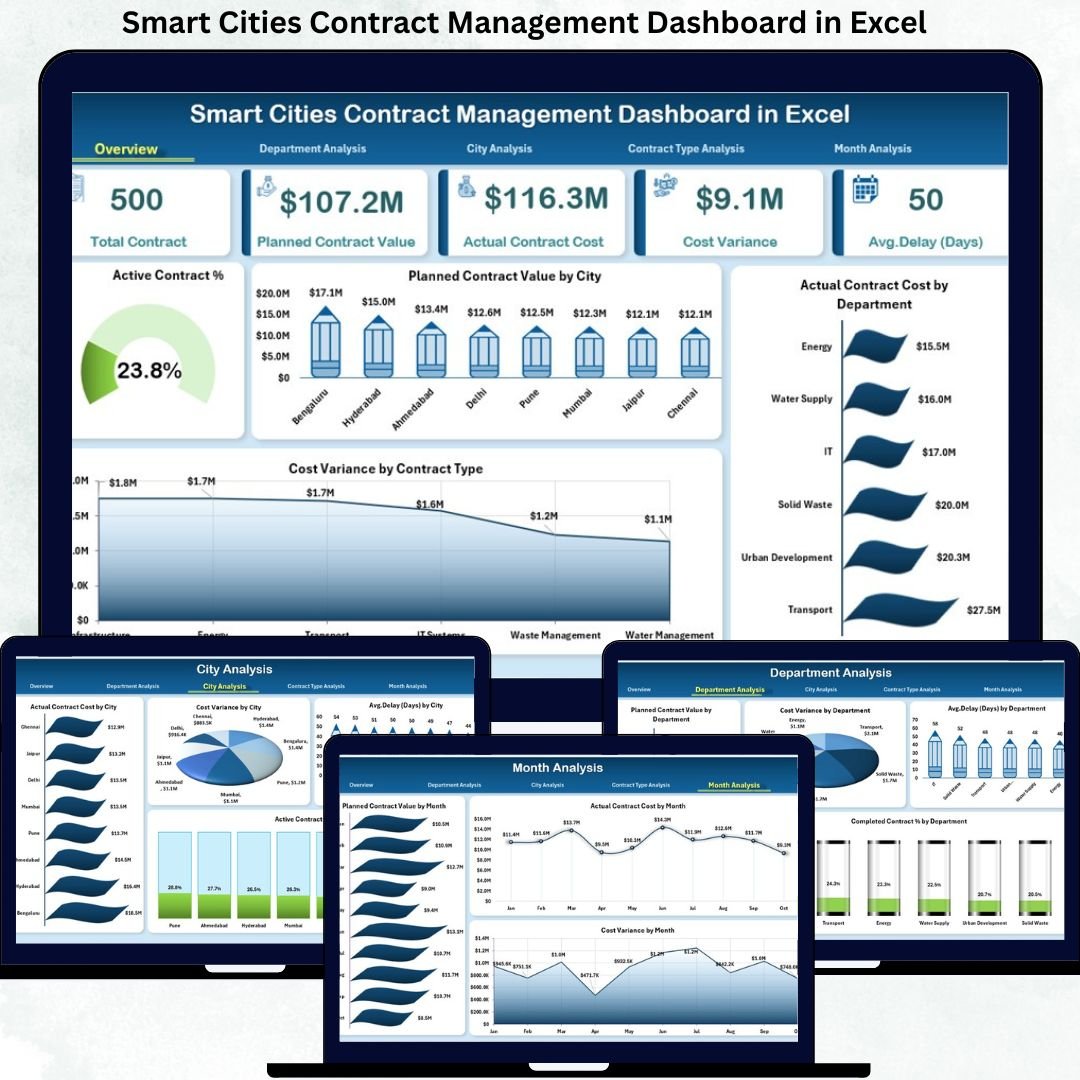
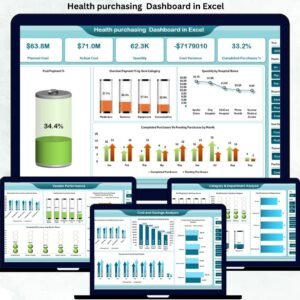
This professionally designed Excel dashboard transforms complex contract data into clear KPIs, interactive charts, and actionable insights. As a result, government bodies, urban planners, and smart city project teams gain full control over contract performance, cost variance, delays, and completion status—without investing in expensive BI tools.
Built entirely in Microsoft Excel, this dashboard delivers clarity, accountability, and confidence for managing smart city contracts efficiently.
Key Features of Smart Cities Contract Management Dashboard in Excel 🔑
📊 Centralized Contract Visibility
Track all smart city contracts from a single Excel dashboard.
📈 Planned vs Actual Cost Tracking
Monitor contract cost overruns and savings with real-time variance insights.
🏙️ City-Wise & Department-Wise Analysis
Compare contract performance across cities and departments easily.
⏱️ Delay & Completion Monitoring
Identify delayed contracts early and track completion percentages.
🧭 Interactive Slicers & Page Navigator
Filter data by city, department, contract type, or month instantly.
📅 Monthly Trend Analysis
Understand time-based patterns for better planning and budgeting.
⚡ Fast Decision-Making
Visual insights replace manual reporting and guesswork.
What’s Inside the Smart Cities Contract Management Dashboard in Excel 📁
This ready-to-use Excel solution includes six structured analytical pages, a Data Sheet, and a Support Sheet, all designed for clarity and usability.
📄 Overview Page
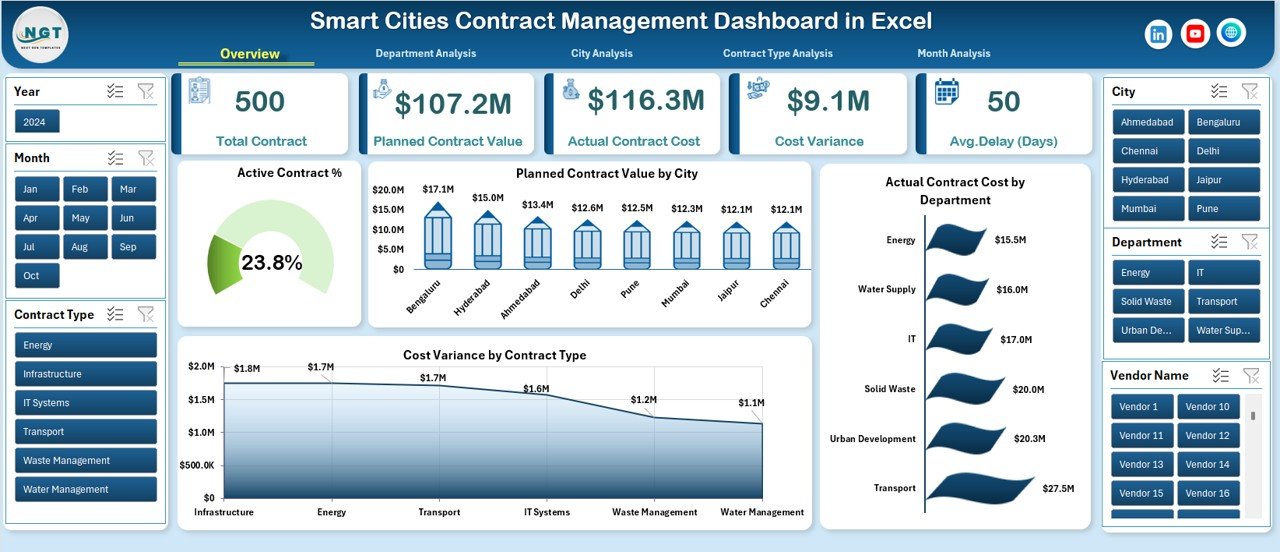
The executive summary page that provides a high-level snapshot of contract performance.
Includes:
-
KPI Cards: Active Contract %, key contract indicators
-
Active Contract %
-
Planned Contract Value by City
-
Actual Contract Cost by Department
-
Cost Variance by Contract Type
This page helps leadership understand contract health within seconds.
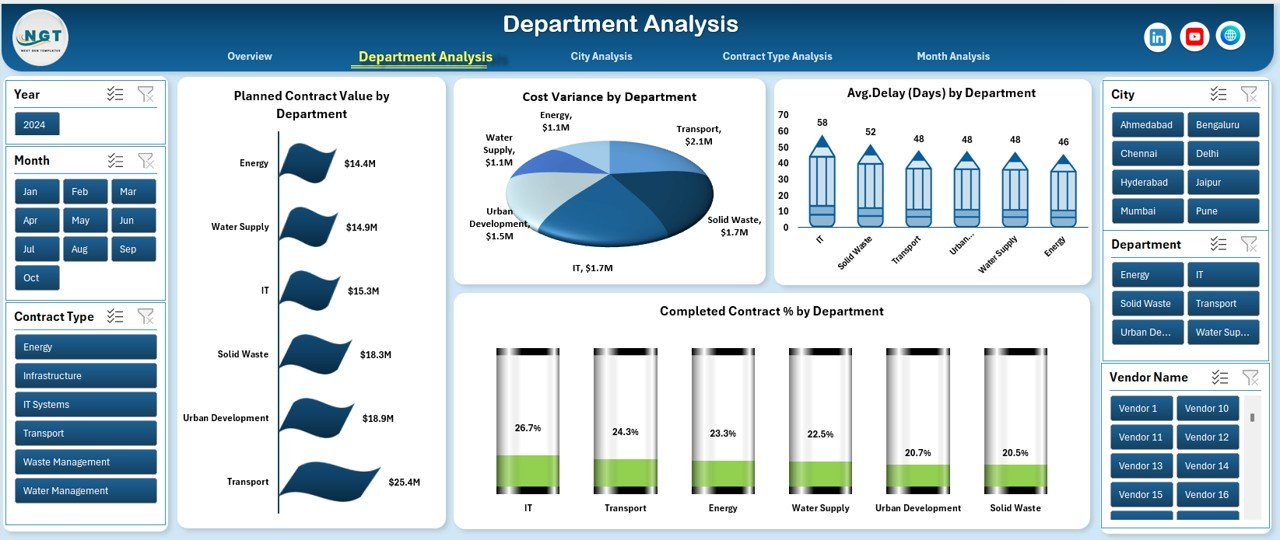
📄 Department Analysis Page
Focuses on departmental contract efficiency and accountability.
Includes:
-
Planned Contract Value by Department
-
Cost Variance by Department
-
Average Delay by Department
-
Completed Contract % by Department
Helps identify departments causing delays or cost overruns.
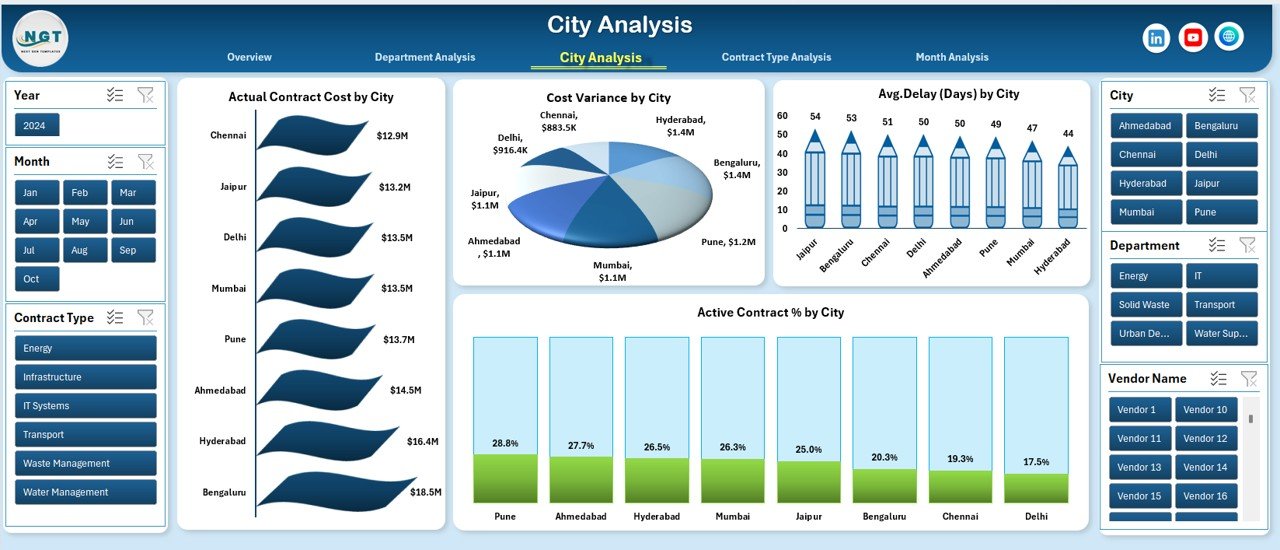
📄 City Analysis Page
Provides city-wise visibility for multi-city smart projects.
Includes:
-
Actual Contract Cost by City
-
Cost Variance by City
-
Average Delay by City
-
Active Contract % by City
Supports benchmarking and city-level performance reviews.
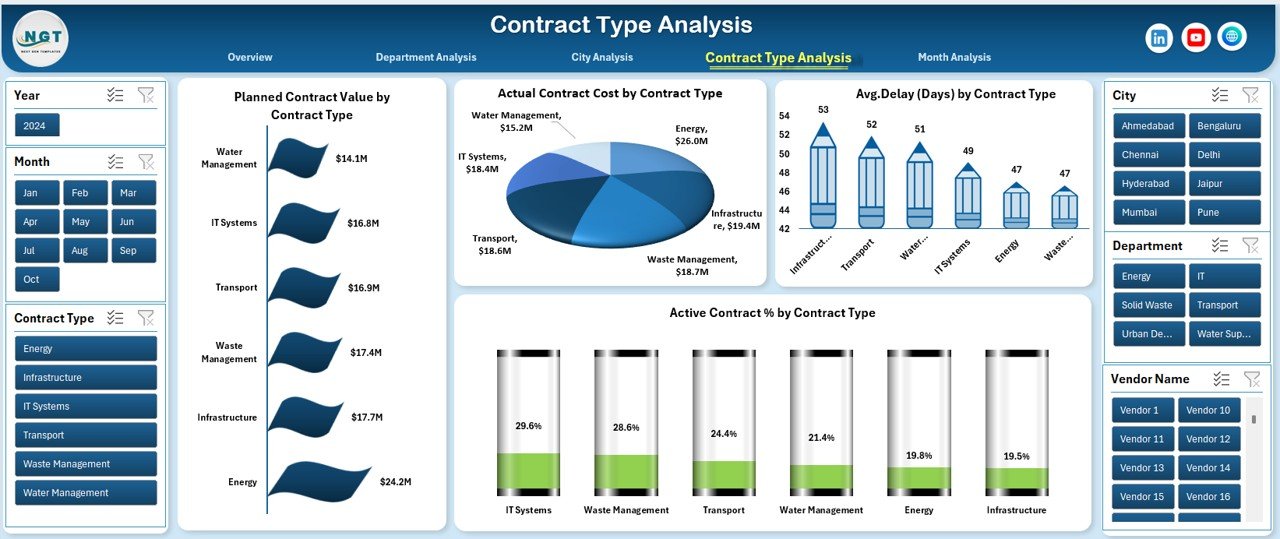
📄 Contract Type Analysis Page
Analyzes contract behavior by contract category.
Includes:
-
Planned Contract Value by Contract Type
-
Actual Contract Cost by Contract Type
-
Average Delay by Contract Type
-
Active Contract % by Contract Type
Enables strategic decisions for future contract planning.
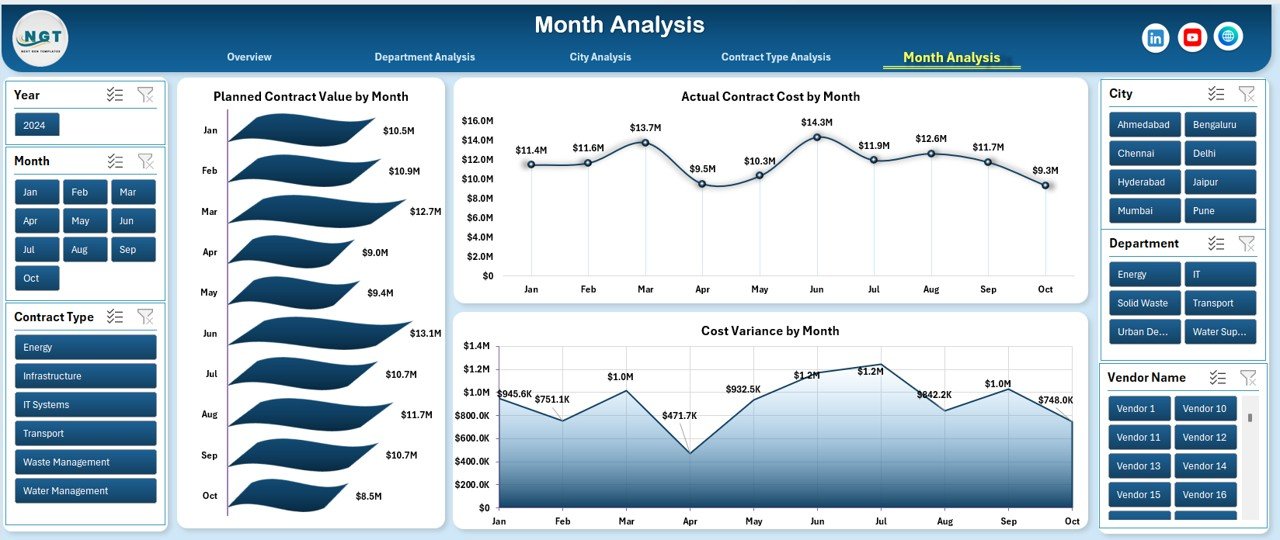
📄 Month Analysis Page
Tracks contract performance trends over time.
Includes:
-
Planned Contract Value by Month
-
Actual Contract Cost by Month
-
Cost Variance by Month
Helps forecast budgets and detect seasonal cost patterns.
📄 Data Sheet & Support Sheet
-
Data Sheet stores all raw contract records (city, department, value, cost, delay, status).
-
Support Sheet manages dropdowns, mappings, and helper calculations to keep the dashboard smooth and dynamic.
How to Use the Smart Cities Contract Management Dashboard in Excel 🛠️
1️⃣ Enter or update contract data in the Data Sheet
2️⃣ Use slicers to filter by city, department, contract type, or month
3️⃣ Review KPIs, cost variance, and delays instantly
4️⃣ Identify risks and improvement areas
5️⃣ Use insights for reviews, audits, and planning
No advanced Excel skills are required. The dashboard is user-friendly and ready to use.
Who Can Benefit from This Smart Cities Contract Dashboard 👥
🏙️ Smart City Project Managers – Track performance across initiatives
🏛️ Government Procurement Teams – Improve contract governance
💰 Finance & Audit Teams – Monitor cost variance and compliance
📊 Urban Planning Departments – Compare city-wise performance
👔 Policy Makers & Administrators – Make confident decisions
🧑💼 Consultants & PMOs – Deliver data-driven insights
Ideal for multi-city, multi-department smart city programs.


Reviews
There are no reviews yet.