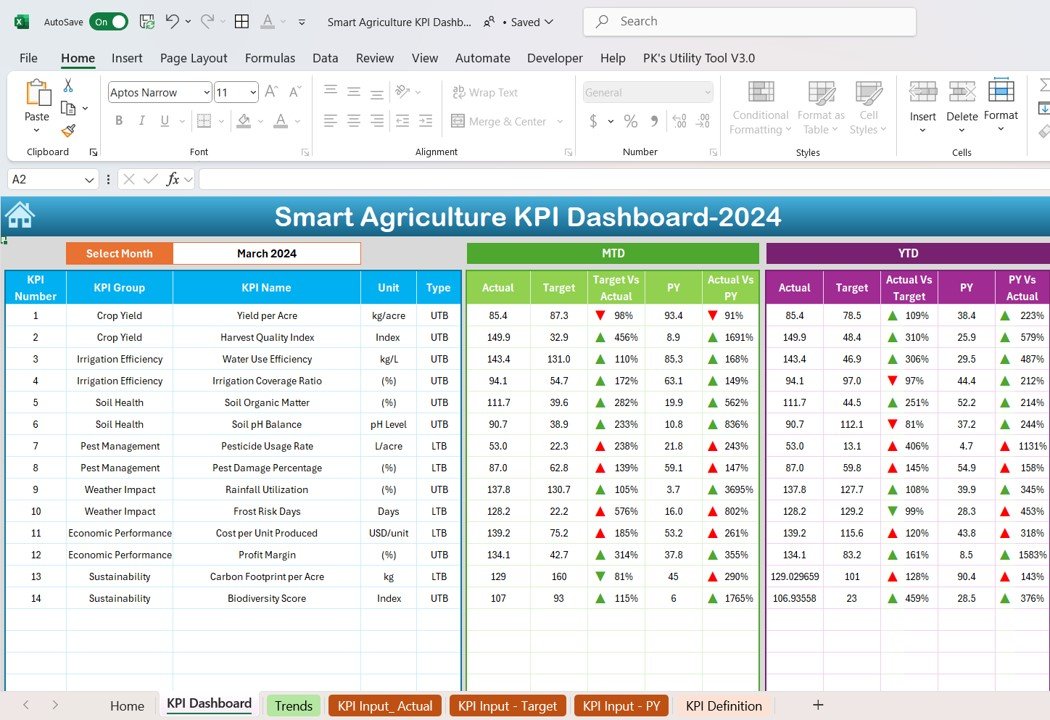
The Smart Agriculture KPI Dashboard in Excel is an essential tool for modern farmers, agricultural businesses, and organizations in the agricultural sector. This advanced Excel-based dashboard allows you to track and analyze key performance indicators (KPIs) such as crop yield, soil health, irrigation efficiency, pest management, and weather patterns. By offering real-time insights into these crucial areas, the dashboard helps optimize agricultural operations, improve productivity, and enhance resource management.
Whether you’re managing a large-scale farm, a greenhouse, or a sustainable agricultural initiative, the Smart Agriculture KPI Dashboard in Excel provides valuable data to drive decision-making and boost overall farm performance. It enables farmers and agricultural professionals to make data-driven decisions that improve crop production, reduce costs, and maximize yield while ensuring sustainability.
Key Features of the Smart Agriculture KPI Dashboard in Excel
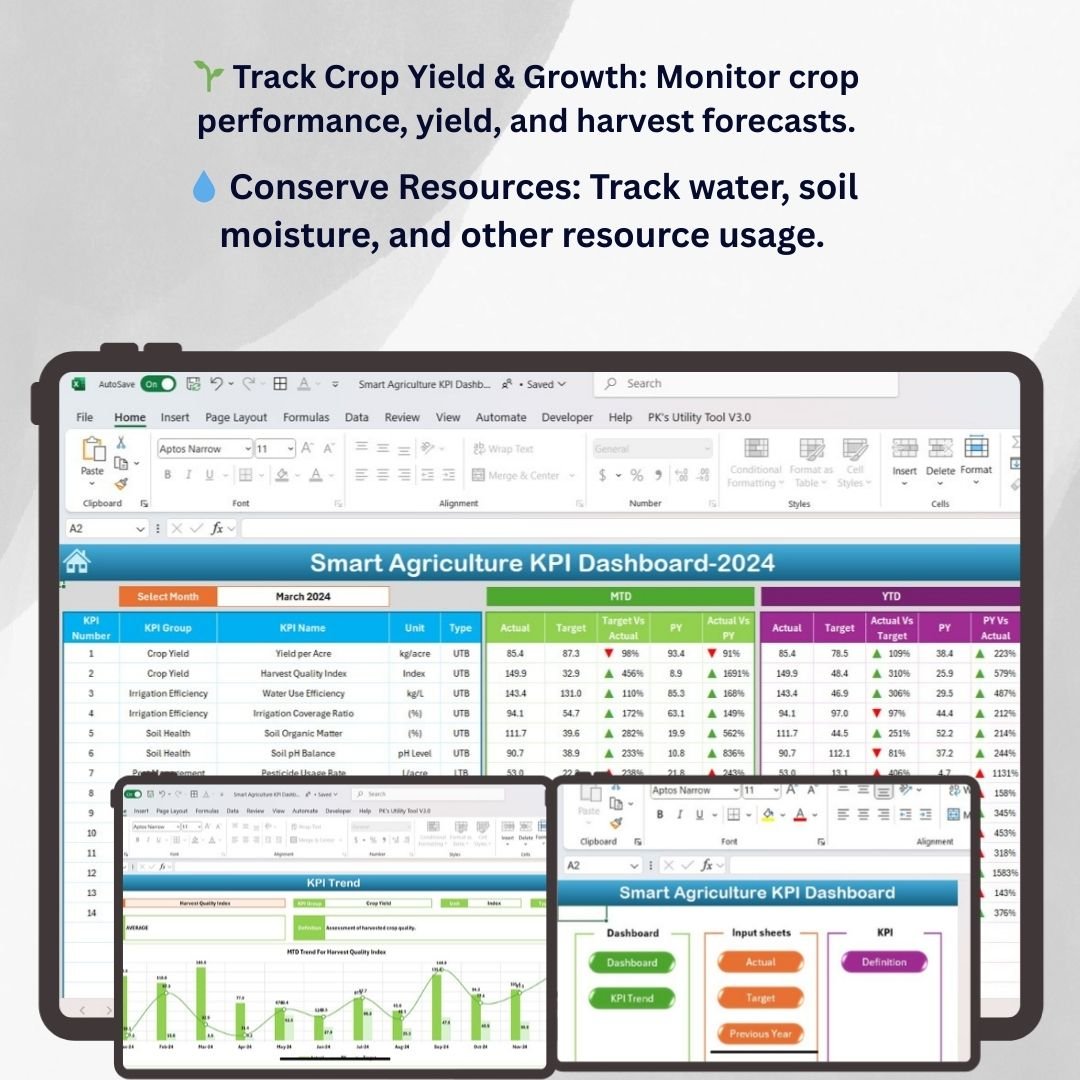
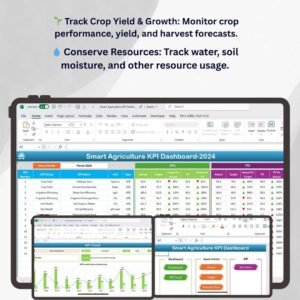
🌱 Track Crop Yield & Growth
Monitor crop performance in real-time. Track yield rates, growth stages, and harvest forecasts to ensure optimal production and make informed decisions about planting and harvesting.
⚡ Irrigation Efficiency Monitoring
Track water usage and optimize irrigation methods for maximum efficiency. The dashboard helps you ensure that water resources are used efficiently, reducing waste and ensuring healthy crop growth.
📊 Pest & Disease Management
Monitor pest populations and disease outbreaks. Track pesticide usage and analyze the effectiveness of pest control methods to ensure sustainable practices while minimizing environmental impact.
💧 Water & Resource Conservation
Track water usage, soil moisture levels, and other resources critical to sustainable farming. Make informed decisions to reduce resource consumption and maintain soil health for long-term productivity.
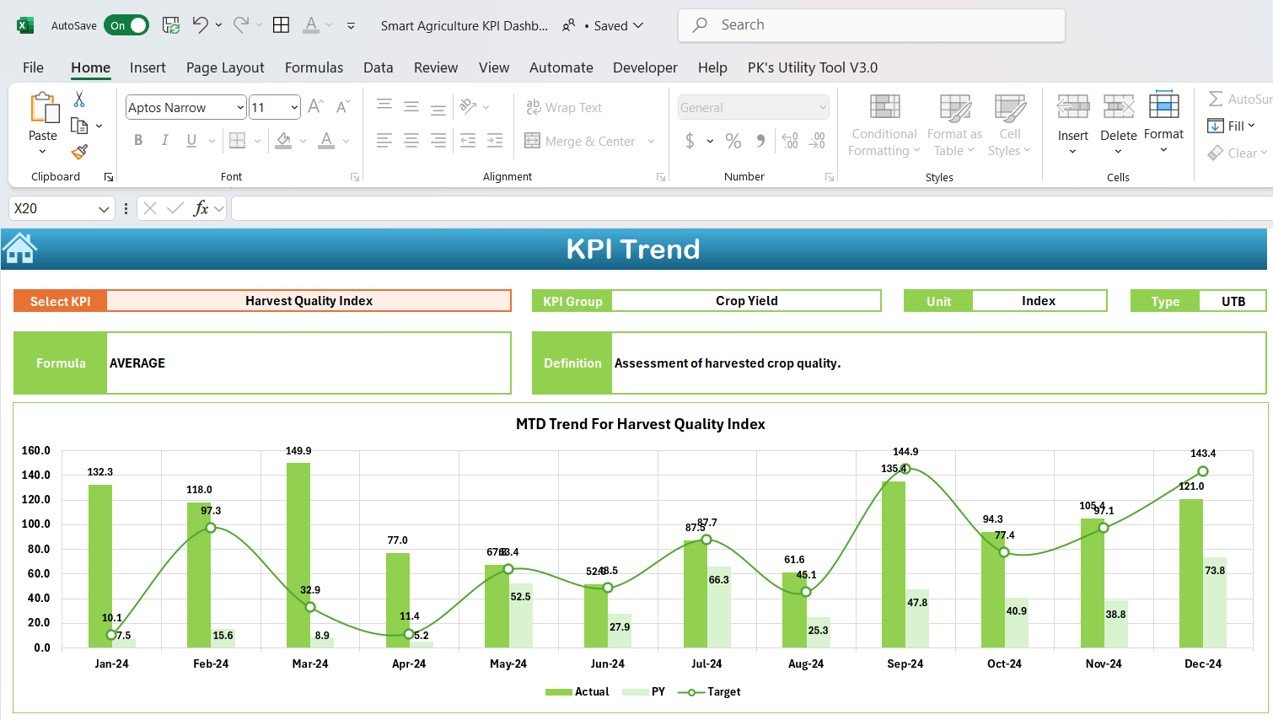
🖥️ Interactive & Real-Time Data Insights
The Excel dashboard is fully interactive, allowing you to customize KPIs, explore data in-depth, and get real-time updates on the most critical factors affecting your agricultural performance.
Why You’ll Love the Smart Agriculture KPI Dashboard in Excel
✅ Optimize Crop Production & Yield
Track crop performance to ensure optimal growth and harvest timing. Maximize yield by making data-driven decisions based on real-time tracking of crop growth and yield forecasts.
✅ Improve Irrigation Efficiency
Monitor water usage and irrigation efficiency to ensure that crops are receiving the right amount of water. Optimize irrigation schedules and reduce water wastage.
✅ Enhance Pest & Disease Control
Track pest and disease data to improve pest management strategies. Use the dashboard to monitor pesticide usage, track efficacy, and adjust strategies as needed to protect crops.
✅ Track Resource Consumption & Conservation
Monitor water, soil, and other resource usage to optimize resource conservation efforts. Use insights from the dashboard to reduce costs and improve sustainability.
✅ Make Data-Driven Decisions for Sustainability
Leverage real-time insights to optimize your farming operations, ensuring that your agricultural practices are both cost-effective and environmentally sustainable.
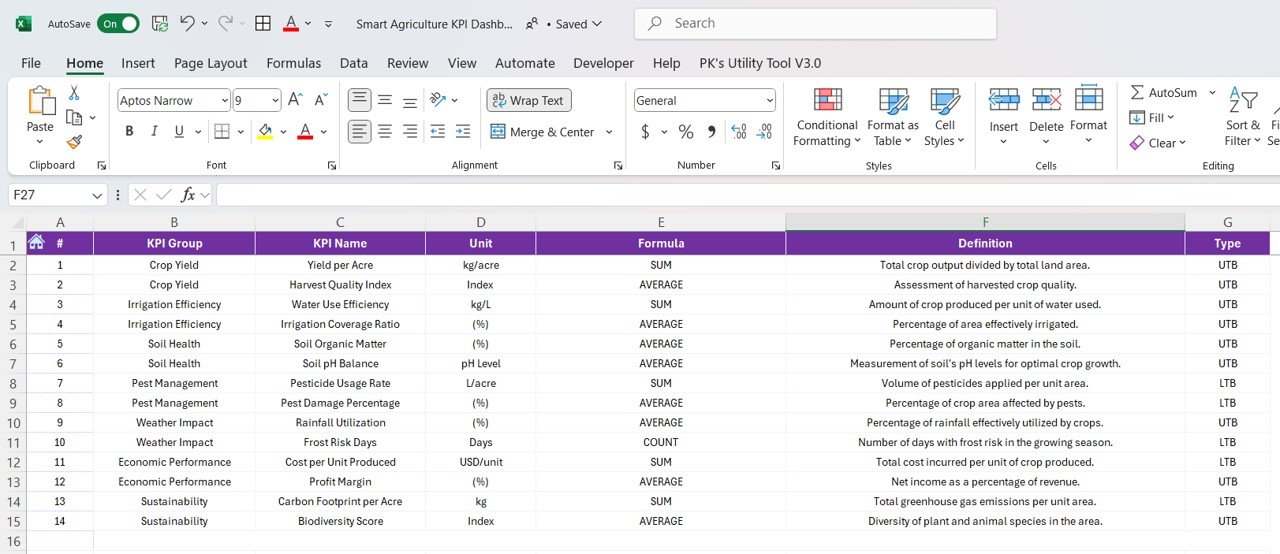
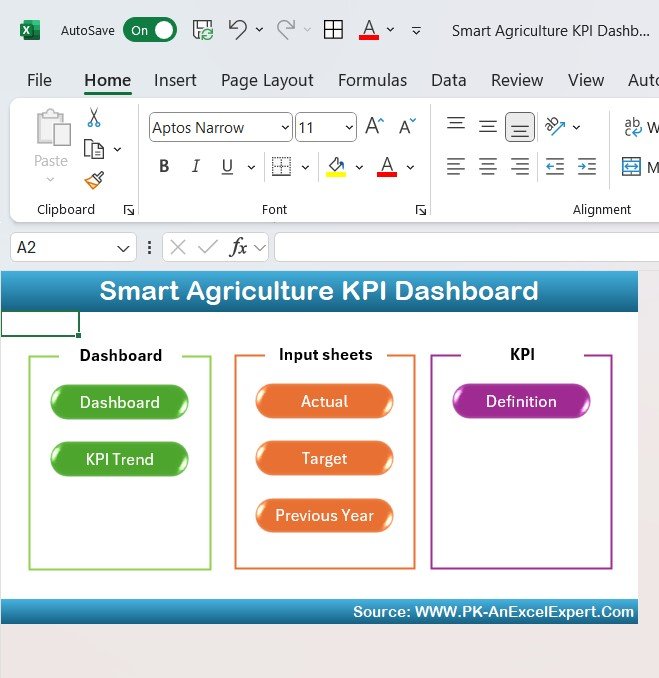
What’s Inside the Smart Agriculture KPI Dashboard Template?
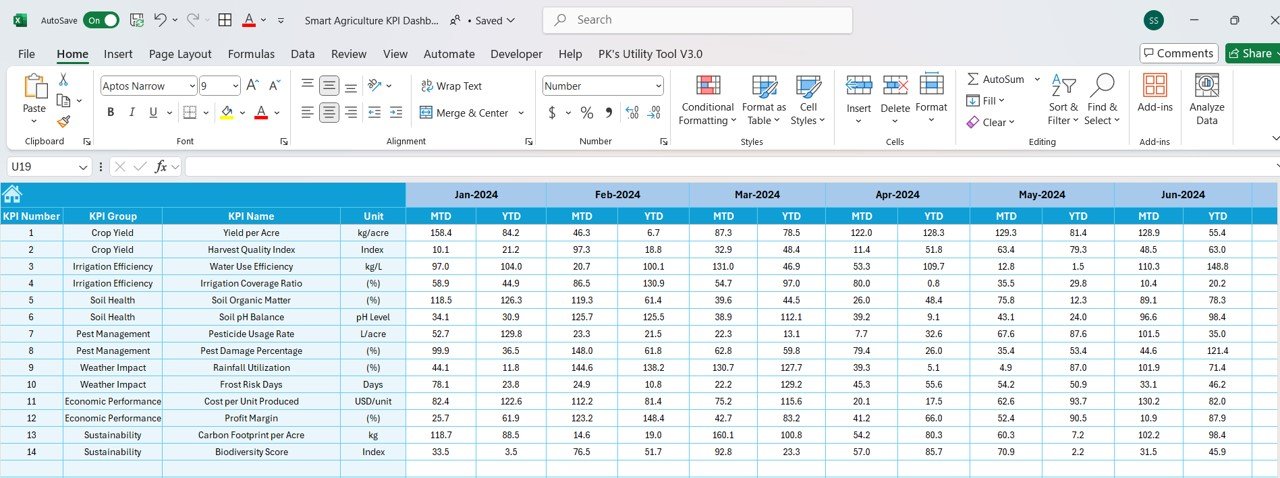
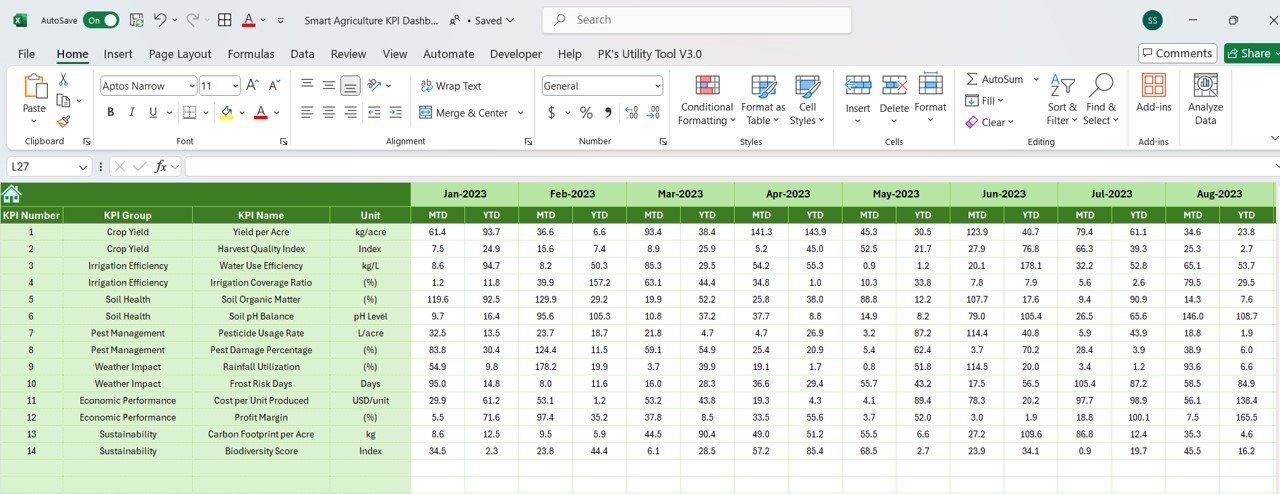
- Crop Yield & Growth Monitoring: Track crop yield, growth stages, and harvest forecasts for informed decisions.
- Irrigation & Water Usage Tracking: Monitor water consumption and optimize irrigation methods.
- Pest & Disease Management: Track pest control measures and monitor pest and disease outbreaks.
- Resource Conservation: Monitor water usage, soil moisture, and other resources to optimize conservation efforts.
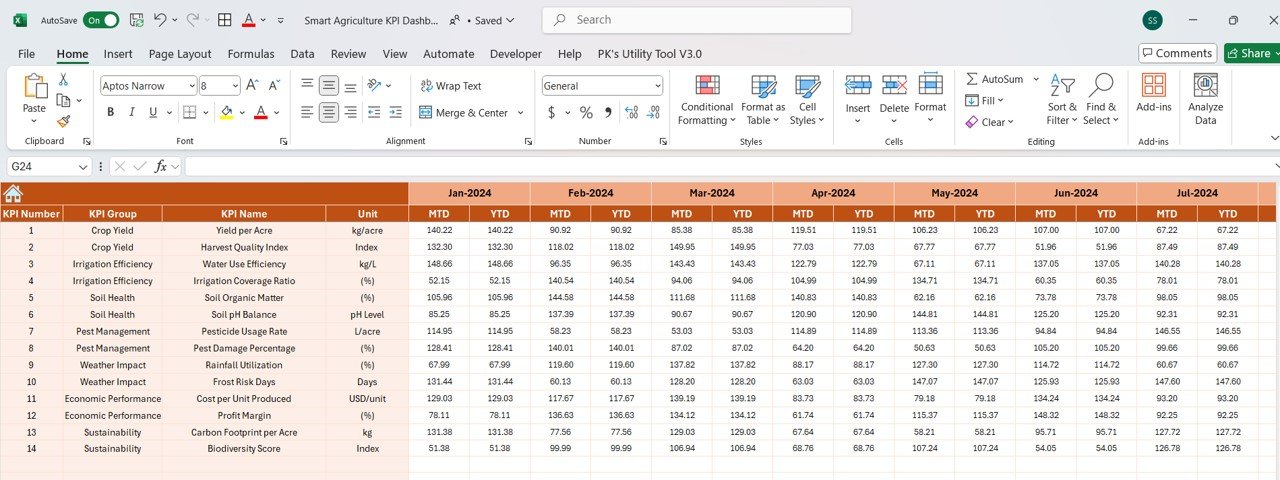
- Real-Time Insights: Get up-to-date data on key agricultural KPIs to improve productivity.
- Customizable KPIs: Adjust the dashboard to track specific farming metrics that are important to your operations.
How to Use the Smart Agriculture KPI Dashboard in Excel
1️⃣ Download the Template: Get instant access to your Smart Agriculture KPI Dashboard in Excel.
2️⃣ Input Your Data: Enter data related to crop yield, irrigation, pest management, and resource usage into the dashboard.
3️⃣ Track & Monitor KPIs: Use the dashboard to track crop performance, water usage, pest control, and resource consumption in real-time.
4️⃣ Analyze & Optimize: Use the insights from the dashboard to optimize your farming practices, reduce costs, and increase yield.
Who Can Benefit from the Smart Agriculture KPI Dashboard in Excel?
🔹 Farmers & Agricultural Managers
🔹 Sustainable Agriculture Organizations
🔹 Greenhouse Operators & Crop Producers
🔹 Agricultural Consultants & Experts
🔹 Farm Operations & Resource Managers
🔹 Anyone Interested in Improving Agricultural Efficiency & Sustainability
Optimize your farming operations with the Smart Agriculture KPI Dashboard in Excel. Track critical metrics like crop yield, irrigation efficiency, pest management, and resource conservation to improve sustainability, reduce costs, and maximize yield.
Click here to read the Detailed blog post
Visit our YouTube channel to learn step-by-step video tutorials
Youtube.com/@PKAnExcelExpert


Reviews
There are no reviews yet.