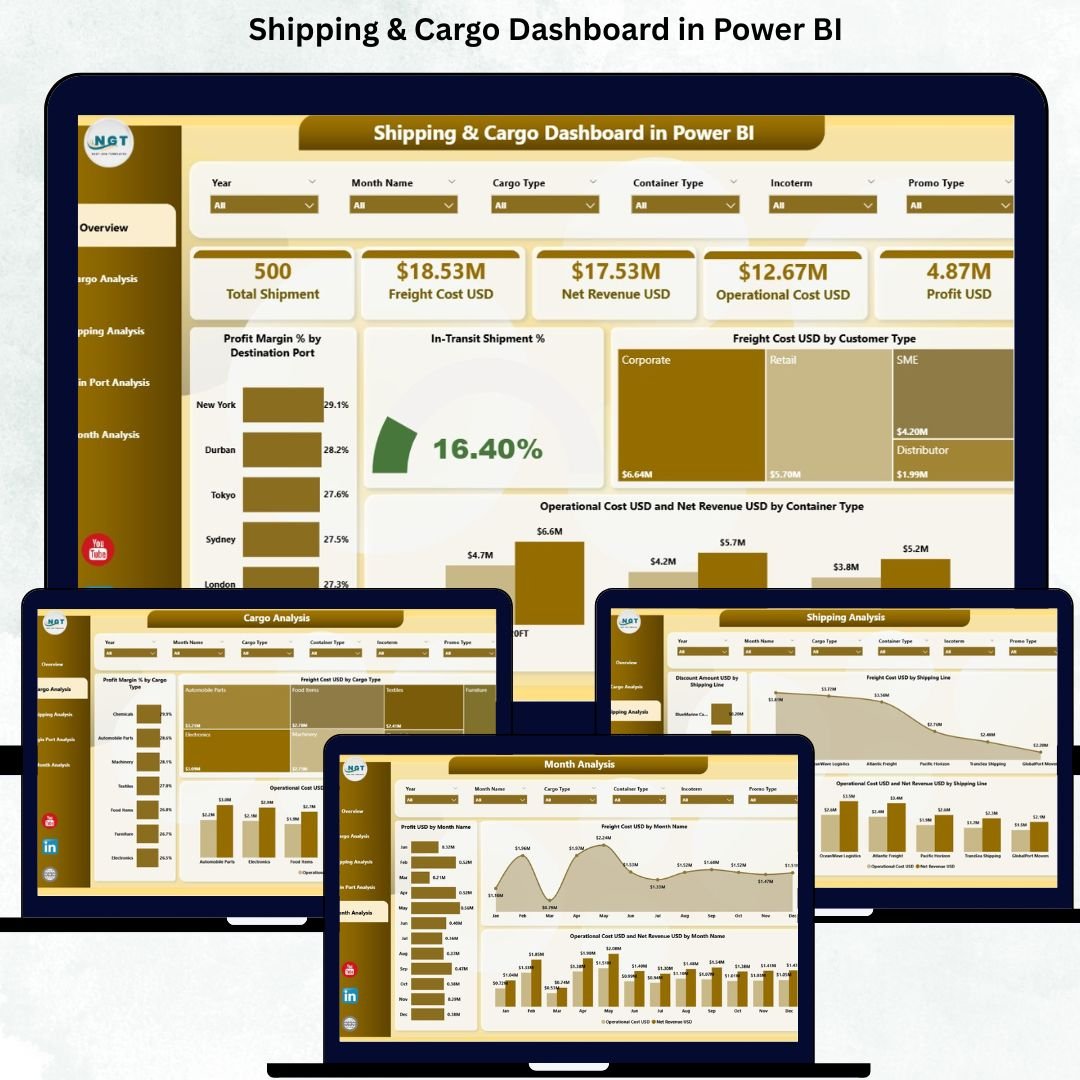
Shipping and cargo operations are becoming more complex every year. Logistics companies manage thousands of shipments, multiple ports, diverse customer types, and multiple cost components—all at the same time. When this information is scattered across files and spreadsheets, teams lose visibility and spend more time searching than analyzing. That’s where the Shipping & Cargo Dashboard in Power BI becomes a powerful game changer.
This ready-to-use dashboard gives logistics teams a clear, visual, and interactive way to track shipping performance in real time. Whether you want to monitor profit, cost, cargo performance, shipping line efficiency, or port-level contribution, everything is available on one screen. With dynamic slicers, drill-down visuals, and instant filtering, you can make decisions faster, reduce cost, and improve operational planning.
Power BI refreshes visuals automatically, allowing teams to see the latest numbers without manual reporting. You no longer need dozens of spreadsheets—this dashboard brings clarity, speed, and powerful insights to your logistics operations.
📊 Key Features of the Shipping & Cargo Dashboard in Power BI
The dashboard contains five fully interactive analysis pages, each focused on a different area of logistics performance.
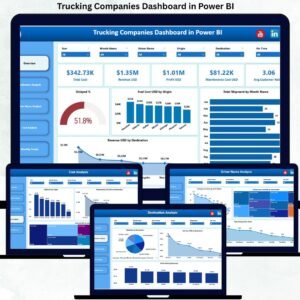
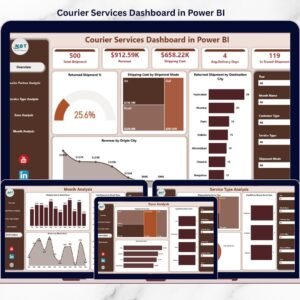
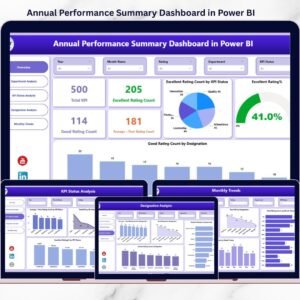
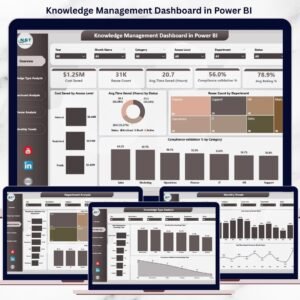
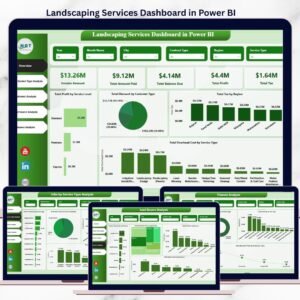
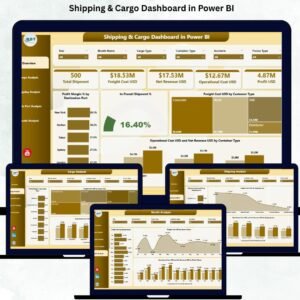
⭐ 1. Overview Page – Your Main Control Center
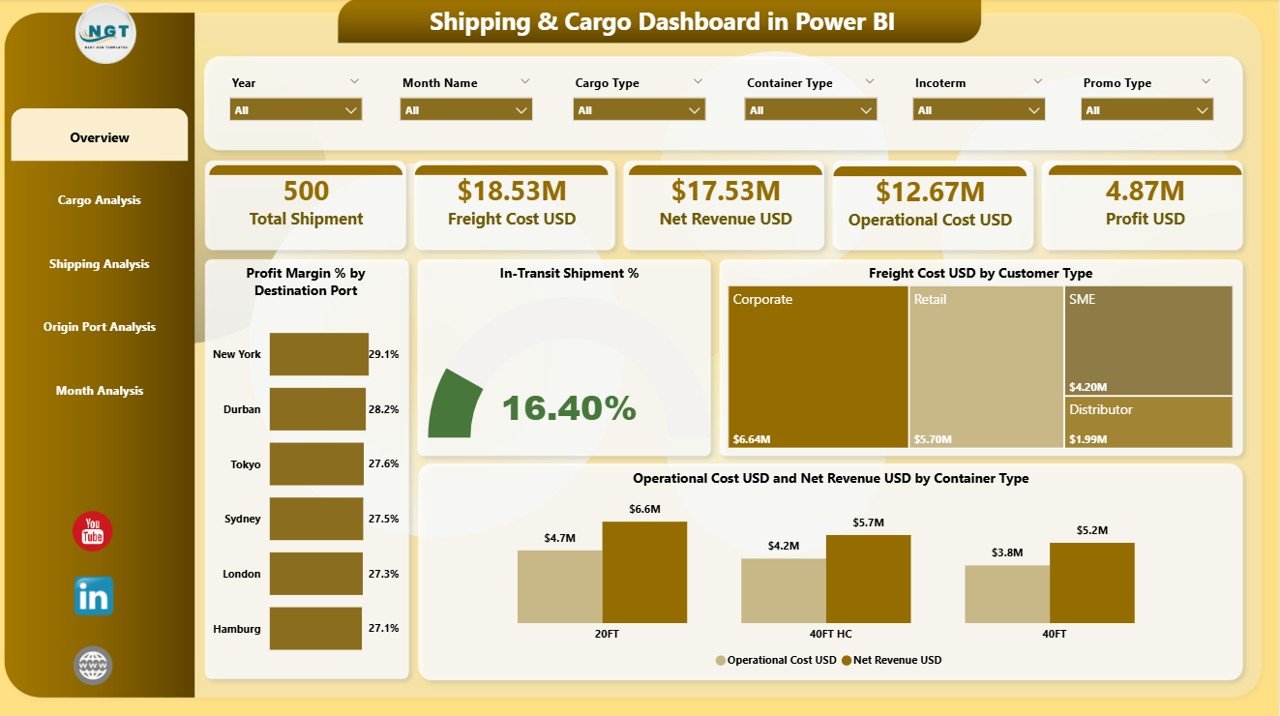
The Overview Page gives a complete snapshot of business performance.
It includes:
-
✔ Interactive slicers to filter by port, customer type, cargo type, shipping line, and month
-
✔ Four essential KPI cards:
-
Profit Margin %
-
In-Transit Shipment %
-
Freight Cost USD
-
Operation Cost USD
-
-
✔ Powerful charts:
-
Profit Margin % by Destination Port
-
In-Transit Shipment %
-
Freight Cost USD by Customer Type
-
Operation Cost USD & Net Revenue USD by Container Type
-
This page helps managers understand profitability, cost, and cargo movement instantly.
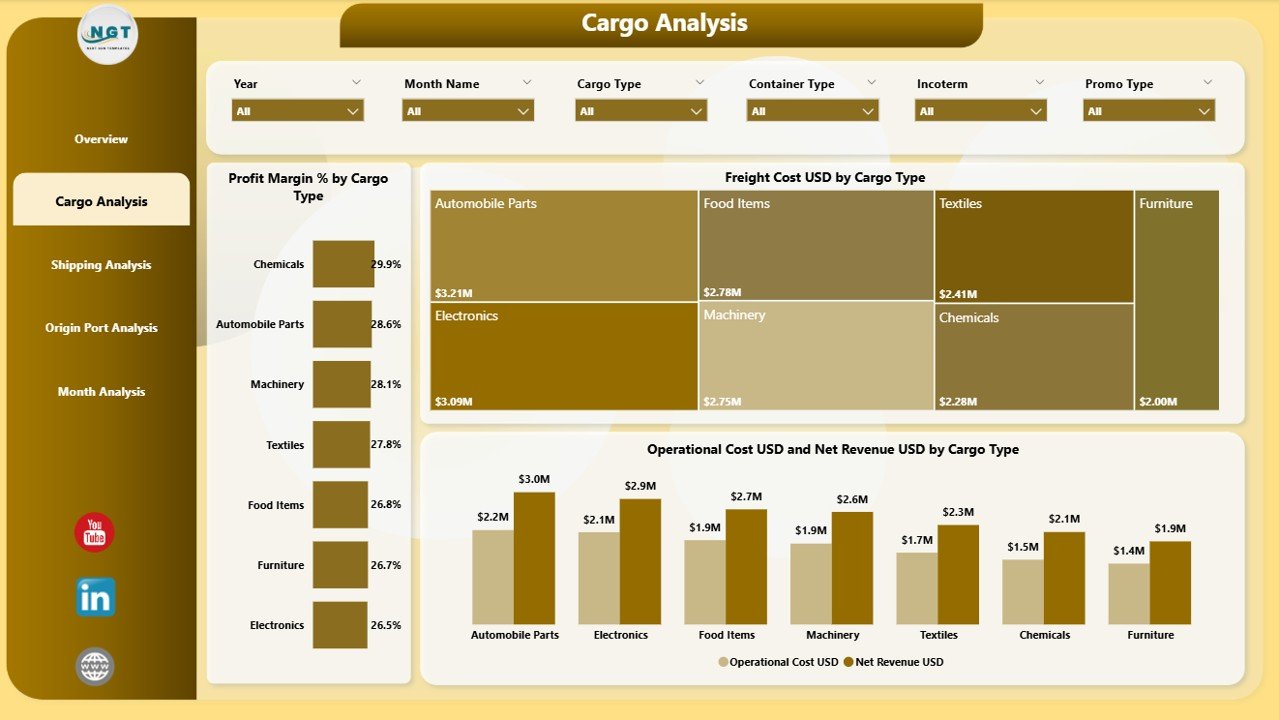
⭐ 2. Cargo Analysis Page – Understand Cargo Profitability
Different cargo types produce different results.
This page displays:
-
✔ Profit Margin % by Cargo Type
-
✔ Freight Cost USD by Cargo Type
-
✔ Operation Cost USD vs Net Revenue USD by Cargo Type
These insights help you identify high-margin cargo, control cost, and make smarter cargo planning decisions.
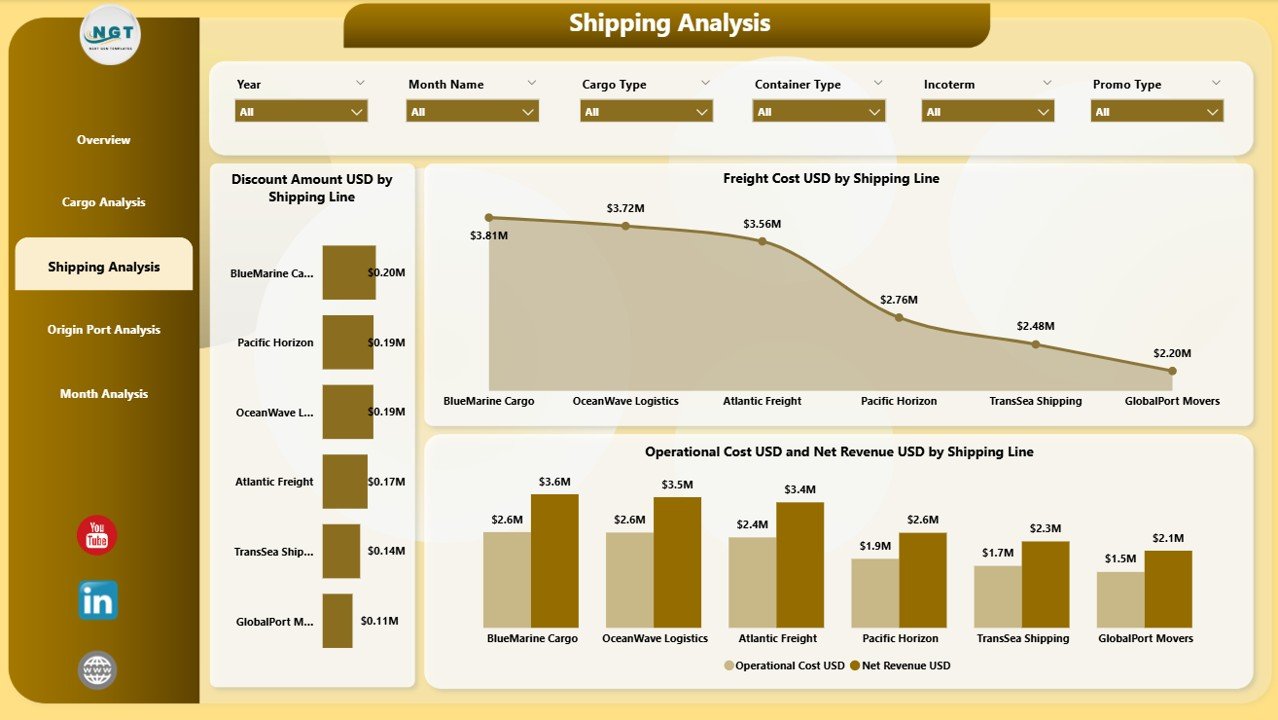
⭐ 3. Shipping Analysis Page – Measure Shipping Line Performance
Every shipping line operates differently.
This page shows:
-
✔ Discount Amount USD by Shipping Line
-
✔ Freight Cost USD by Shipping Line
-
✔ Operation Cost USD vs Net Revenue USD by Shipping Line
This makes it easy to choose profitable shipping partners and negotiate better rates.
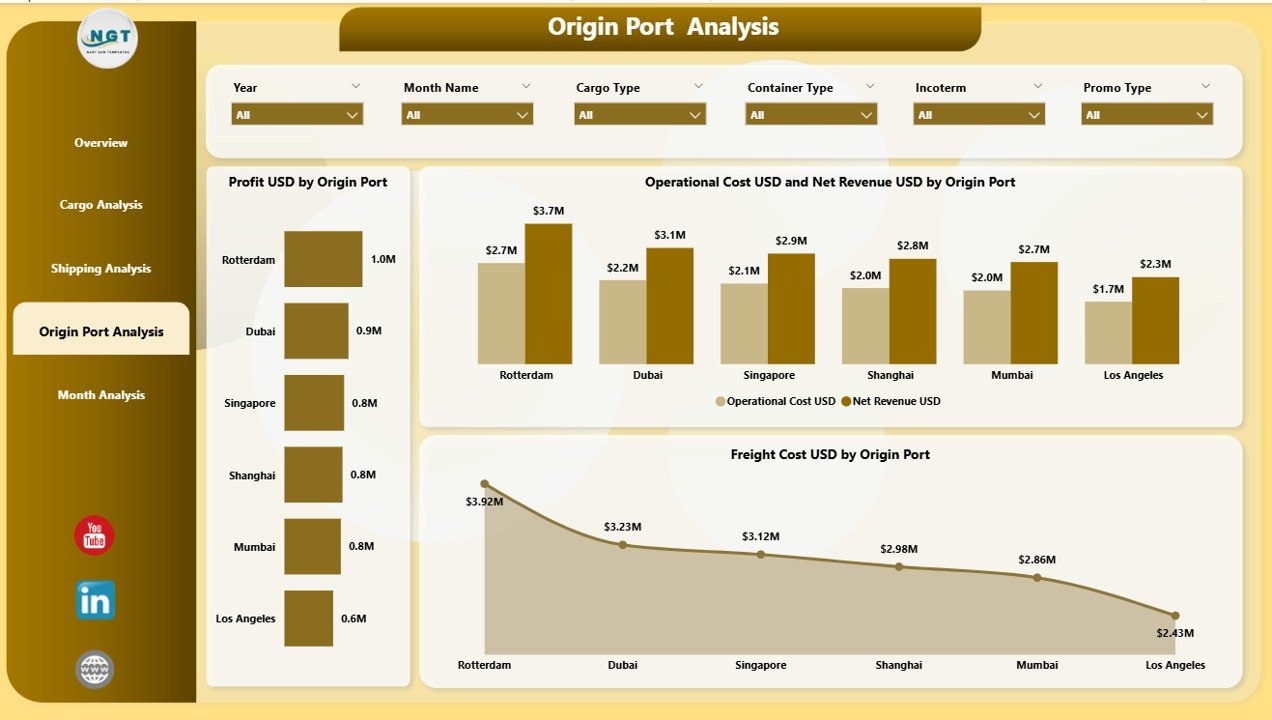
⭐ 4. Origin Port Analysis Page – Track Port-Level Contribution
Origin ports influence cost, time, and profit.
This page includes:
-
✔ Profit USD by Origin Port
-
✔ Freight Cost USD by Origin Port
-
✔ Operation Cost USD vs Net Revenue USD by Origin Port
You’ll clearly see which ports contribute more to business growth and which increase operational cost.
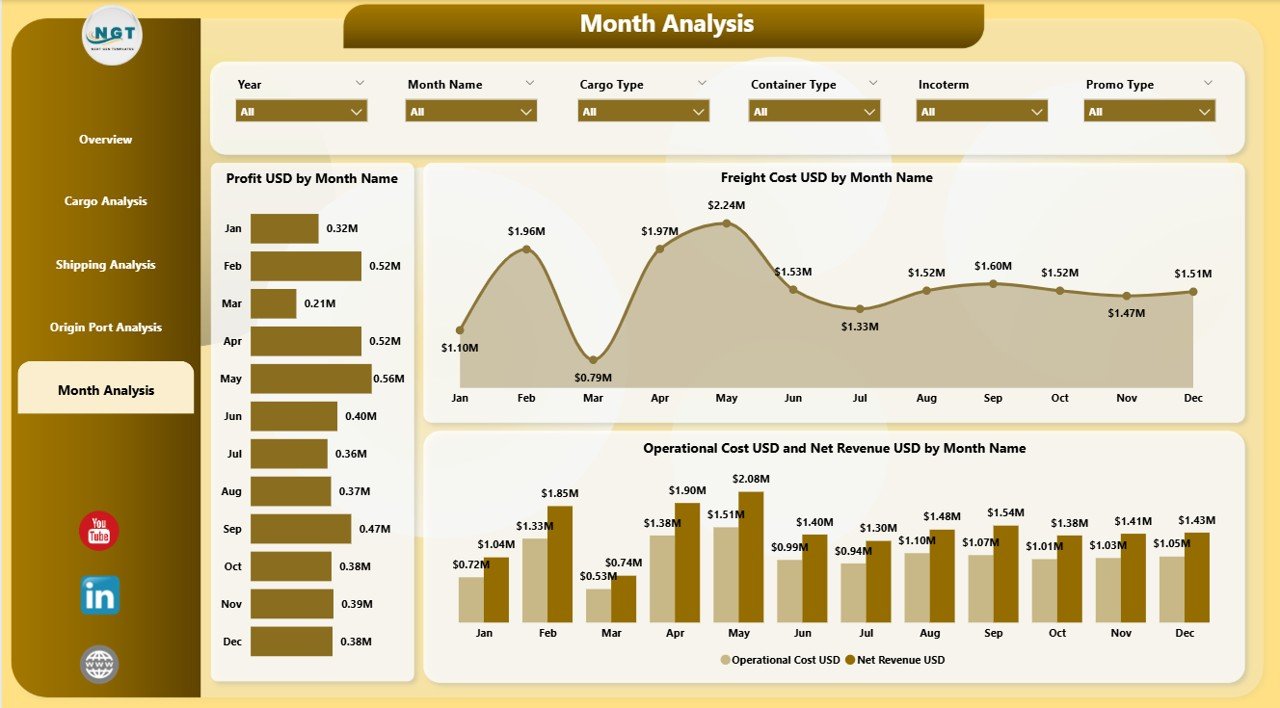
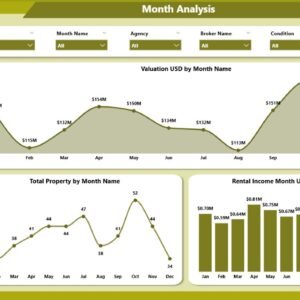
⭐ 5. Monthly Trends Page – Analyze Monthly Behavior
This page shows time-based trends including:
-
✔ Profit USD by Month
-
✔ Freight Cost USD by Month
-
✔ Operation Cost USD vs Net Revenue USD by Month
Monthly analysis reveals seasonal patterns, demand cycles, and strategic planning opportunities.
📦 What’s Inside the Shipping & Cargo Dashboard in Power BI
When you download this dashboard, you get:
-
A professionally designed 5-page Power BI dashboard
-
Full navigation through slicers
-
KPI cards for instant performance tracking
-
Interactive bar, column, and combo visuals
-
Real-time performance updates
-
A complete data model built inside Power BI
-
Clean layout, fully customizable visuals
-
Clear cost–revenue comparisons on every page
Just connect your data source, refresh, and the dashboard comes alive instantly.
🧩 How to Use the Shipping & Cargo Dashboard
Using this dashboard is simple:
-
📥 Import or connect your logistics dataset
-
🔄 Refresh the visuals
-
🎚 Use slicers to filter by port, customer type, cargo type, shipping line, or month
-
📊 Review profit, cost, and operational KPIs
-
🚦 Identify high-cost areas
-
📈 Compare trends over time
-
🤝 Improve pricing, routing, and planning decisions
Everything works without coding or technical skills.
👤 Who Can Benefit from This Shipping & Cargo Dashboard
This dashboard is ideal for:
-
🚢 Logistics Managers
-
🛳 Shipping Companies
-
📦 Freight Forwarders
-
📊 Supply Chain Analysts
-
⚓ Port Authorities
-
💼 Operations Heads
-
🧮 Finance & Costing Teams
Anyone responsible for monitoring logistics performance will find this dashboard extremely valuable.
### Click hare to read the Detailed blog post
Visit our YouTube channel to learn step-by-step video tutorials
👉 Youtube.com/@PKAnExcelExpert


Reviews
There are no reviews yet.