


The Sales Funnel KPI Dashboard in Excel is an essential tool for sales managers, business owners, and marketing teams looking to track, analyze, and optimize their sales funnel performance. This comprehensive Excel dashboard allows you to monitor key performance indicators (KPIs) related to each stage of your sales funnel—from lead generation to conversions—giving you a clear overview of your sales pipeline and helping you identify areas for improvement.
With real-time data tracking, this dashboard enables you to visualize your sales funnel, monitor conversion rates, analyze lead quality, and track the effectiveness of your sales and marketing strategies. It’s the perfect tool for anyone looking to streamline the sales process, improve lead conversion, and boost revenue generation.
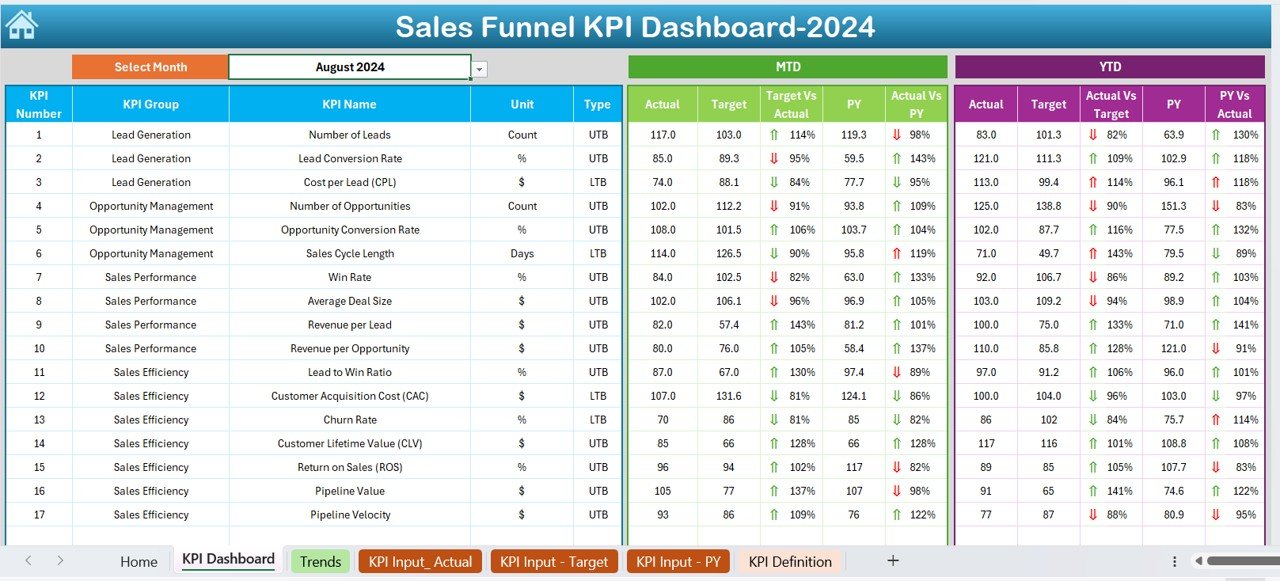
Key Features of the Sales Funnel KPI Dashboard in Excel
📊 Comprehensive Sales Funnel Monitoring
Track key KPIs such as lead generation, lead qualification, opportunity stages, and closed deals. Monitor the entire sales funnel to optimize conversions at each stage.
⚡ Real-Time Conversion Rate Tracking
Monitor your conversion rates at each stage of the funnel. Identify bottlenecks and areas for improvement in your sales process to increase lead conversion and sales performance.
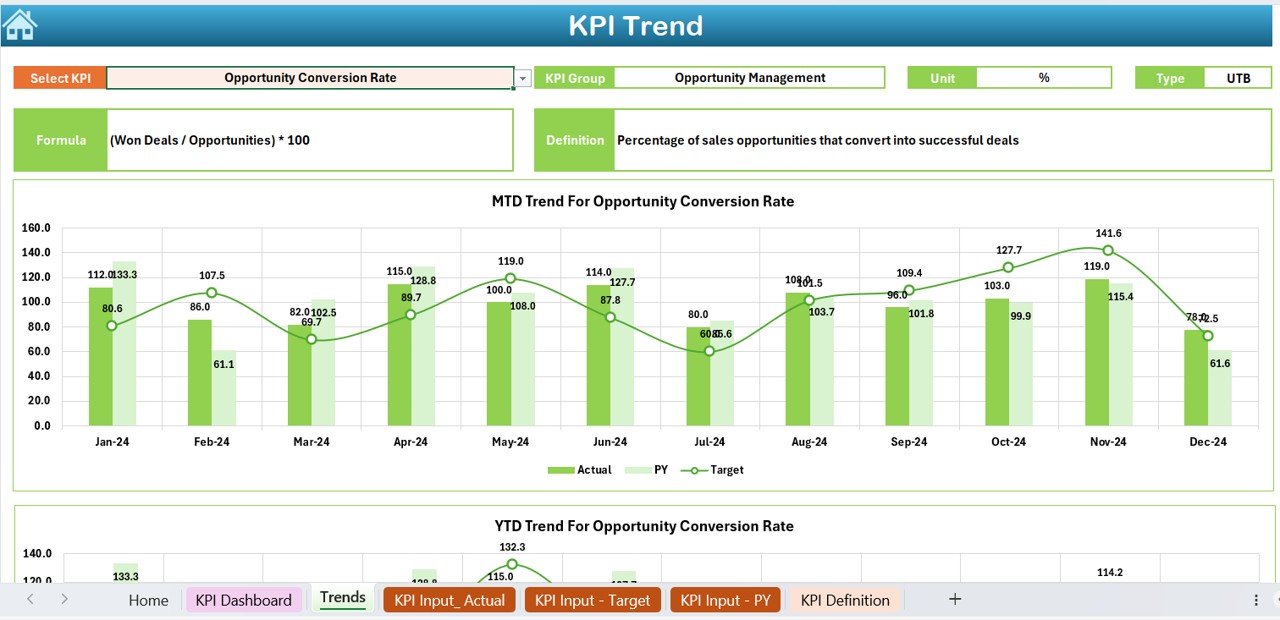
📈 Lead Quality & Opportunity Analysis
Evaluate the quality of leads and opportunities moving through your sales funnel. Measure lead conversion efficiency and assess which channels or tactics are most effective.
📅 Customizable KPIs for Sales Funnel Analysis
Adjust the dashboard to track KPIs specific to your business needs, whether it’s focusing on lead volume, win rates, average deal size, or sales cycle time.
🖥️ Interactive & User-Friendly Interface
The Excel dashboard is designed to be simple to use, with interactive charts, filters, and slicers to explore your data and visualize performance across the sales pipeline.
Why You’ll Love the Sales Funnel KPI Dashboard in Excel

✅ Track the Entire Sales Funnel
Monitor every stage of your sales funnel—from initial lead generation to closed deals. Ensure that you’re optimizing every step of the sales process for maximum efficiency.
✅ Optimize Lead Conversion
Use conversion tracking to identify bottlenecks in your sales funnel and take corrective actions to improve the conversion rate at each stage.
✅ Improve Lead Quality
Assess lead quality and ensure that your sales team is focusing on the most valuable opportunities to improve conversion rates and sales performance.
✅ Enhance Sales Strategy
Leverage insights from the dashboard to adjust your sales and marketing strategies, optimize sales processes, and allocate resources where they’re needed most.
✅ Make Data-Driven Decisions
Utilize the dashboard’s real-time insights to make informed decisions about lead generation tactics, sales process optimizations, and sales cycle improvements.
What’s Inside the Sales Funnel KPI Dashboard Template?
- Lead Generation & Qualification Tracking: Monitor lead generation, lead qualification, and lead-to-opportunity conversion rates.
- Sales Opportunity Tracking: Track sales opportunities, including deal size, win rates, and opportunity stages.
- Conversion Rate Analysis: Visualize conversion rates at every stage of the funnel and identify areas for improvement.
- Customizable KPIs: Adjust the dashboard to fit your specific sales process and goals.
- Interactive Reporting: Use filters and visual charts to gain deeper insights into sales funnel performance and decision-making.
How to Use the Sales Funnel KPI Dashboard in Excel
1️⃣ Download the Template: Access your Sales Funnel KPI Dashboard instantly.
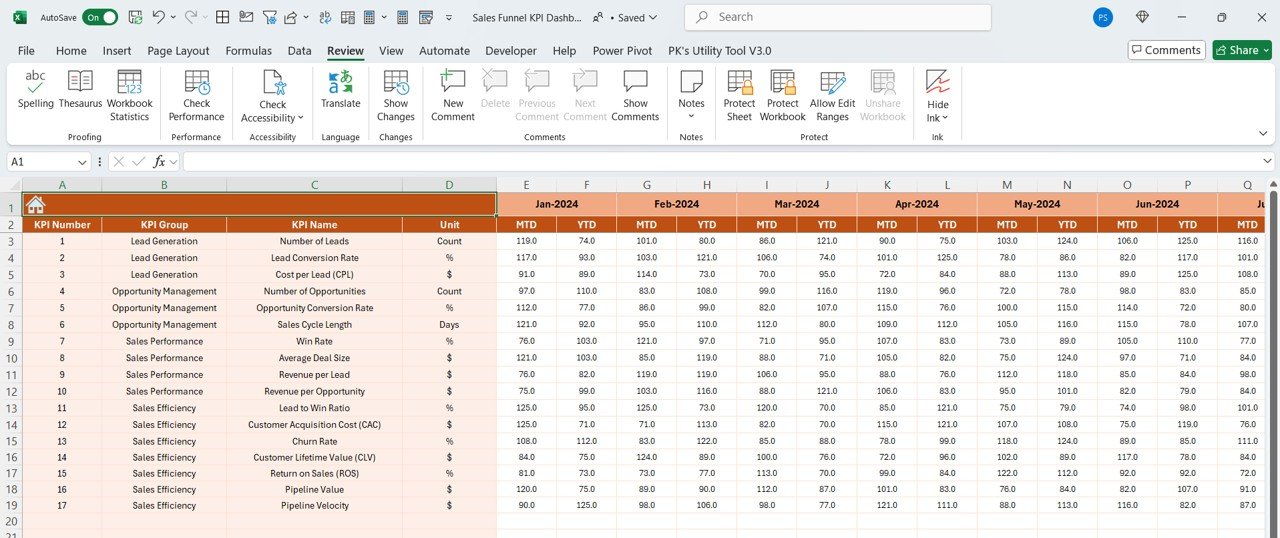
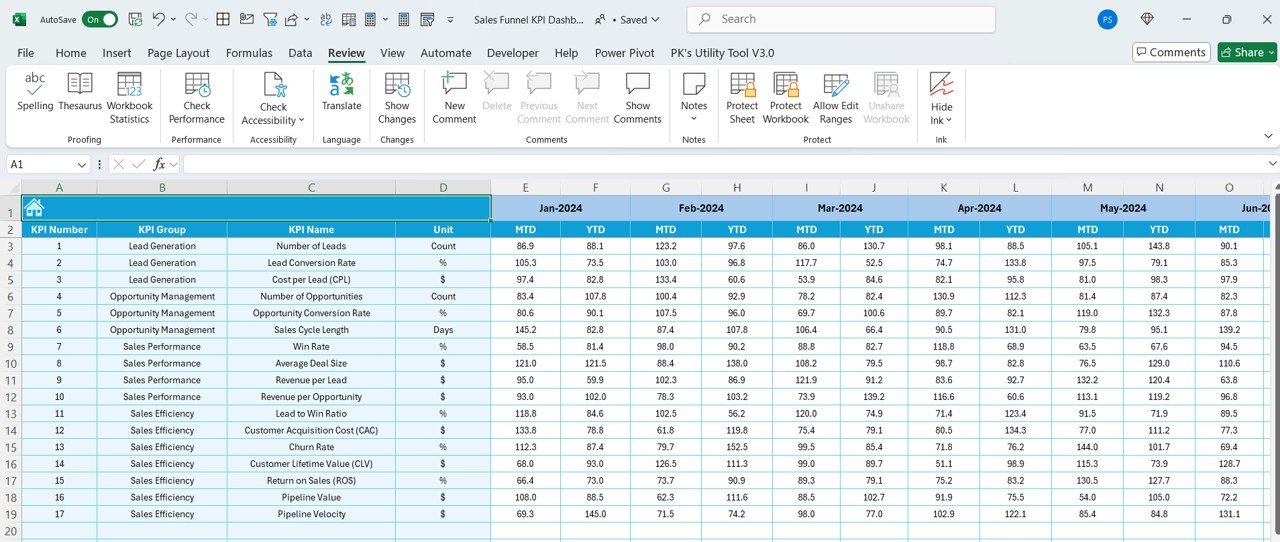
2️⃣ Enter Sales Data: Input data such as lead generation, conversion rates, deal size, and sales cycle times.
3️⃣ Monitor & Track KPIs: Use the dashboard to track the performance of your sales funnel in real-time.
4️⃣ Analyze & Optimize: Use insights from the dashboard to optimize lead conversion, improve sales processes, and drive revenue growth.
Who Can Benefit from the Sales Funnel KPI Dashboard in Excel?
🔹 Sales Managers & Business Owners
🔹 Marketing Teams & Lead Generation Specialists
🔹 Sales Representatives & Account Executives
🔹 Marketing Analysts & Data Professionals
🔹 Anyone Involved in Sales & Marketing Optimization
Track, analyze, and optimize your sales funnel with the Sales Funnel KPI Dashboard in Excel. Monitor KPIs, improve conversion rates, and boost revenue generation to take your sales performance to the next level.
Click here to read the Detailed blog post
Visit our YouTube channel to learn step-by-step video tutorials
Youtube.com/@PKAnExcelExpert


Reviews
There are no reviews yet.