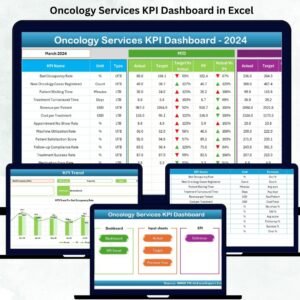
The Sales and Marketing Service Delivery KPI Dashboard in Excel is a robust and comprehensive tool designed to help businesses monitor and analyze the performance of their sales and marketing activities. This Excel-based dashboard enables you to track essential KPIs related to service delivery, customer satisfaction, campaign effectiveness, and sales performance.
Whether you’re running a small sales team or managing a large marketing operation, this dashboard provides real-time insights into your team’s performance and the effectiveness of your strategies. By tracking key service delivery metrics and campaign results, you can make data-driven decisions that improve productivity, customer retention, and overall service delivery.
Key Features of the Sales and Marketing Service Delivery KPI Dashboard in Excel
📊 Sales Performance Monitoring
Track key sales metrics such as revenue, conversion rates, and lead generation. Monitor sales trends over time to identify strengths, weaknesses, and opportunities for improvement.
📈 Marketing Campaign Effectiveness
Measure the effectiveness of your marketing campaigns by tracking performance metrics like return on investment (ROI), customer engagement, and lead generation.
🚚 Service Delivery Tracking
Monitor service delivery KPIs, such as delivery time, service quality, and customer satisfaction. Ensure that customer expectations are met and identify any service bottlenecks.
🔑 Customer Satisfaction Insights
Track customer feedback, Net Promoter Score (NPS), and satisfaction ratings to assess the quality-of-service delivery and make necessary adjustments to improve customer experiences.
📅 Time-Based Analysis
Analyze key metrics over various time periods, such as daily, weekly, or monthly, to track trends and performance variations across campaigns and sales cycles.
⚙️ Customizable KPIs
Tailor the dashboard to track the KPIs that are most relevant to your business. Add custom metrics related to customer service, campaign performance, or product delivery as needed.
Why You’ll Love the Sales and Marketing Service Delivery KPI Dashboard in Excel

✅ Track Sales & Marketing Performance in One Place
Easily monitor both sales and marketing KPIs in a single, unified dashboard. Get a comprehensive view of how well your teams are performing and how your campaigns are contributing to overall success.
✅ Improve Service Delivery Efficiency
Monitor key service delivery metrics to ensure that customer expectations are met, and identify any areas for improvement. Use the insights to optimize operational efficiency and customer satisfaction.
✅ Data-Driven Decisions for Sales & Marketing
Make informed decisions based on real-time data. Track the performance of marketing campaigns, identify top-performing sales reps, and ensure high levels of customer satisfaction.
✅ Enhance Customer Retention
Use customer satisfaction insights to refine your service delivery and marketing strategies. Improving customer experiences and engagement leads to increased retention and loyalty.
✅ Customizable & Scalable
The dashboard is highly customizable to suit your specific sales and marketing needs. Whether you’re a small team or a large enterprise, this tool is scalable to meet your requirements.
What’s Inside the Sales and Marketing Service Delivery KPI Dashboard in Excel?
-
Sales Performance Monitoring: Track revenue, conversion rates, and sales performance.
-
Marketing Campaign Effectiveness: Measure ROI, customer engagement, and campaign performance.
-
Service Delivery Tracking: Monitor delivery time, service quality, and customer satisfaction.
-
Customer Satisfaction Insights: Track NPS and customer feedback for improved service delivery.
-
Time-Based Performance Analysis: Track performance over daily, weekly, and monthly periods.
-
Customizable KPIs: Add custom KPIs relevant to your business goals and operations.
How to Use the Sales and Marketing Service Delivery KPI Dashboard in Excel
1️⃣ Download the Template: Instantly access the Sales and Marketing Service Delivery KPI Dashboard in Excel.
2️⃣ Input Your Sales & Marketing Data: Enter your sales performance, marketing campaign data, and service delivery metrics into the dashboard.
3️⃣ Monitor Key KPIs: Track key metrics such as revenue, conversion rates, ROI, and customer satisfaction.
4️⃣ Analyze Trends & Data: Use time-based analysis to identify performance trends and areas for improvement.
5️⃣ Optimize Sales & Marketing Strategies: Use the insights to refine your sales processes, marketing campaigns, and service delivery to improve overall performance.
Who Can Benefit from the Sales and Marketing Service Delivery KPI Dashboard in Excel?
🔹 Sales & Marketing Teams
🔹 Customer Service & Support Teams
🔹 Business Owners & Executives
🔹 Marketing Campaign Managers
🔹 Operations & Service Delivery Managers
🔹 Data Analysts & Performance Managers
🔹 Small & Medium Businesses (SMBs)
🔹 Large Enterprises with Complex Sales & Marketing Operations
Track and optimize your sales, marketing, and service delivery processes with the Sales and Marketing Service Delivery KPI Dashboard in Excel. Monitor key performance metrics, improve efficiency, and make data-driven decisions to enhance customer satisfaction and business growth.
Click here to read the Detailed blog post
Visit our YouTube channel to learn step-by-step video tutorials
Youtube.com/@PKAnExcelExpert














Reviews
There are no reviews yet.