The Retail Foot Traffic KPI Dashboard in Excel is an essential tool for retail managers and business owners who want to track and optimize foot traffic in their stores. This customizable dashboard allows you to monitor key performance indicators (KPIs) such as foot traffic volume, peak hours, conversion rates, customer demographics, and more. With real-time data tracking, this Excel-based tool helps you analyze and understand customer behaviors, improve store performance, and optimize marketing strategies.
By using this Retail Foot Traffic KPI Dashboard in Excel, you can easily track how many customers visit your store, identify busy periods, measure conversion rates, and make data-driven decisions to increase sales and enhance the customer shopping experience. Whether you operate a small boutique or manage a chain of stores, this dashboard provides valuable insights into how foot traffic impacts your retail business.
Key Features of the Retail Foot Traffic KPI Dashboard in Excel
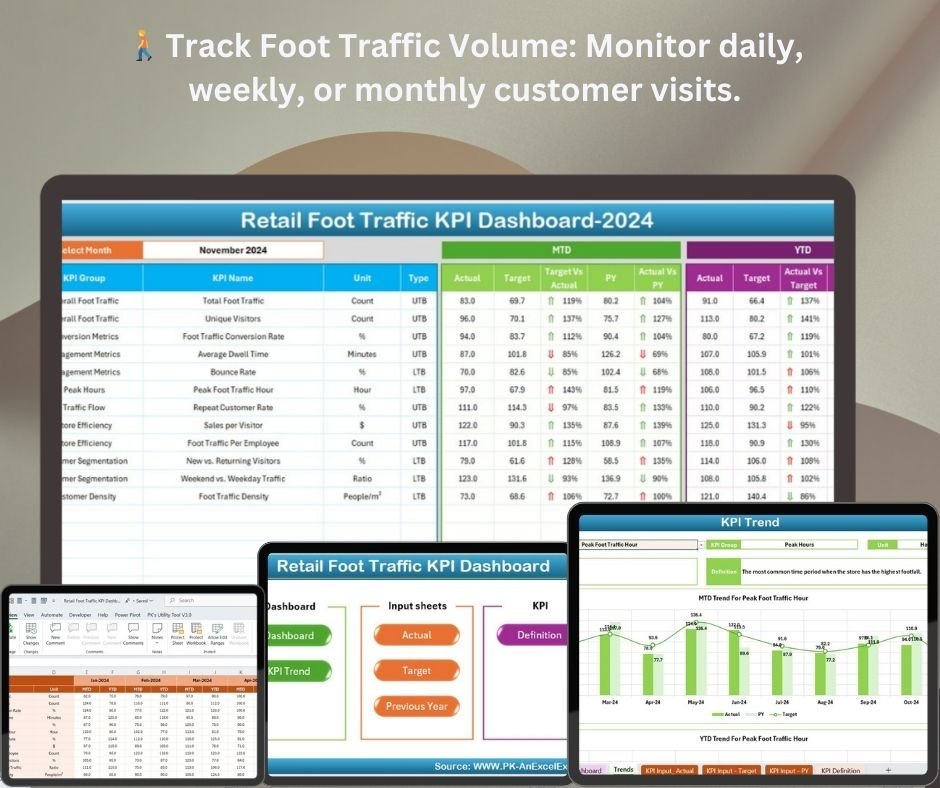
🚶 Foot Traffic Volume Tracking
Monitor the total number of customers visiting your store daily, weekly, or monthly. Track and compare foot traffic trends over time to assess marketing campaigns and promotional activities.
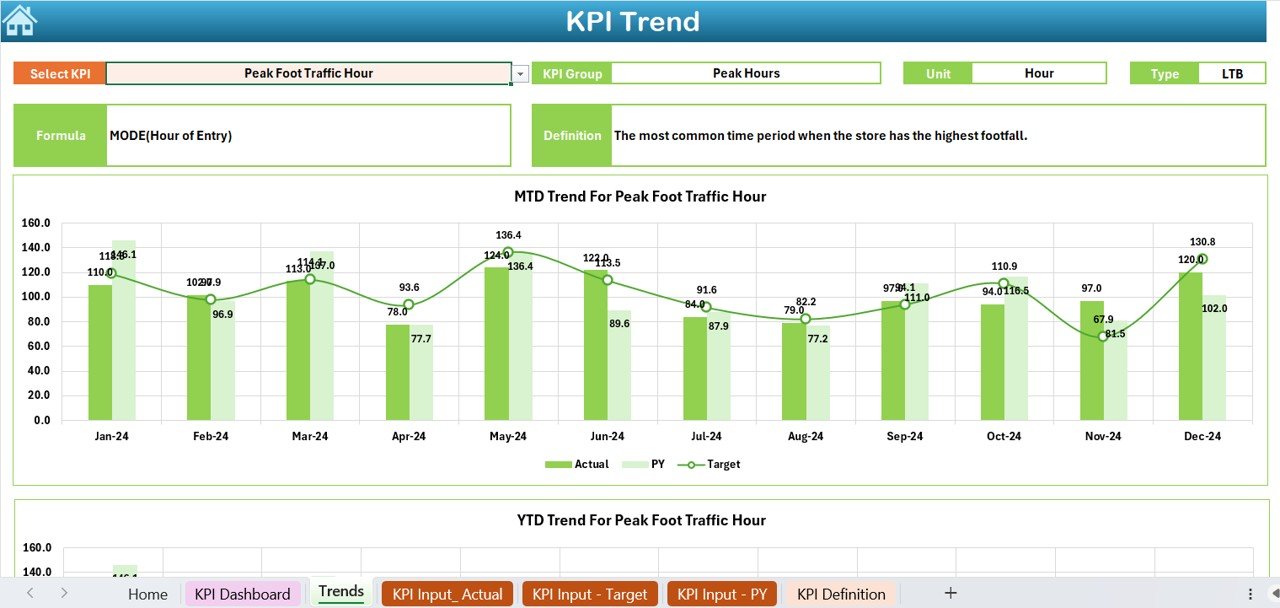
⚡ Peak Hour Analysis
Analyze peak foot traffic hours to understand when your store is busiest. Adjust staffing schedules and marketing strategies to align with high-traffic periods, ensuring optimal resource utilization.
📈 Conversion Rate Monitoring
Track the conversion rate (the percentage of foot traffic that makes a purchase). This key metric helps you assess store performance and identify opportunities to improve sales conversion strategies.
📅 Customer Demographics
Monitor customer demographics such as age, gender, and other attributes to tailor marketing and sales strategies to your target audience. Understand which demographics visit your store the most and optimize your marketing accordingly.
🖥️ Interactive & User-Friendly Interface
The dashboard is simple to use and provides interactive charts, filters, and slicers, allowing you to explore foot traffic data in detail and gain actionable insights to optimize store performance.
Why You’ll Love the Retail Foot Traffic KPI Dashboard in Excel
✅ Track Foot Traffic Volume & Trends
Monitor customer visits to your store over time. Identify trends and spikes in foot traffic to assess the impact of marketing campaigns or events.
✅ Optimize Store Operations
Use peak hour analysis to adjust staffing, optimize store layout, and improve customer service during busy periods. Make data-driven decisions that improve customer experience.
✅ Boost Conversion Rates
Analyze conversion rates and identify areas where foot traffic is high, but sales are low. Adjust your in-store marketing or sales tactics to convert more visitors into paying customers.
✅ Tailor Marketing Strategies
Use customer demographics data to better understand your target audience and tailor your marketing and promotional strategies for maximum impact.
✅ Make Data-Driven Decisions
Leverage insights from the dashboard to improve operational efficiency, optimize marketing strategies, and increase overall sales performance.
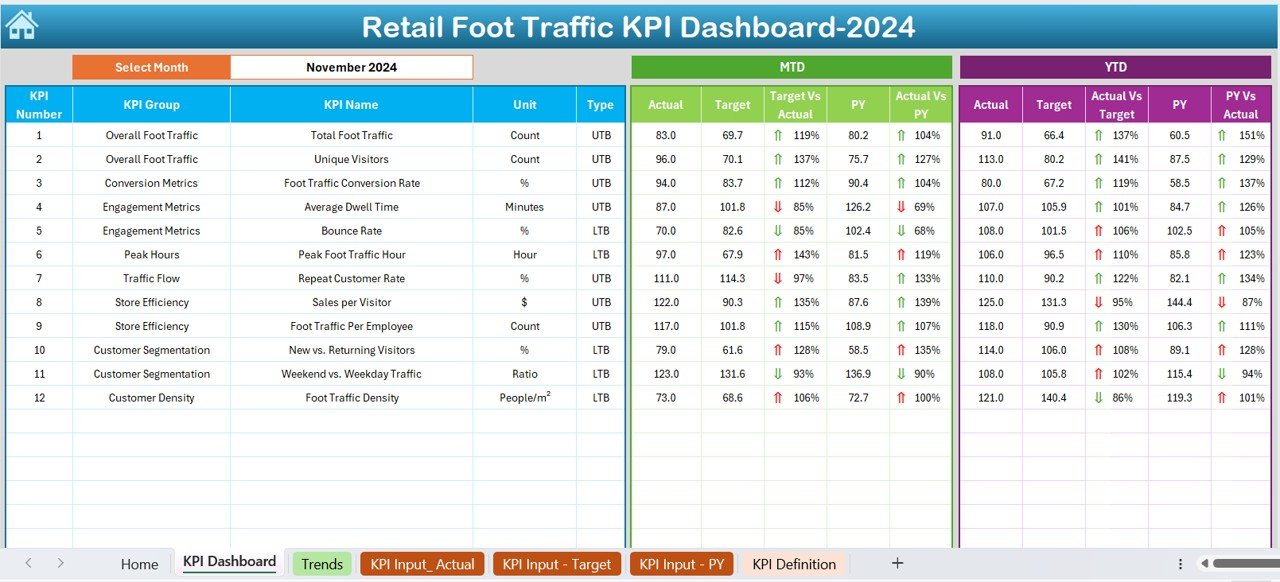
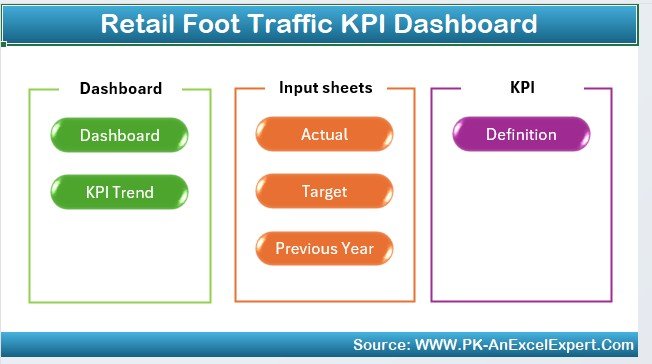
What’s Inside the Retail Foot Traffic KPI Dashboard Template?
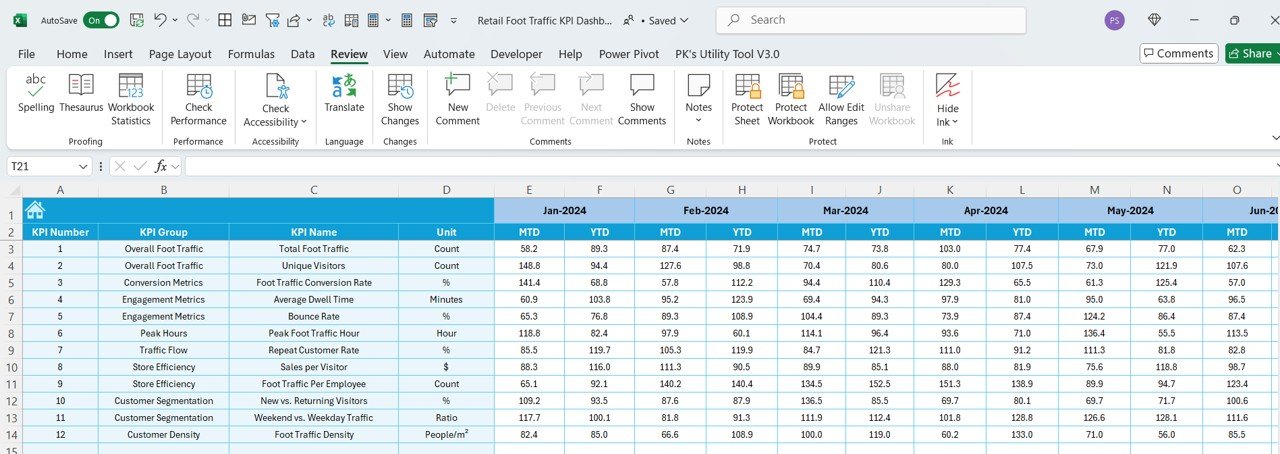
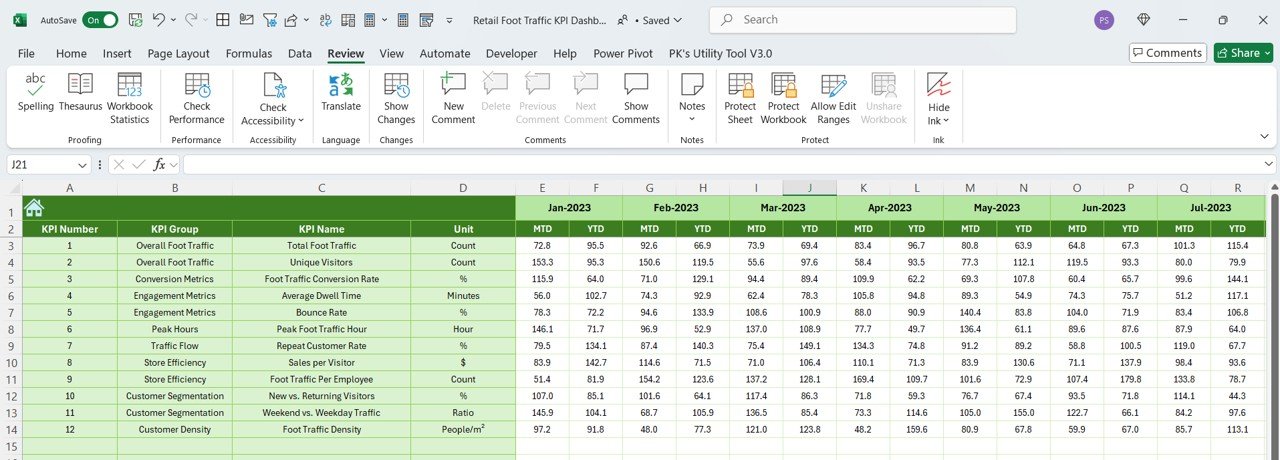
- Foot Traffic Volume Tracking: Track the number of customers visiting your store daily, weekly, or monthly.
- Peak Hours Analysis: Identify busy hours and adjust staffing schedules accordingly.
- Conversion Rate Monitoring: Measure the conversion of foot traffic into actual sales.
- Customer Demographics: Track customer age, gender, and other data to better understand your customer base.
- Real-Time Data Insights: Access real-time updates on foot traffic data and KPIs.
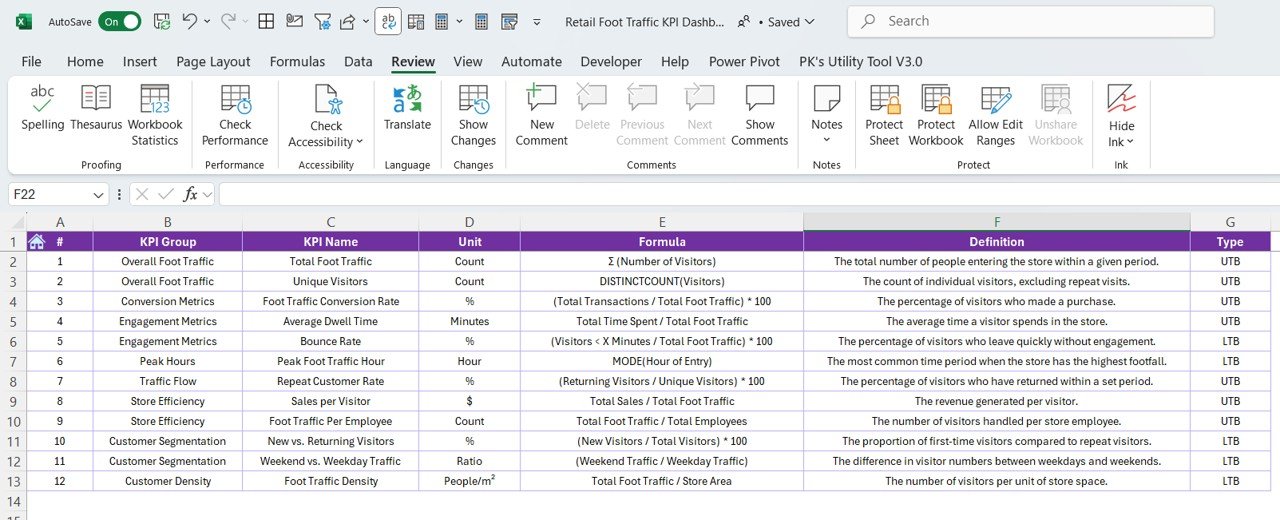
- Customizable KPIs: Adjust the dashboard to track specific foot traffic metrics that matter most to your business.
How to Use the Retail Foot Traffic KPI Dashboard in Excel
1️⃣ Download the Template: Instantly access your Retail Foot Traffic KPI Dashboard in Excel.
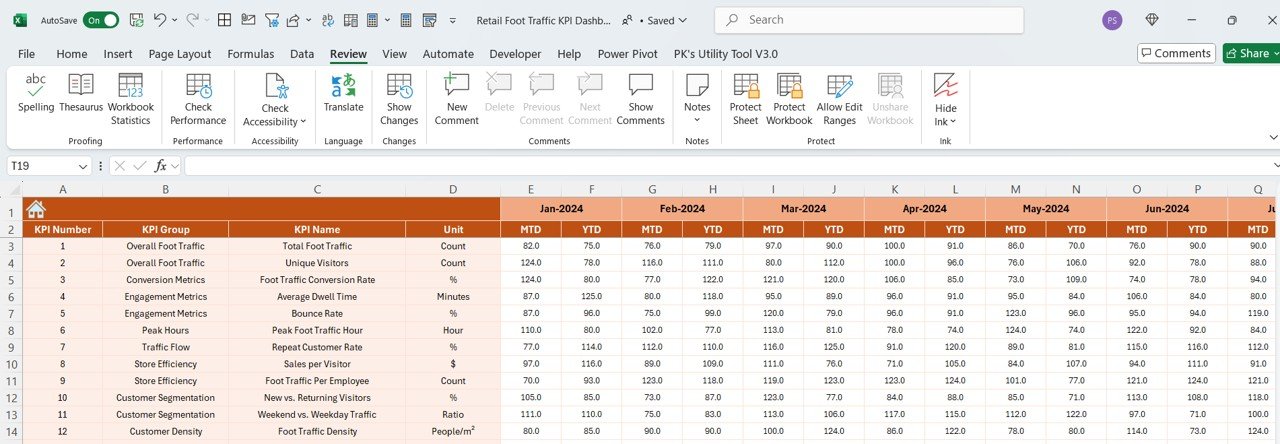
2️⃣ Input Foot Traffic Data: Enter your store’s foot traffic, sales, and customer demographic data.
3️⃣ Track & Monitor KPIs: Use the dashboard to monitor key metrics such as foot traffic, peak hours, and conversion rates.
4️⃣ Analyze & Optimize: Leverage insights from the dashboard to optimize marketing strategies, improve customer experience, and boost sales.
Who Can Benefit from the Retail Foot Traffic KPI Dashboard in Excel?
🔹 Retail Store Managers & Owners
🔹 Marketing & Sales Teams
🔹 Business Analysts in Retail
🔹 Operations Managers in Retail
🔹 Anyone Looking to Optimize Retail Performance & Increase Sales
Track, analyze, and optimize your retail store’s foot traffic with the Retail Foot Traffic KPI Dashboard in Excel. Gain insights into customer behavior, improve conversion rates, and enhance your store’s performance.
Click here to read the Detailed blog post
Visit our YouTube channel to learn step-by-step video tutorials
Youtube.com/@PKAnExcelExpert


Reviews
There are no reviews yet.