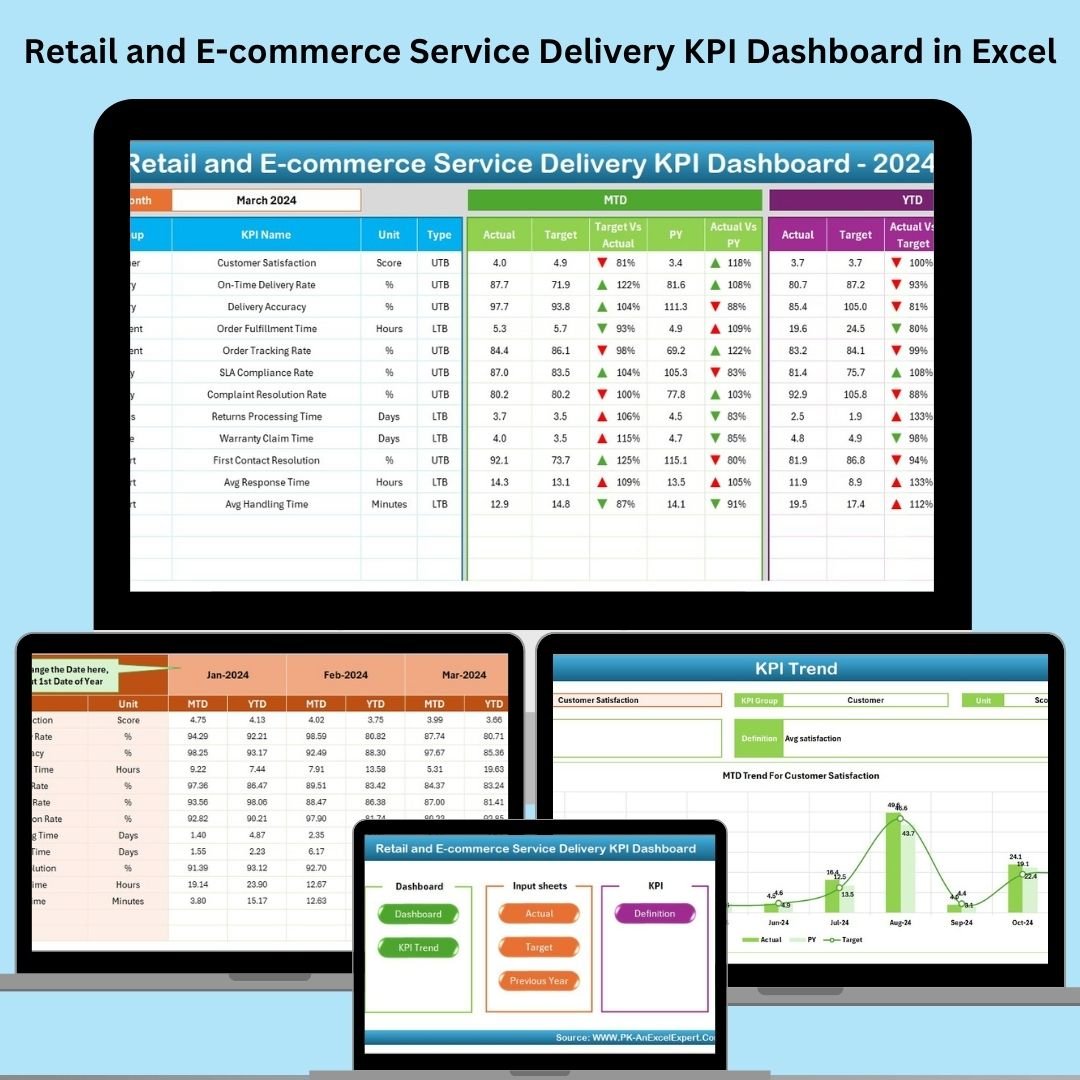
In today’s dynamic retail and e-commerce environment, delivering superior service consistently is key to customer satisfaction and business growth. The Retail and E-commerce Service Delivery KPI Dashboard in Excel is a powerful, ready-to-use tool designed to help you track performance metrics, monitor trends, and improve operational efficiency—all in one place.
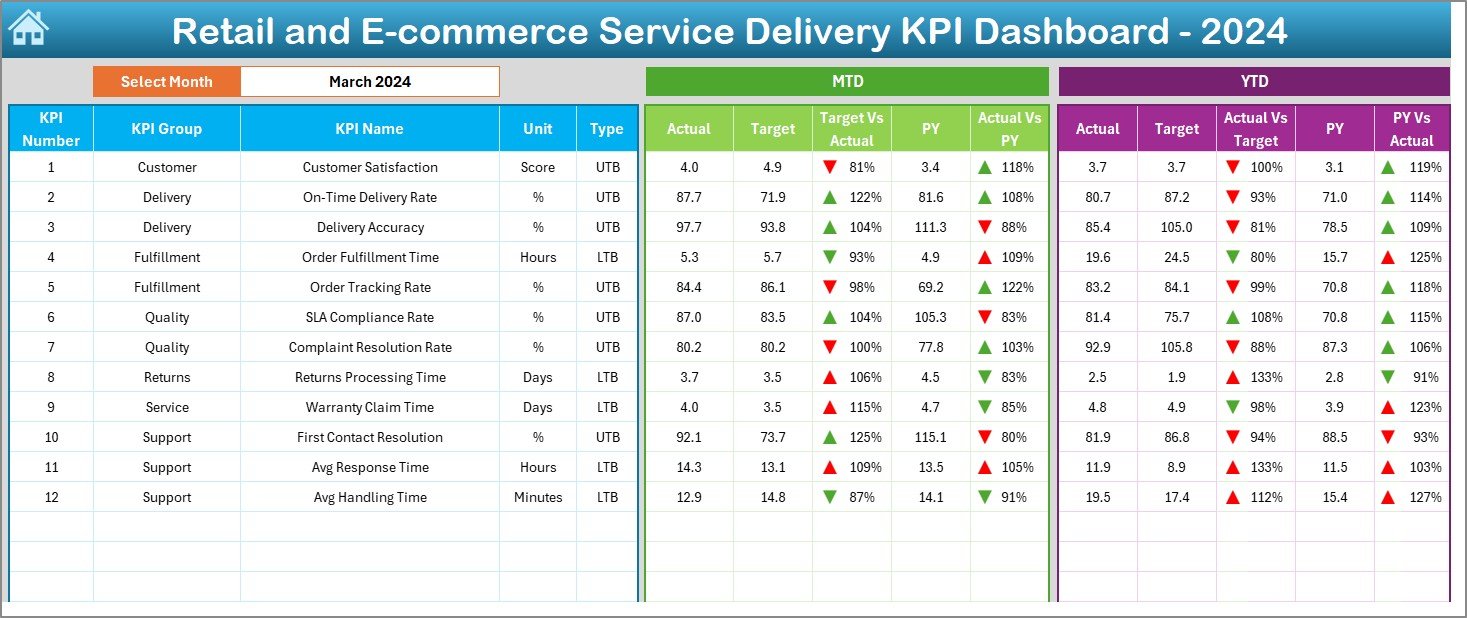
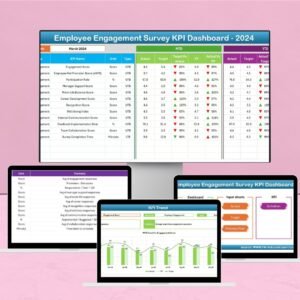
This interactive Excel dashboard helps you visualize MTD and YTD KPIs, compare actual vs target vs previous year performance, and dive deep into trends for each service delivery metric. From delivery times to complaint rates, the dashboard provides real-time visibility into your operations, enabling data-driven decision-making.
🔍 Key Features
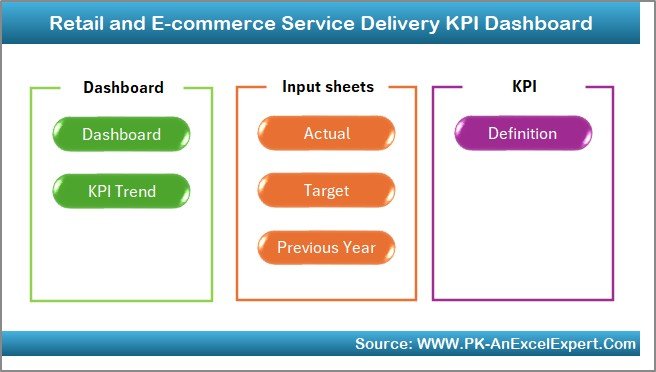
📁 7 Structured Worksheets:
-
Home Sheet: Centralized index with 6 buttons for easy navigation.
-
Dashboard: Select the month (cell D3) to view MTD & YTD Actuals, Targets, and Previous Year data.
-
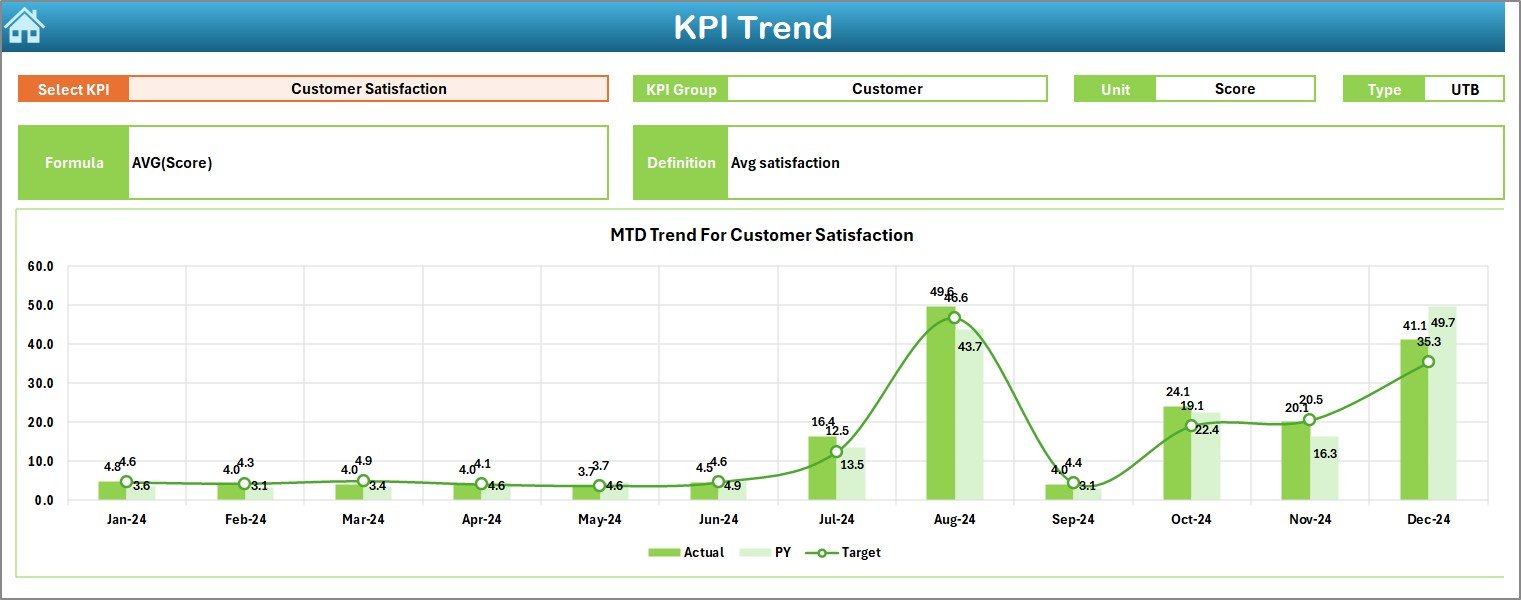
KPI Trend: Visual line charts and detailed metric logic for any selected KPI.
-
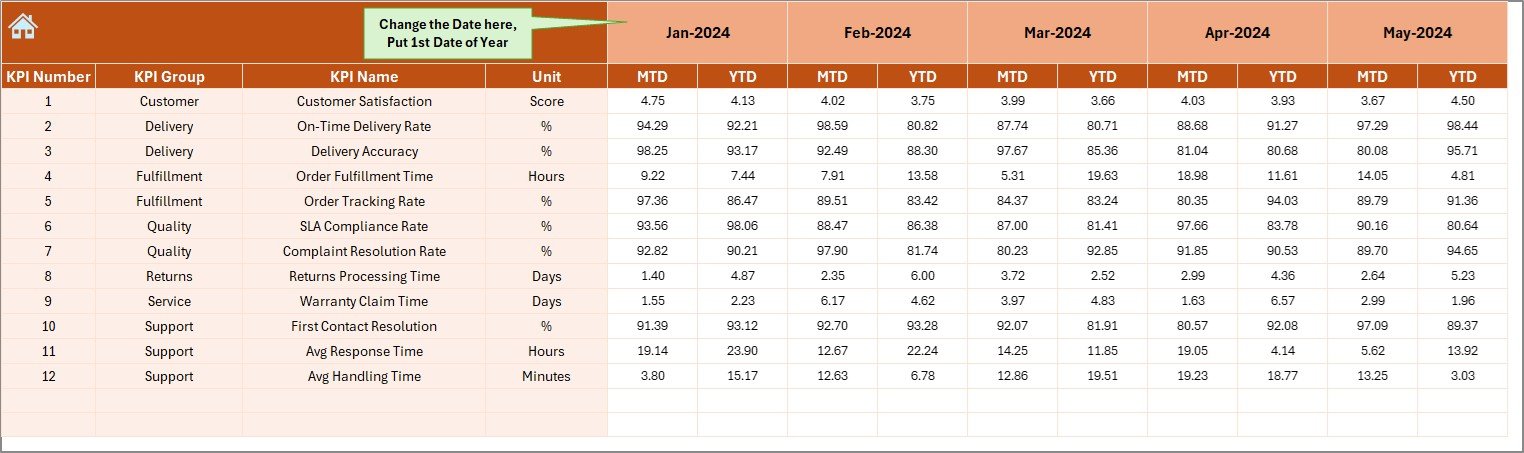
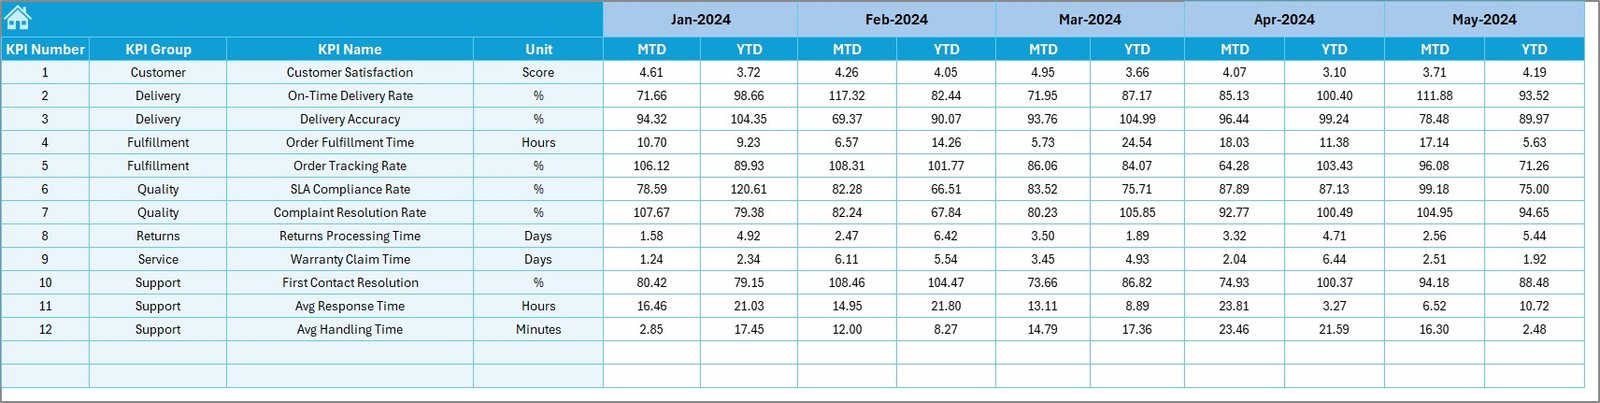
Actual Numbers Input: Monthly and cumulative actual performance inputs.
-
Target Sheet: Set monthly goals (MTD and YTD) for each KPI.
-
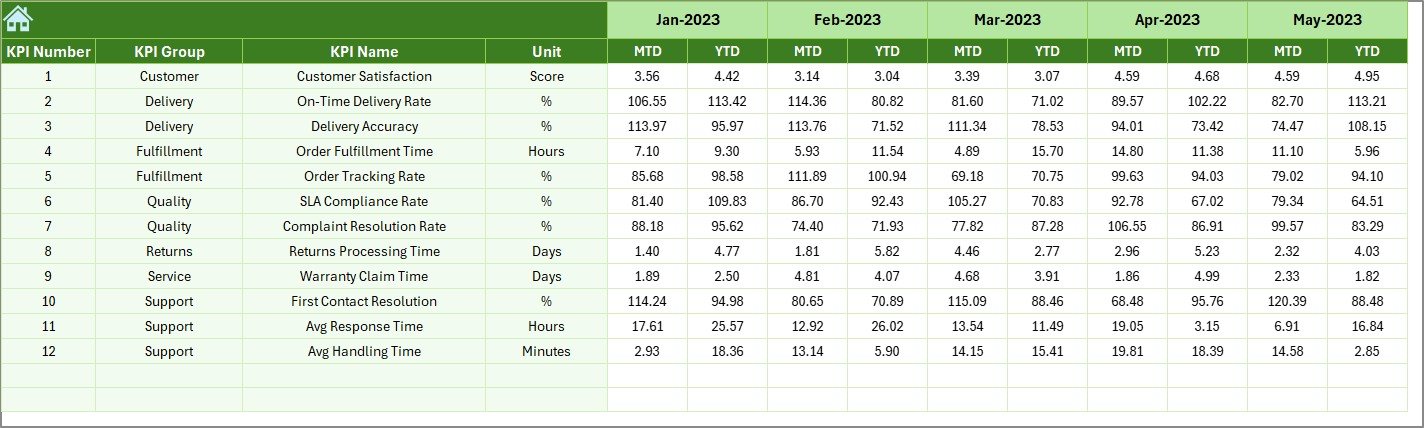
Previous Year Numbers: Record past performance for trend analysis.
-
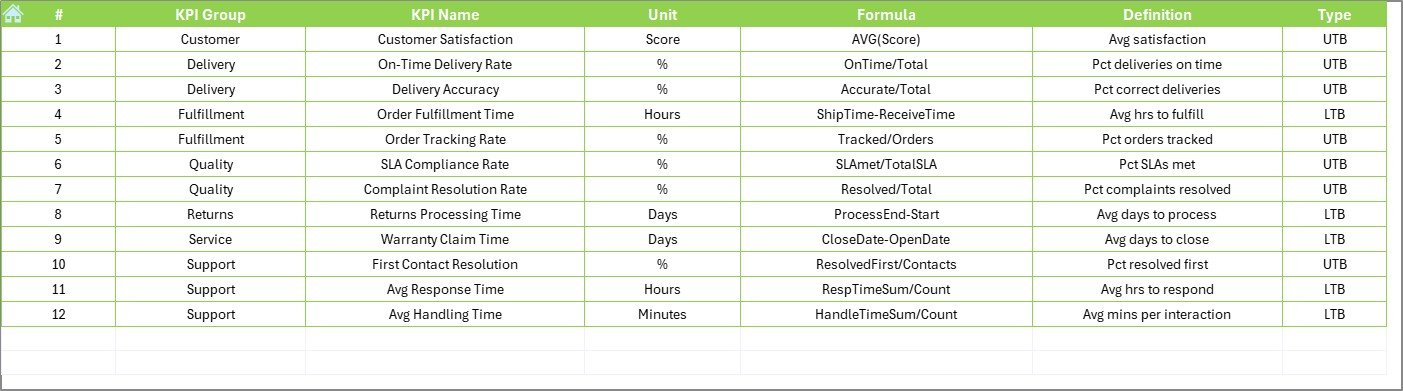
KPI Definition Sheet: Manage KPI metadata like name, unit, type (LTB/UTB), formula, and definition.
📊 Dynamic Visualizations:
-
Track key indicators like On-Time Delivery Rate, Order Accuracy, Complaint Resolution Time, and Return Processing.
-
Get instant visual cues with up/down arrows using conditional formatting.
-
Line charts for trend insights.
📈 Fully Interactive Dashboard:
-
Choose a KPI from a dropdown to view detailed definitions and line charts.
-
Select any month to auto-update dashboard visuals.
-
Analyze performance across MTD, YTD, and PY simultaneously.
🛠️ No Coding Required:
-
Built entirely in Excel with formulas and validation—no VBA necessary.
-
Optional VBA macros can enhance automation (e.g., refresh data, import files).
💡 Benefits of Using This Dashboard
✅ Enhanced Visibility: Consolidate all KPIs in one file—no more multiple spreadsheets.
✅ Faster Decision-Making: Identify performance gaps and take action quickly.
✅ Improved Accountability: Assign ownership to departments and track follow-through.
✅ Cost-Efficient: No need for expensive software—manage everything in Excel.
✅ Customizable: Easily add/remove KPIs or adjust visuals based on your business.
✅ Scalable: Extend the timeline, add data, and scale as your business grows.
📌 How to Use
-
Define KPIs in the KPI Definition Sheet (include KPI name, formula, unit, type).
-
Enter Actuals in the Actual Numbers Input Sheet.
-
Set Monthly Targets in the Target Sheet.
-
Input PY Benchmarks in the Previous Year Numbers Sheet.
-
Use the Dashboard Sheet to view summaries, compare metrics, and spot trends.
-
Use KPI Trend for deep-dive insights on individual metrics.
👥 Who Should Use This?
-
E-commerce Managers
-
Retail Operations Teams
-
Business Analysts
-
Logistics Coordinators
-
Performance Management Leads
Perfect for companies seeking efficiency, performance transparency, and better customer service outcomes.
🎯 Use Cases
-
Monitor monthly delivery times, return handling, and order accuracy
-
Track customer complaints and resolution timelines
-
Compare year-over-year performance
-
Identify service bottlenecks before they escalate
📽️ Learn More: Visit our YouTube channel for tutorials
🔗 Click here to read the Detailed blog post


Reviews
There are no reviews yet.