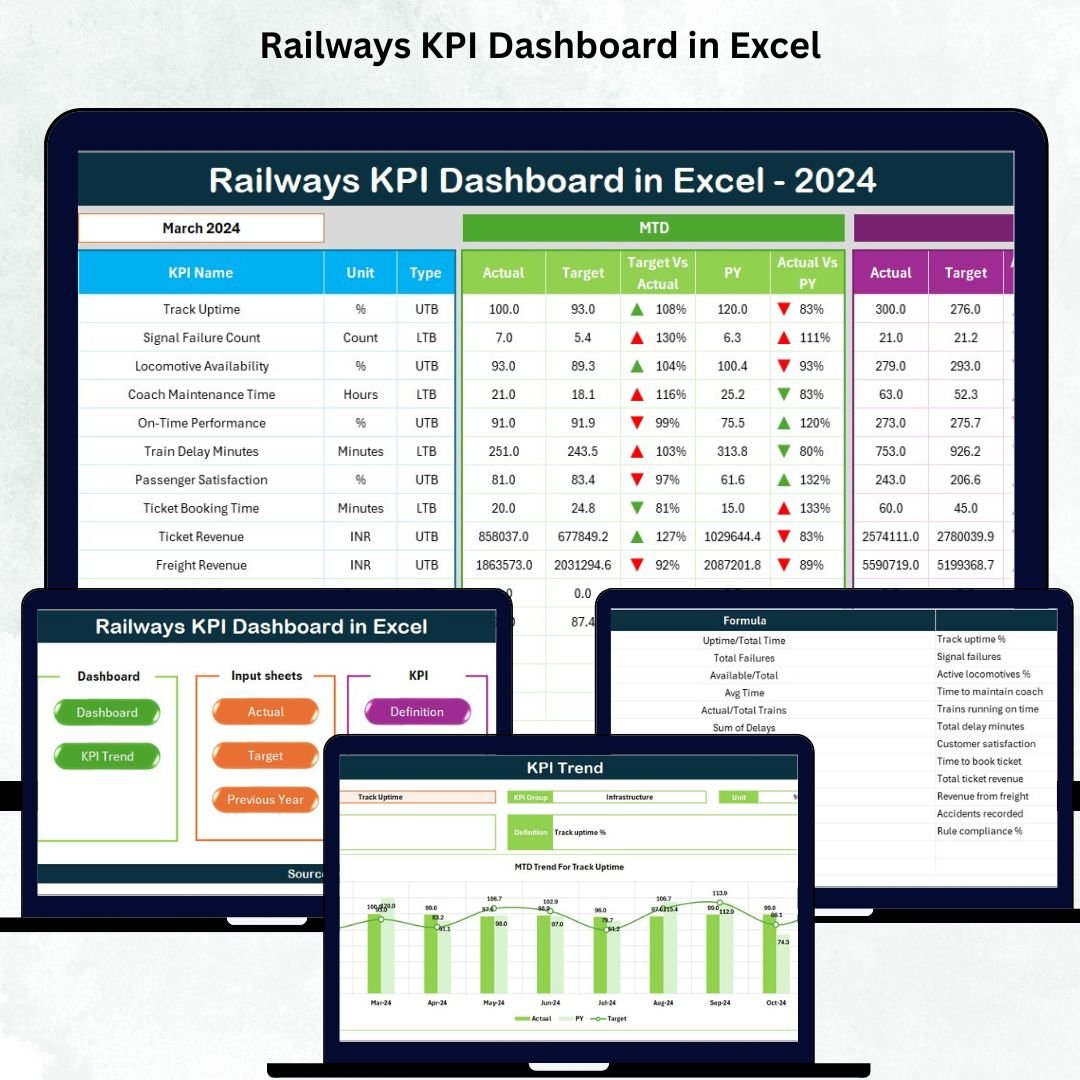

Managing railway operations is a massive responsibility. Trains run across long routes, stations handle thousands of passengers, and teams must ensure safety, punctuality, and smooth performance every single day. With so many moving parts, railway managers need a simple and reliable way to track performance. That’s exactly where the Railways KPI Dashboard in Excel becomes your ultimate reporting solution.
This ready-to-use Excel dashboard brings clarity, speed, and accuracy into railway performance tracking. Whether you manage operations, safety, customer satisfaction, or infrastructure, this tool helps you monitor your KPIs instantly and take action at the right time. With clean visuals, dynamic calculations, and automated insights, this dashboard transforms the way railway teams understand their performance.
⚙️ Key Features of Railways KPI Dashboard in Excel
The Railways KPI Dashboard is packed with powerful features designed for real-world railway management needs:
🚆 Real-Time Performance Updates
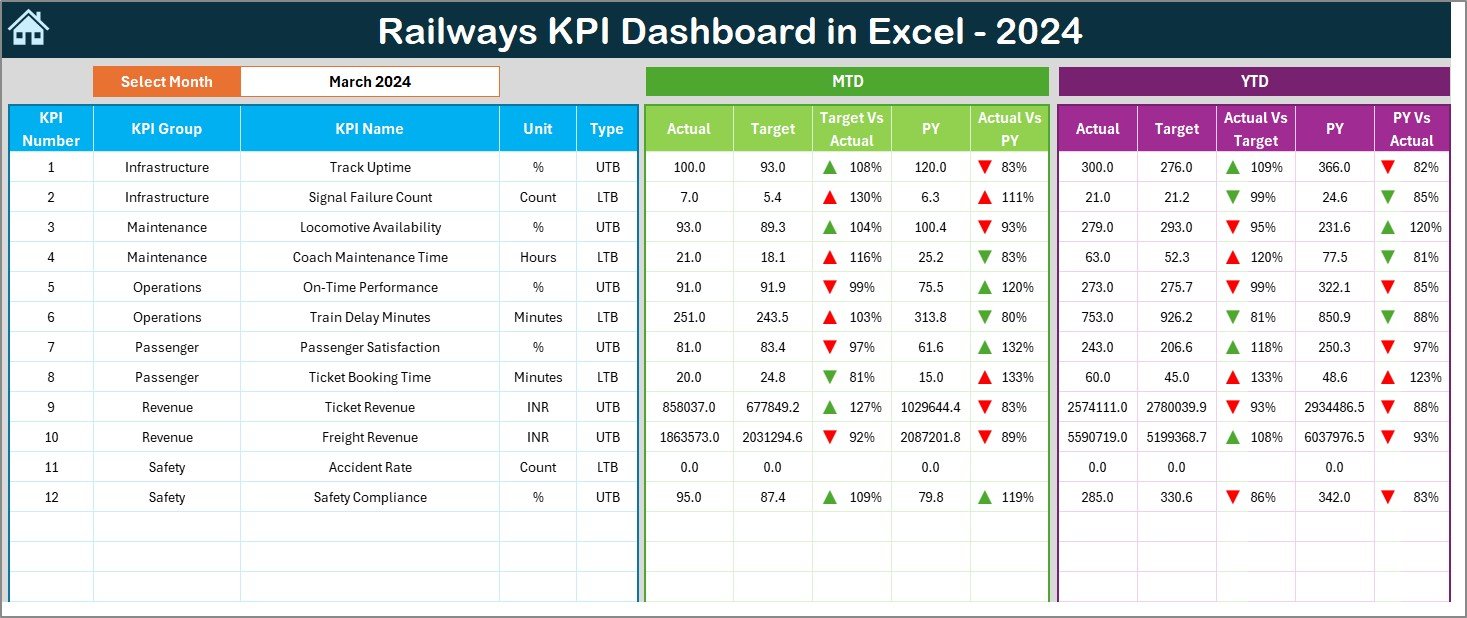
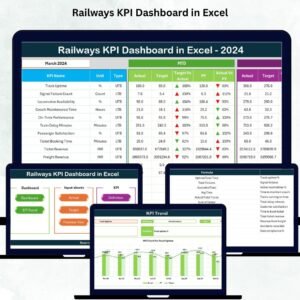
Change the month using the slicer, and the entire dashboard instantly refreshes.
🎯 MTD & YTD KPI Insights
Track Actual, Target, and Previous Year values for each KPI, helping you compare performance in seconds.
📊 Interactive Visuals
Up/down arrows, conditional formatting, and trend indicators make performance easy to understand.
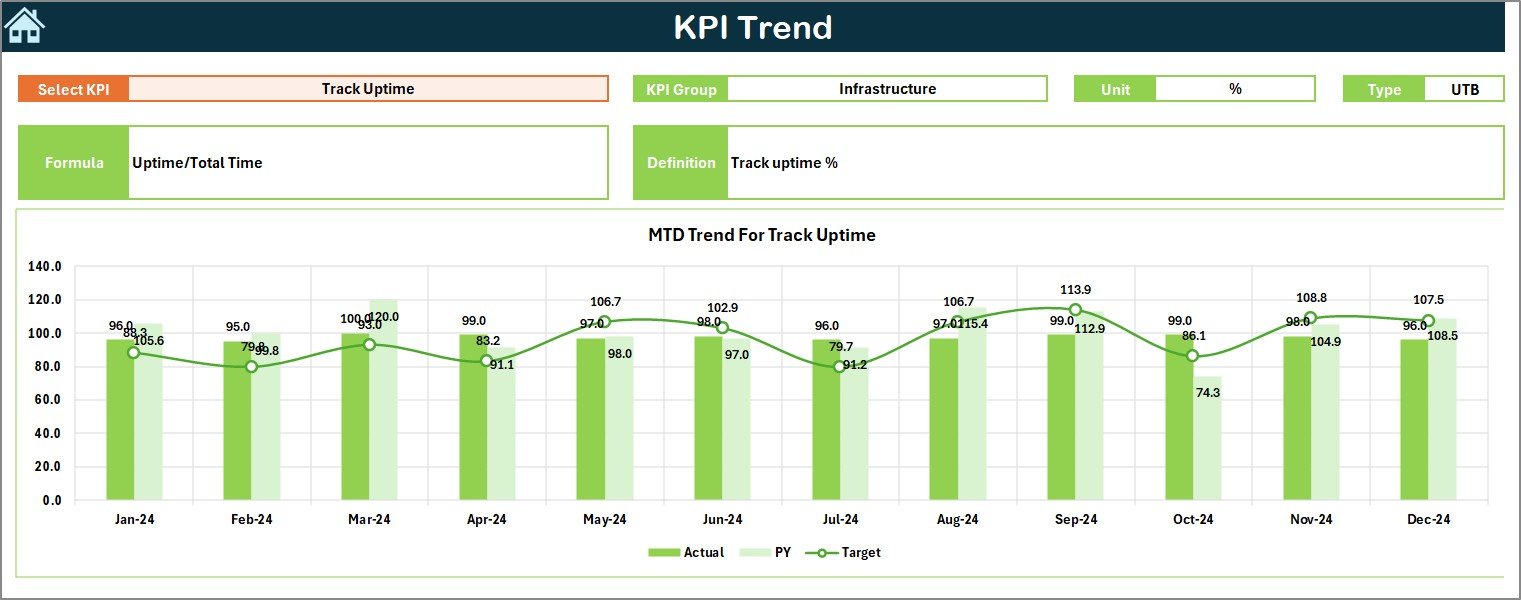
📈 Trend Analysis for Each KPI
The Trend Sheet shows long-term movement through MTD and YTD charts, helping teams catch issues early.
📝 Seven Fully-Organized Sheets
Dashboard, Trend, Input, Target, Previous Year, KPI Definition, and Summary Page—everything is beautifully structured.
🔧 No Technical Skills Required
The dashboard works with basic Excel knowledge, making it ideal for all team members.
📂 What’s Inside the Railways KPI Dashboard in Excel
This complete dashboard system includes seven professionally-built worksheets:
🏠 Summary Page
Your central navigation hub with buttons to jump to any sheet quickly.
📊 Dashboard Page
Displays all main KPIs, MTD vs Target, YTD vs Target, and CY vs PY comparisons—fully dynamic and interactive.
📈 Trend Sheet
Pick any KPI and analyze its movement using auto-updating charts.
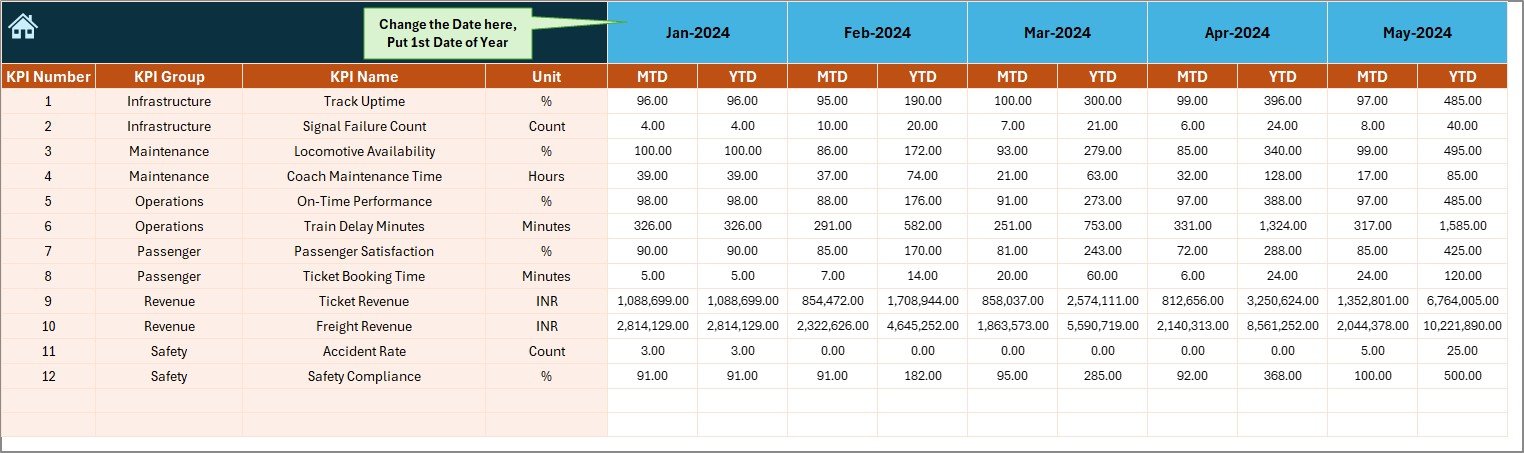
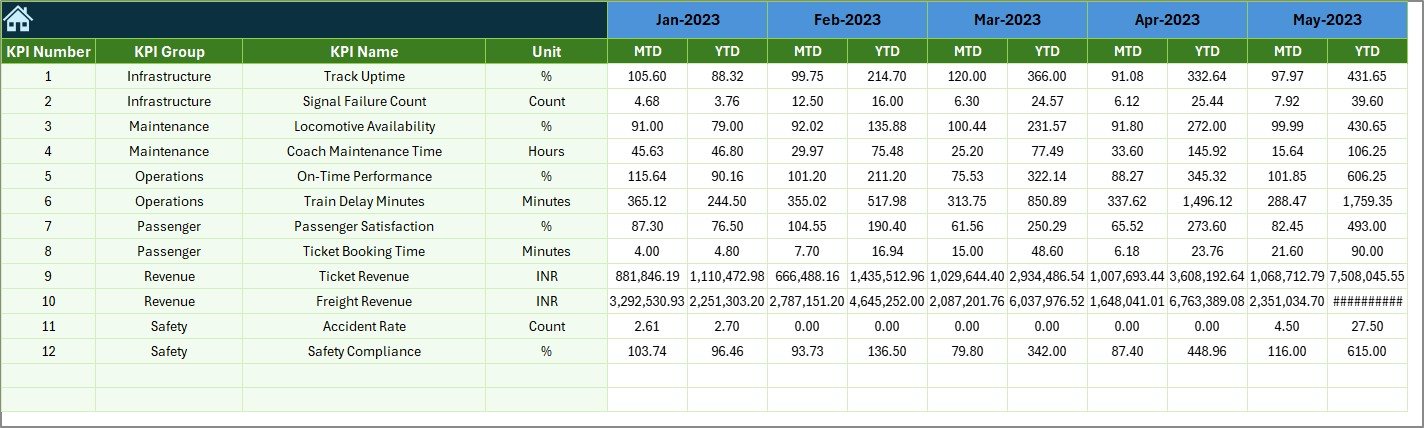
✍️ Actual Numbers Input Sheet
Enter your monthly MTD & YTD actual values in a simple and clean layout.
🎯 Target Sheet
Define performance targets for each KPI—both Month-wise and Year-wise.
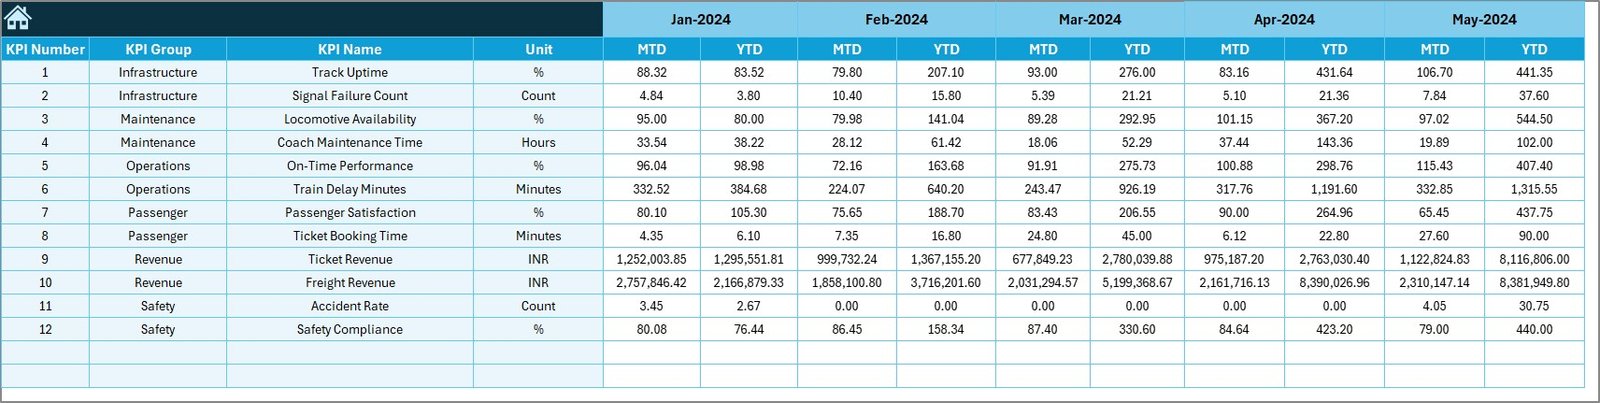
📅 Previous Year Sheet
Compare Current Year KPIs against Previous Year numbers effortlessly.
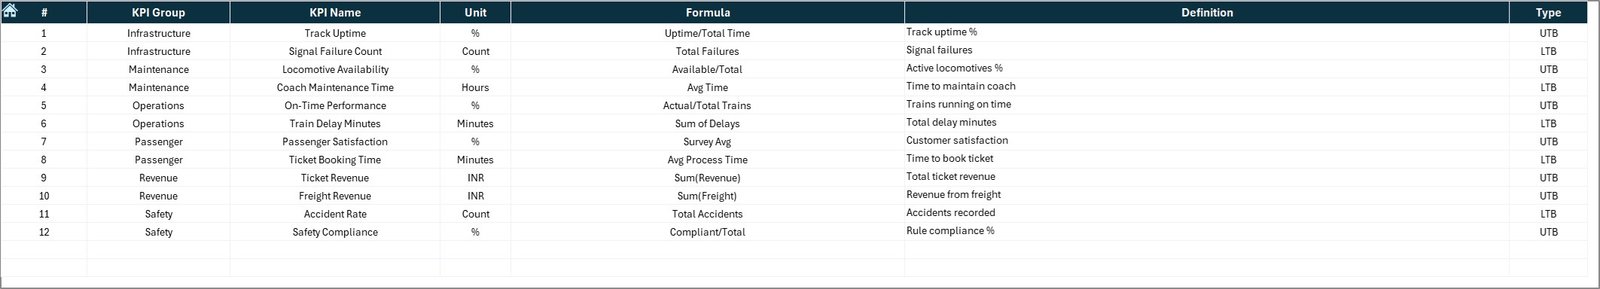
📘 KPI Definition Sheet
Add KPI logic, formulas, definitions, and KPI types (UTB/LTB) for complete clarity.
Every sheet is built for accuracy, speed, and clarity—making railway performance tracking extremely simple.
🛠️ How to Use the Railways KPI Dashboard in Excel
Using this dashboard is quick and simple—no advanced Excel skills needed:
1️⃣ Step 1: Enter Actual KPIs
Update the Actual Data sheet with MTD and YTD numbers.
2️⃣ Step 2: Set Your KPI Targets
Enter the monthly and yearly targets in the Target Sheet.
3️⃣ Step 3: Update Previous Year Data
Add CY vs PY values to track yearly improvement.
4️⃣ Step 4: Select the Reporting Month
Choose the month from the Dashboard Page (Cell D3).
5️⃣ Step 5: View Instant Results
Charts, comparisons, and signals refresh automatically—no manual effort needed.
Within minutes, your entire railway performance report is ready.
👥 Who Can Benefit from This Railways KPI Dashboard in Excel
This professional Excel dashboard is perfect for:
🚆 Railway Operations Teams
Track punctuality, train utilization, and service reliability.
🛠️ Maintenance & Safety Divisions
Monitor incidents, compliance, failures, and maintenance completion rates.
💼 Railway Administrators & Managers
Get transparent, real-time insights for decision-making.
🧮 Railway Finance Teams
Analyze cost per KM, revenue per passenger, and operating efficiency.
🧑💻 Data Analysts & Reporting Teams
Use ready-made visuals and charts to speed up monthly reporting.
🔧 Freight & Passenger Units
Customize KPIs for zones, divisions, stations, or regions.
If your organization depends on structured, reliable, and clear performance metrics—this dashboard is built for you.
### Click here to read the detailed blog post
Watch the step-by-step video tutorial:


Reviews
There are no reviews yet.