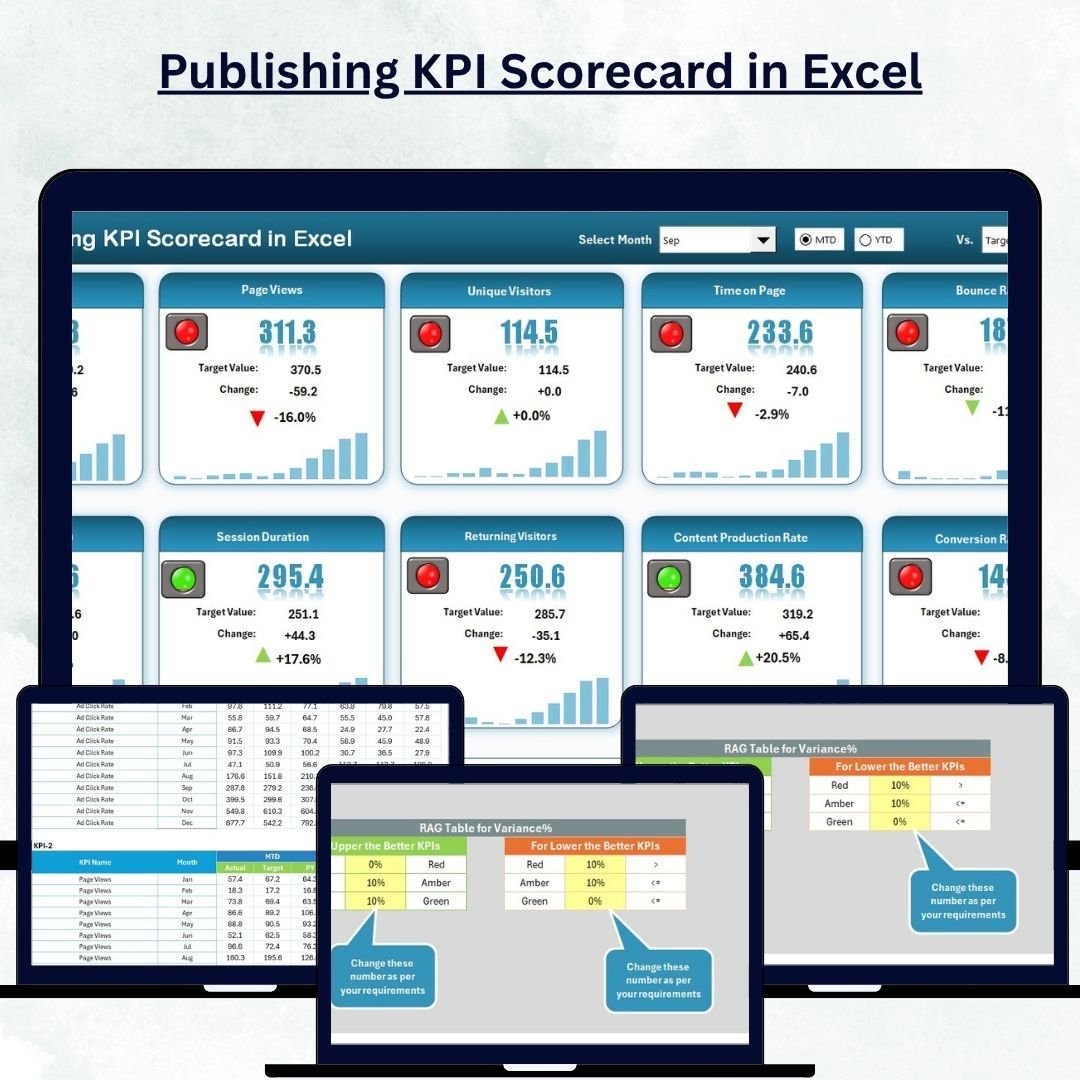

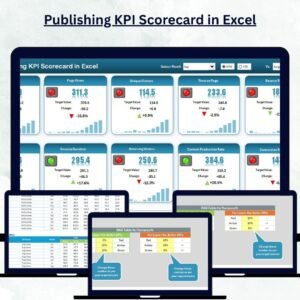
The Publishing KPI Scorecard in Excel .is a ready-to-use performance management tool built for publishers, editors, and content managers who want to measure their success efficiently. Designed to bring clarity and control to your publishing operations, it helps you track editorial, sales, and marketing KPIs — all in one place!
Key highlights include:
-
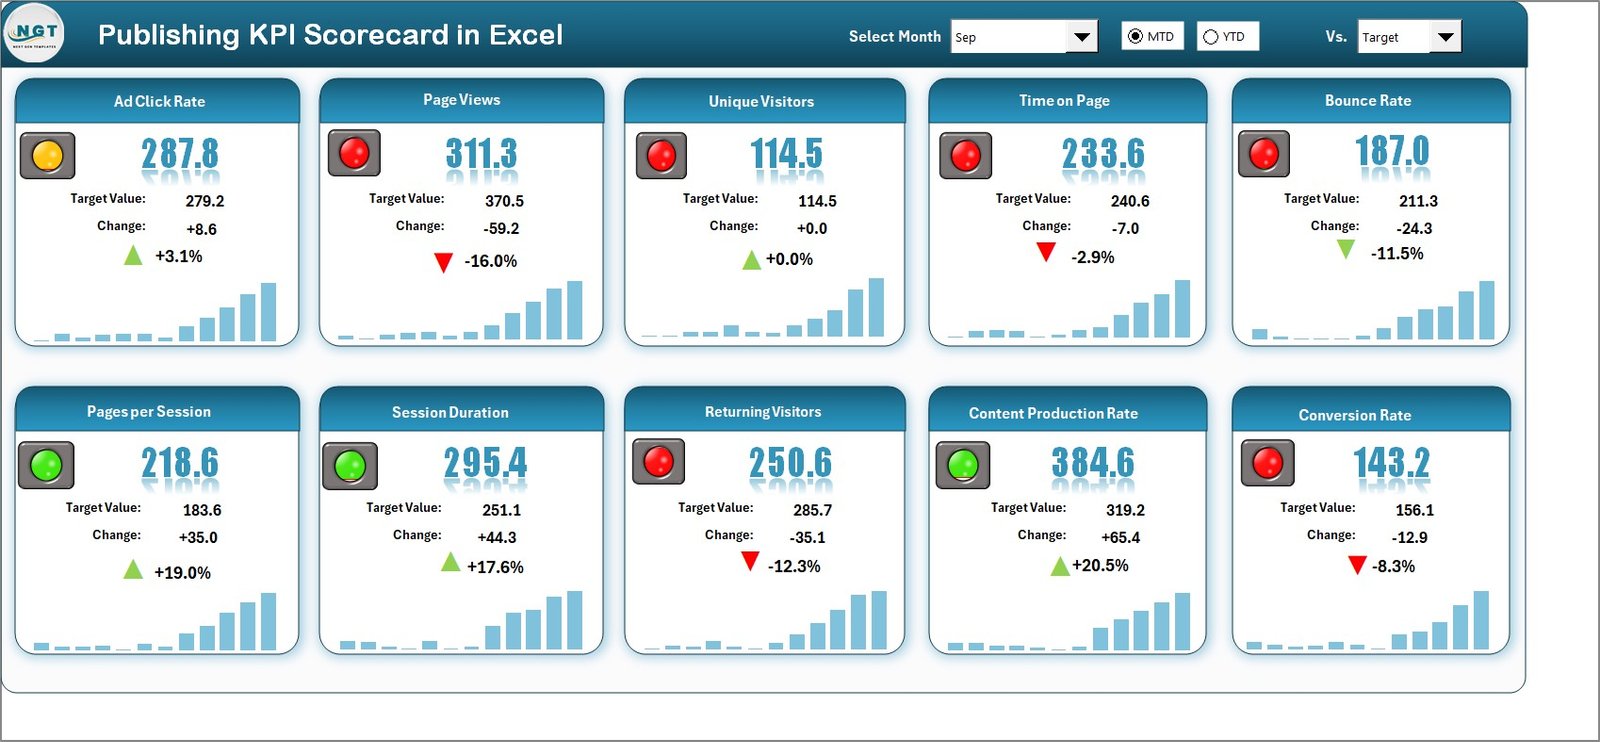
🧩 All-in-One Dashboard: Monitor up to 10 KPIs in a single, easy-to-read scorecard.
-
📅 MTD & YTD Analysis: Switch between Month-to-Date and Year-to-Date data effortlessly.
-
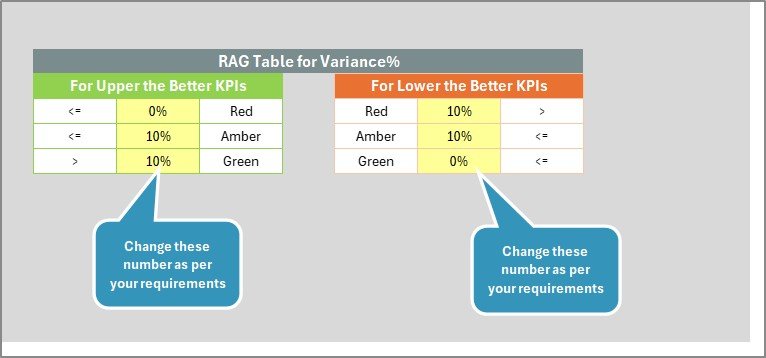
🎨 Visual Indicators: Color-coded visuals for quick insights — green for success, red for alerts, yellow for areas to improve.
-
🔄 Dynamic KPI Trend Sheet: View performance trends and patterns for every KPI.
-
💡 Smart Formulas: Excel-powered automation using SUMIFS, IFERROR, and AVERAGEIFS functions.
-
💰 Cost-Effective & Flexible: No need for expensive BI software — Excel does it all.
📦 What’s Inside the Publishing KPI Scorecard in Excel
This template includes four well-structured worksheets, each designed to handle a specific function of your publishing analytics workflow:
1️⃣ Scorecard Sheet (Main Dashboard):
-
Dropdowns for month and MTD/YTD selection.
-
Displays 10 KPIs at once with visual performance indicators.
-
Actual vs Target comparisons for better decision-making.
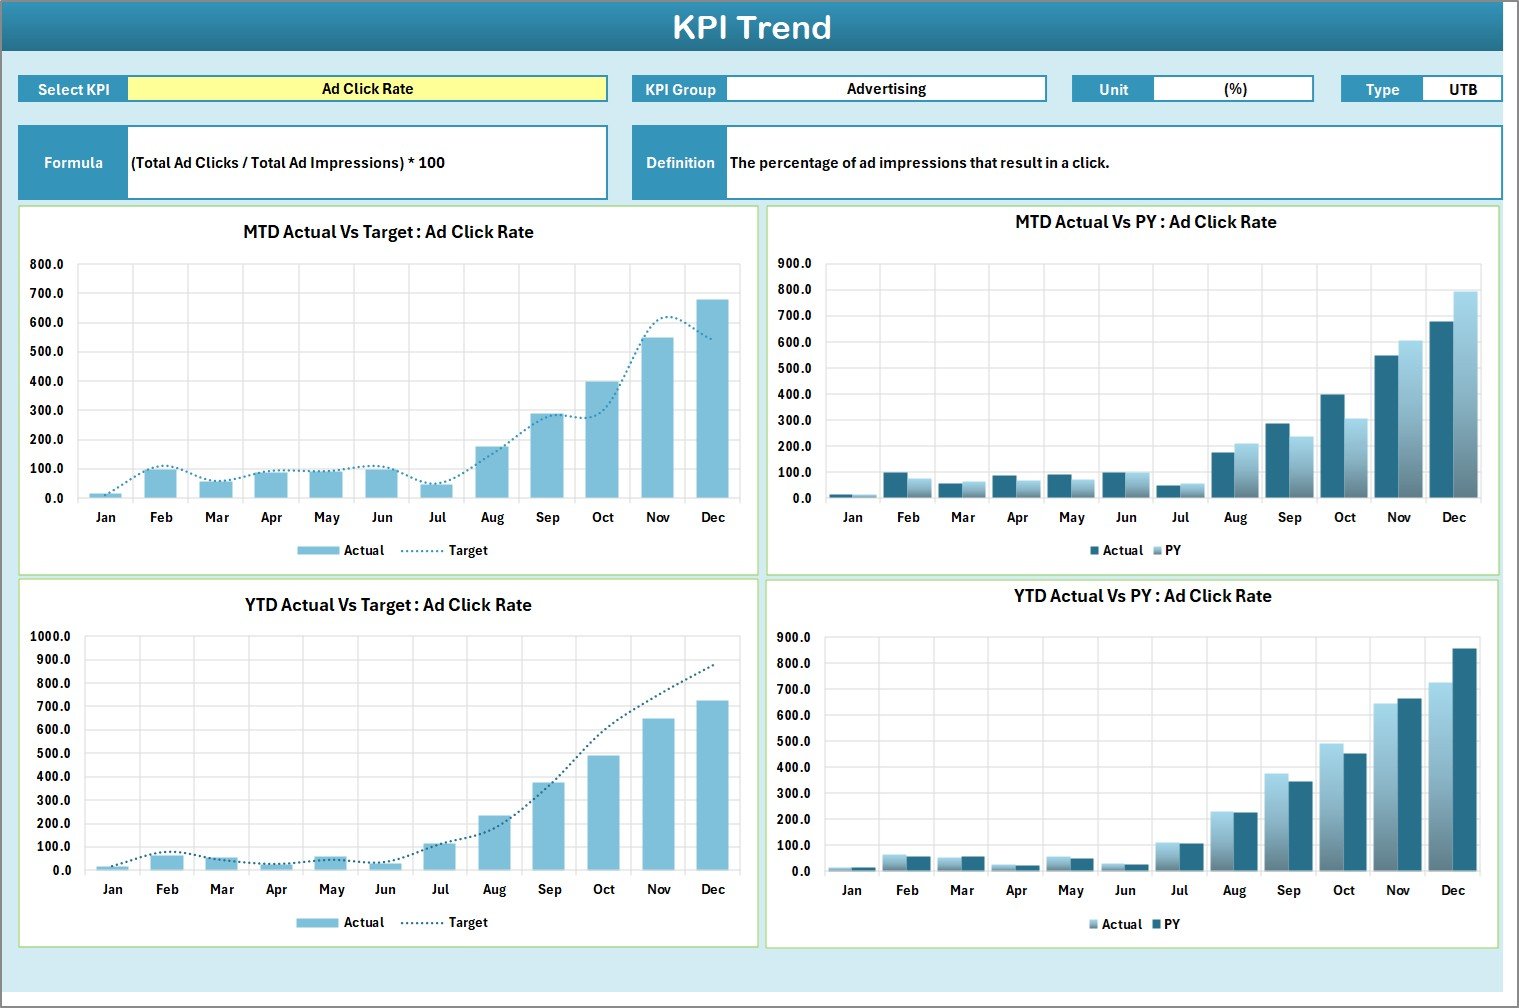
2️⃣ KPI Trend Sheet:
-
Analyze each KPI in detail by selecting it from the dropdown in cell C3.
-
Auto-display of KPI metadata (Group, Unit, Type, Formula, Definition).
-
View Actual, Target, and Previous Year trends through dynamic charts.
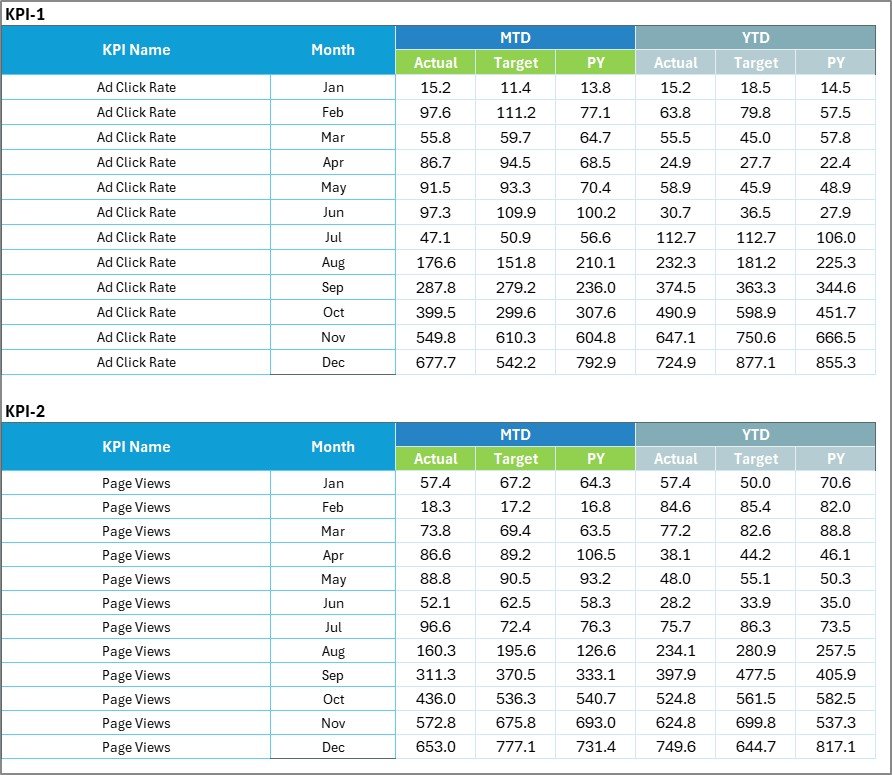
3️⃣ Input Data Sheet:
-
Input monthly data such as Actual, Target, and Previous Year.
-
Automatically updates the dashboard visuals.
-
Can link to external sources like Google Sheets or ERP systems.
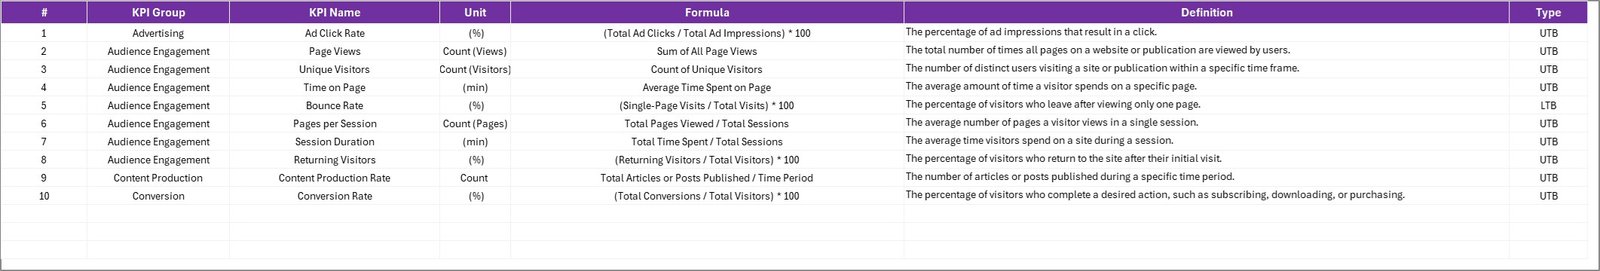
4️⃣ KPI Definition Sheet:
-
Acts as a master reference for KPI details.
-
Defines Unit, Formula, and Type (UTB/LTB) for consistent understanding.
These sheets work seamlessly together to help you analyze performance and drive improvement across all publishing areas.
⚙️ How to Use the Publishing KPI Scorecard in Excel
Getting started is easy! 🚀
1️⃣ Set Clear Goals: Define what you want to track — sales revenue, ad clicks, or editorial output.
2️⃣ Enter Data Monthly: Update Actual and Target values for MTD/YTD analysis.
3️⃣ Analyze Variances: Quickly spot deviations between actual and target performance.
4️⃣ Review Trends: Use the KPI Trend sheet to visualize performance patterns.
5️⃣ Act & Improve: Adjust content strategy, budgets, or team priorities based on insights.
💡 Tip: Automate your data import from external files to save time and reduce manual work.
🎯 Who Can Benefit from This Publishing KPI Scorecard
This tool is designed for everyone in the publishing ecosystem who relies on data to make smarter decisions:
-
📝 Editorial Teams: Track article output, editing turnaround time, and publishing frequency.
-
📈 Marketing Teams: Measure campaign ROI, subscriber growth, and audience engagement.
-
💼 Sales Teams: Monitor ad sales, renewals, and revenue per publication.
-
⚙️ Production Teams: Analyze print quality, turnaround time, and costs.
-
💵 Finance Departments: Track profit margins, cost-to-revenue ratios, and ROI.
Whether you manage a magazine, digital media company, academic press, or publishing startup, this Excel scorecard gives you actionable insights that boost efficiency and profitability.
💡 Why Choose This Template?
✅ Ready-to-use — no coding or BI software needed.
✅ Fully editable — customize KPIs, charts, and visuals.
✅ Real-time tracking — stay informed on performance anytime.
✅ Affordable — get enterprise-level reporting for a fraction of the cost.
✅ Perfect for both print and digital publishers.


Reviews
There are no reviews yet.