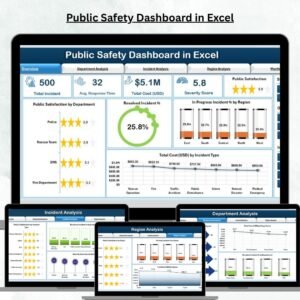
Public safety is at the core of every community’s well-being. From fire emergencies and law enforcement to healthcare incidents and disaster management, authorities need a reliable system to track, analyze, and respond efficiently. Relying on scattered spreadsheets or manual logs often leads to delays, inefficiencies, and missed insights. The Public Safety Dashboard in Excel solves this challenge by consolidating all safety data into a single, interactive, and easy-to-use template.
Built entirely in Microsoft Excel, this ready-to-use dashboard transforms raw data into powerful insights with charts, KPI cards, and slicers. It provides managers, policymakers, and safety officers with real-time visibility into incidents, trends, costs, and public satisfaction—helping them make faster, data-driven decisions that save both time and resources.
✨ Key Features of the Public Safety Dashboard
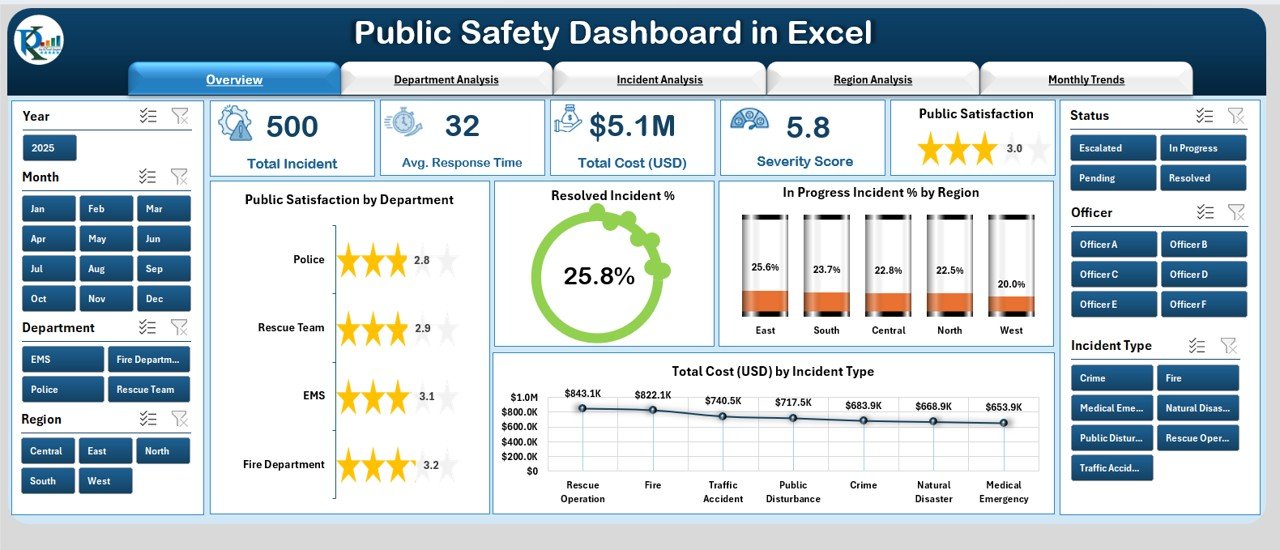
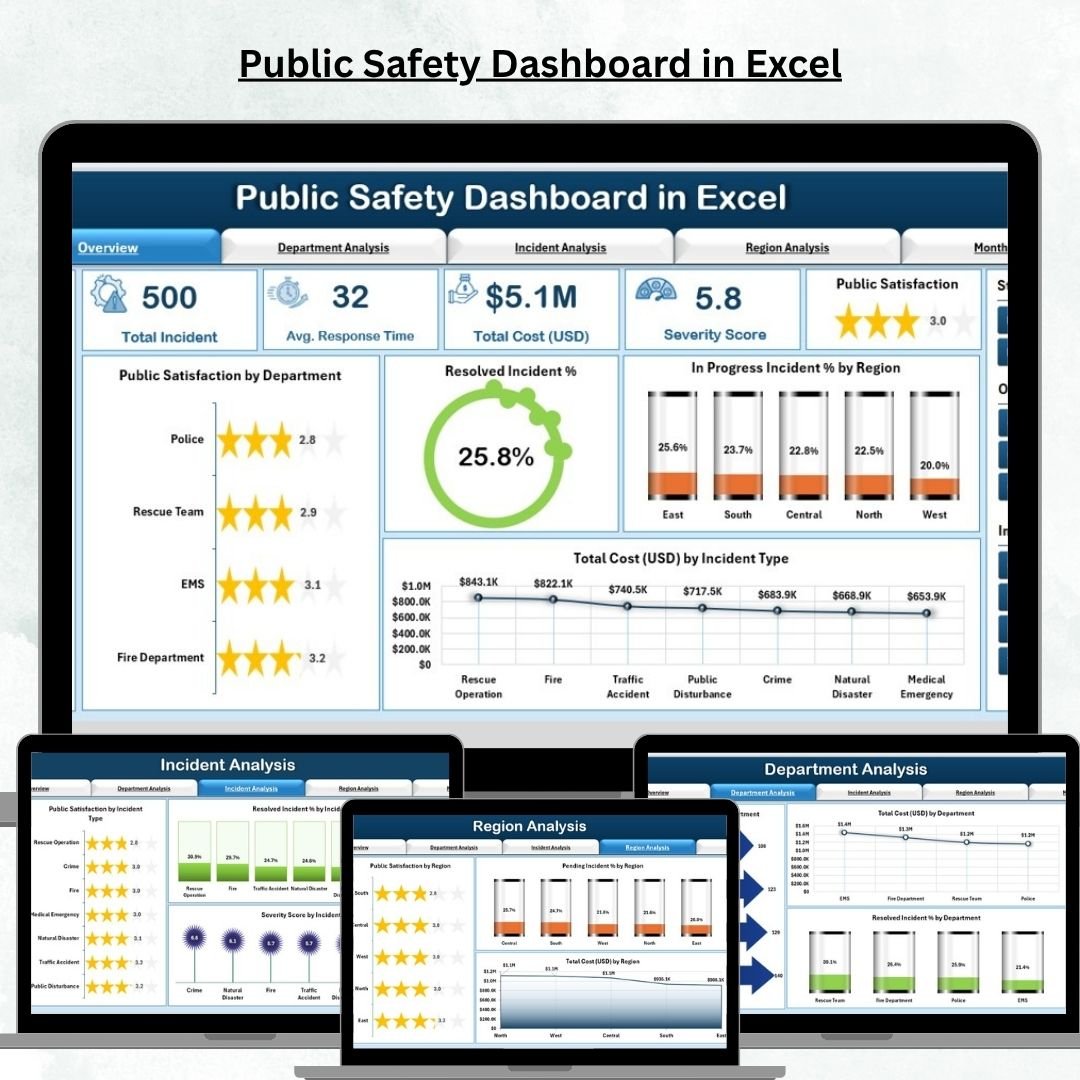
✅ Overview Page – High-level snapshot with summary cards and charts showing satisfaction, resolution rates, and cost breakdowns.
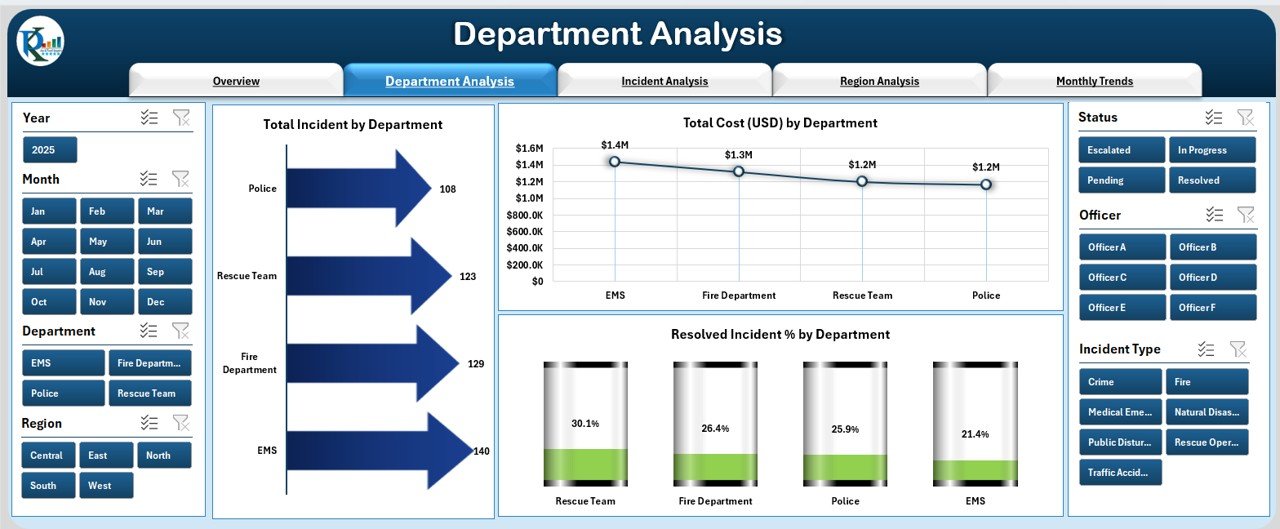
✅ Department Analysis – Drill into total incidents, costs, and resolution percentages by department.
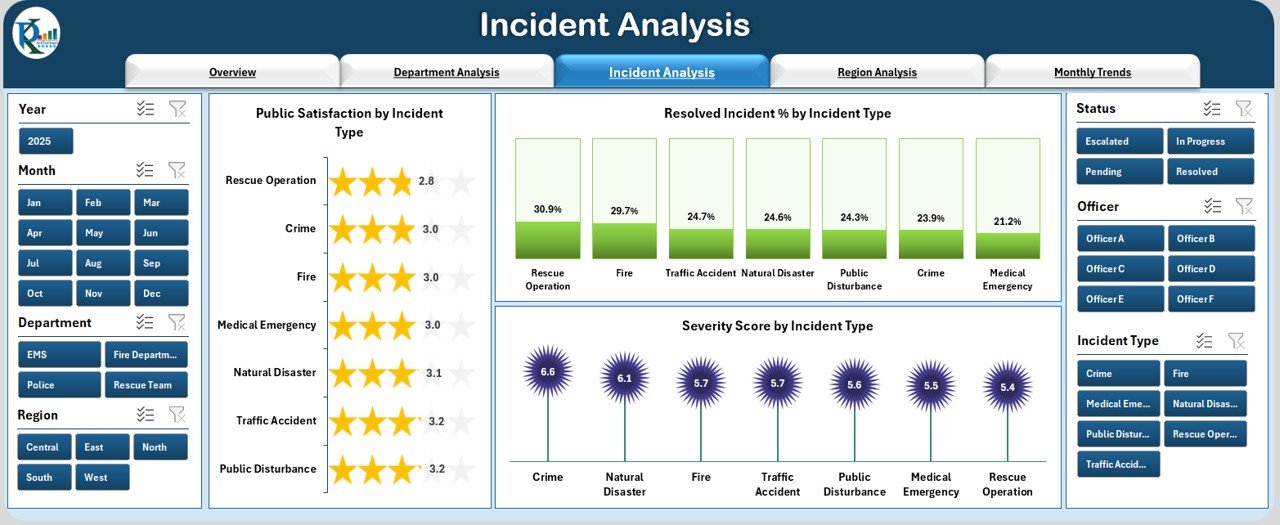
✅ Incident Analysis – Understand performance by incident type, severity, and satisfaction.
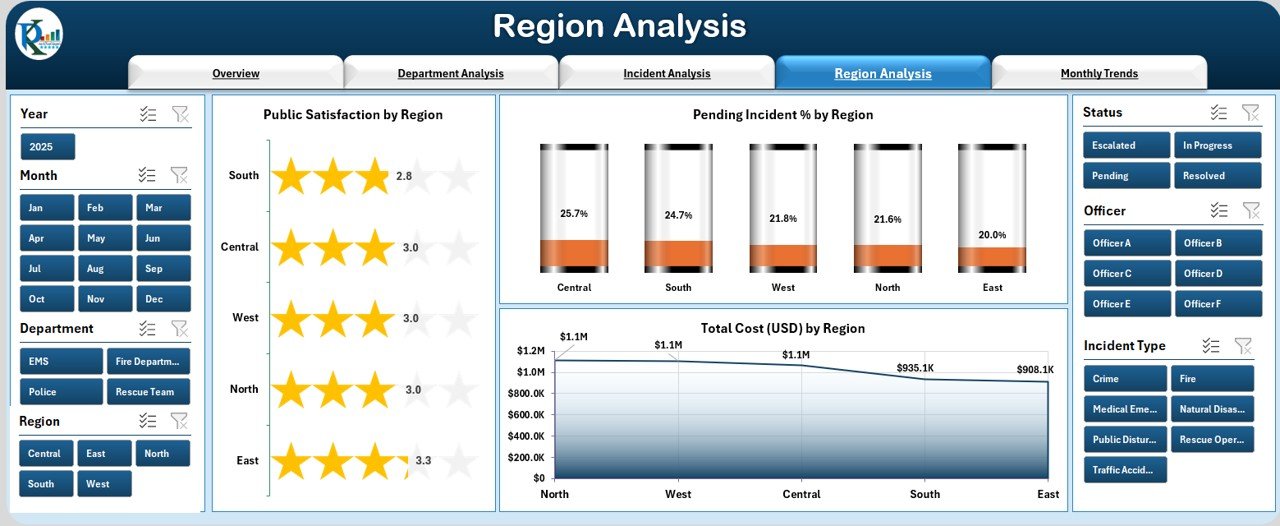
✅ Region Analysis – Identify regional strengths and weaknesses, monitor pending incidents, and compare costs.
✅ Monthly Trends – Visualize progress over time with monthly satisfaction, resolution %, and cost charts.
✅ Support Sheet – Centralized raw data storage and reference lists for dropdowns and validations.
✅ Interactive Slicers – Instantly filter reports by department, region, incident type, or timeline.
✅ Customizable & Scalable – Add or edit KPIs, charts, or categories to fit your organization’s needs.
📂 What’s Inside the Public Safety Dashboard
This template is structured across five analytical pages plus a support sheet:
-
Overview Page 📊 – Page Navigator, KPI cards, and charts covering satisfaction, resolution %, cost by type, and incident trends.
-
Department Analysis 🏢 – Compare incidents, cost efficiency, and resolution across departments.
-
Incident Analysis 🚨 – Evaluate severity and satisfaction by type of incident.
-
Region Analysis 🌍 – Compare performance across different locations and track pending incidents.
-
Monthly Trends 📈 – Spot seasonal patterns, recurring challenges, or improvements over time.
-
Support Sheet 🔧 – The foundation for all reports, ensuring accuracy and consistency.
🛠️ How to Use the Public Safety Dashboard
-
Update Data – Enter incidents, departments, costs, and satisfaction metrics into the Support Sheet.
-
Navigate Pages – Use the Page Navigator to move between Overview, Department, Incident, Region, and Trends.
-
Filter with Slicers – Instantly drill down by region, type, or department.
-
Review KPIs – Monitor key statistics using cards and charts.
-
Analyze Trends – Track improvements or recurring issues monthly.
-
Share Reports – Export visuals for presentations and policy discussions.
👥 Who Can Benefit from This Dashboard?
👮 Police Departments – Monitor crime, response times, and clearance rates.
🚒 Fire Services – Track fire incidents, damage costs, and response efficiency.
🏥 Emergency Medical Units – Analyze patient response times and treatment outcomes.
🏛️ Municipal Authorities – Monitor citizen satisfaction with local safety services.
🌪️ Disaster Management Teams – Track incident responses during natural disasters.
📊 Government Agencies – Improve accountability and decision-making through transparent reporting.


Reviews
There are no reviews yet.