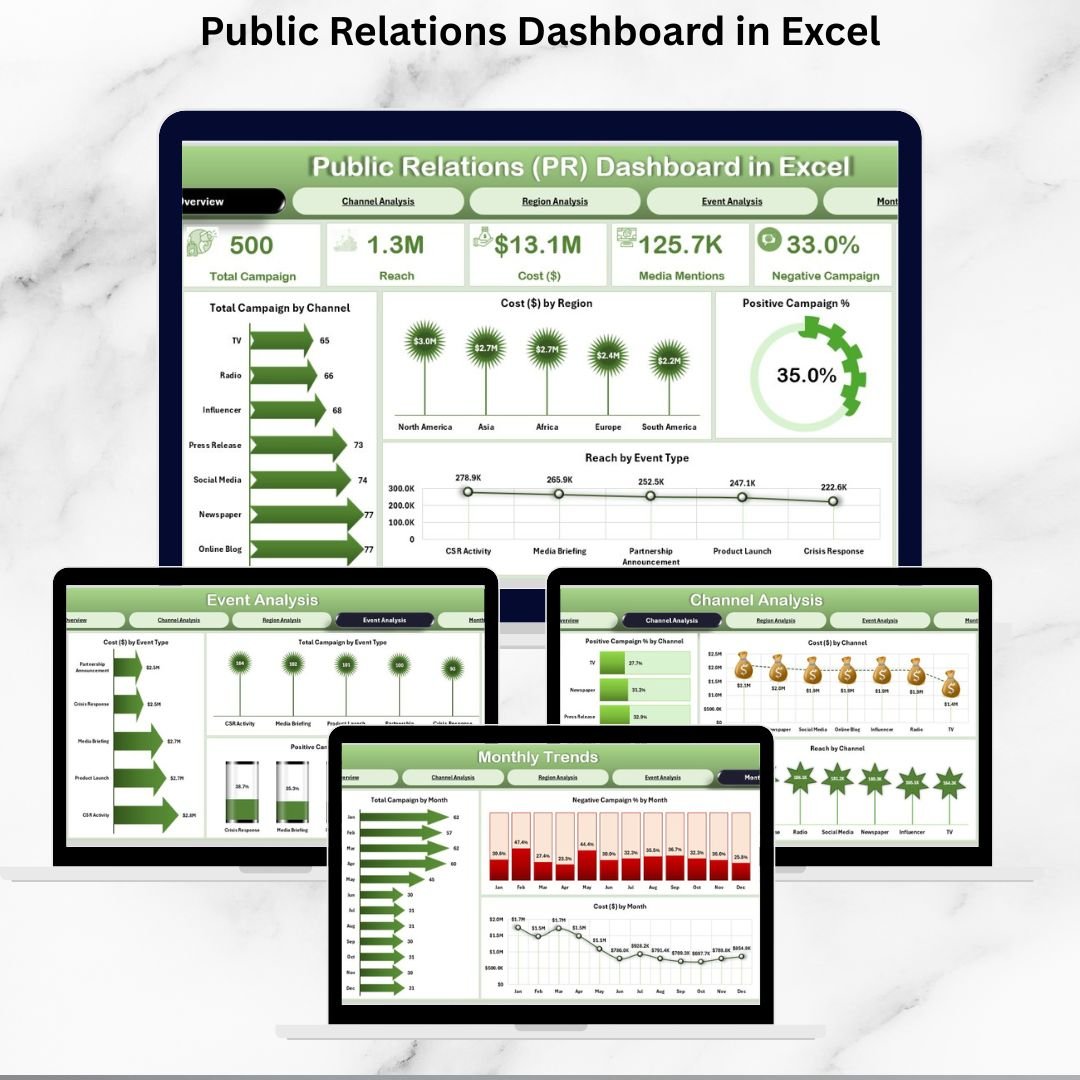
Managing Public Relations (PR) has evolved far beyond press releases and media pitches. In today’s digital-first world, PR professionals must track campaigns, coverage, sentiment, costs, and reach across multiple channels. Without a structured system, analyzing PR success can be overwhelming and inefficient.
That’s why we created the Public Relations Dashboard in Excel—a ready-to-use, interactive, and visual solution that consolidates PR data into one central view. With built-in slicers, navigation buttons, KPI cards, and charts, this dashboard helps PR teams and executives measure impact, optimize campaigns, and make data-driven communication decisions.
✨ Key Features of PR Dashboard in Excel
-
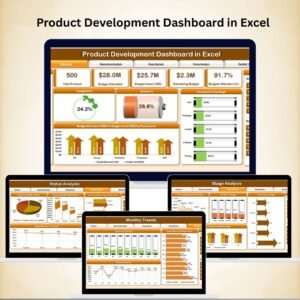
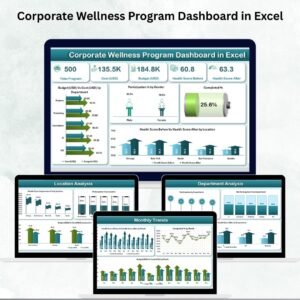
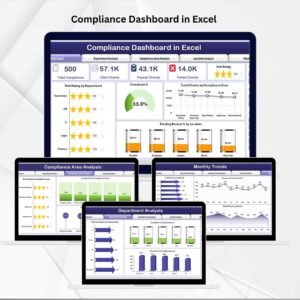
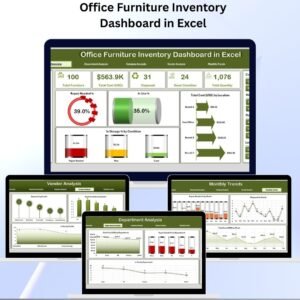
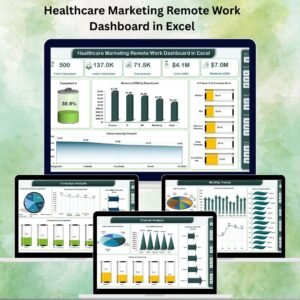
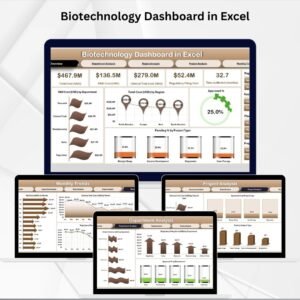
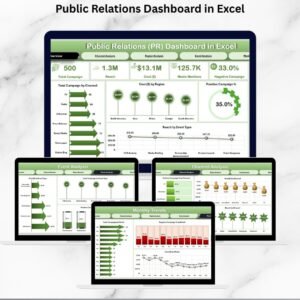
📊 5 Analytical Pages – Overview, Channel, Region, Event, and Monthly Trends.
-
🎯 KPI Cards – Instantly track campaign count, cost, reach, and sentiment.
-
⚡ Interactive Slicers – Filter by time, region, channel, or campaign type.
-
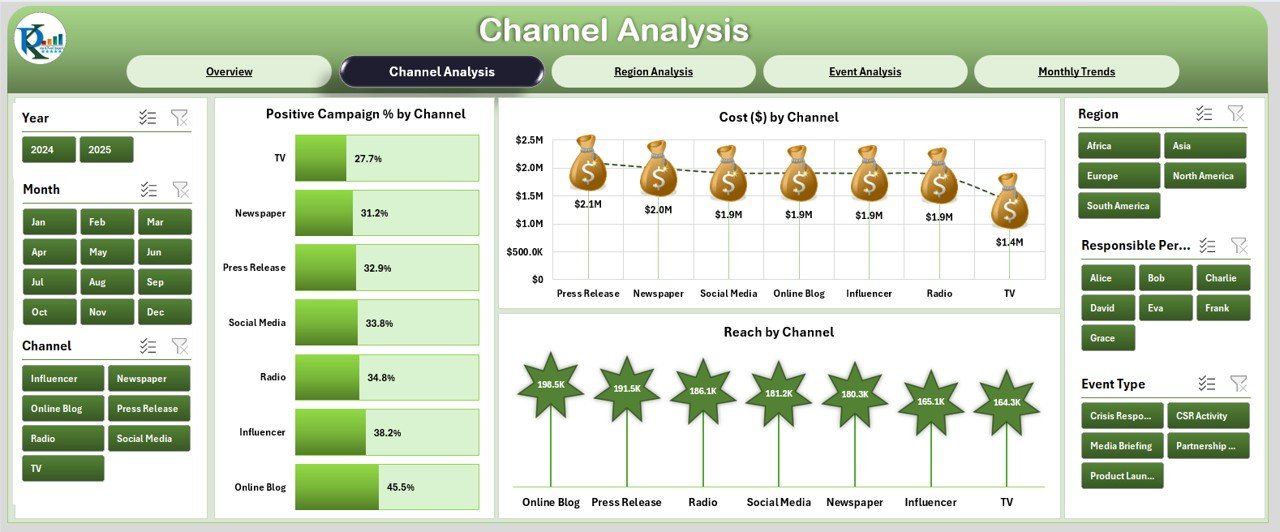
📈 Channel Analysis – Compare positive mentions, costs, and reach across platforms.
-
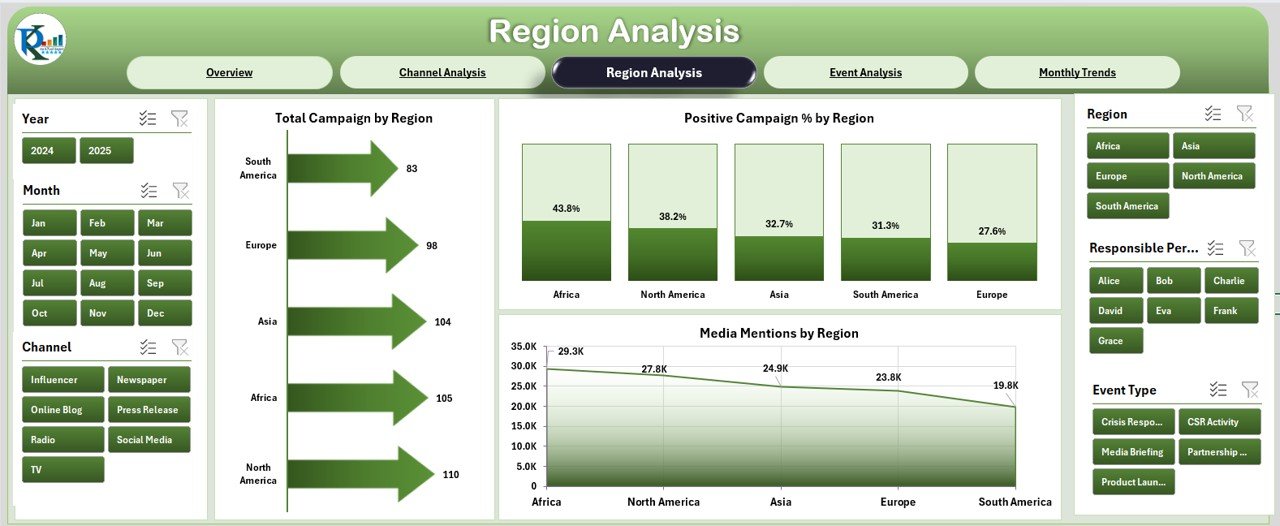
🌍 Regional Insights – Evaluate campaigns and media mentions by geography.
-
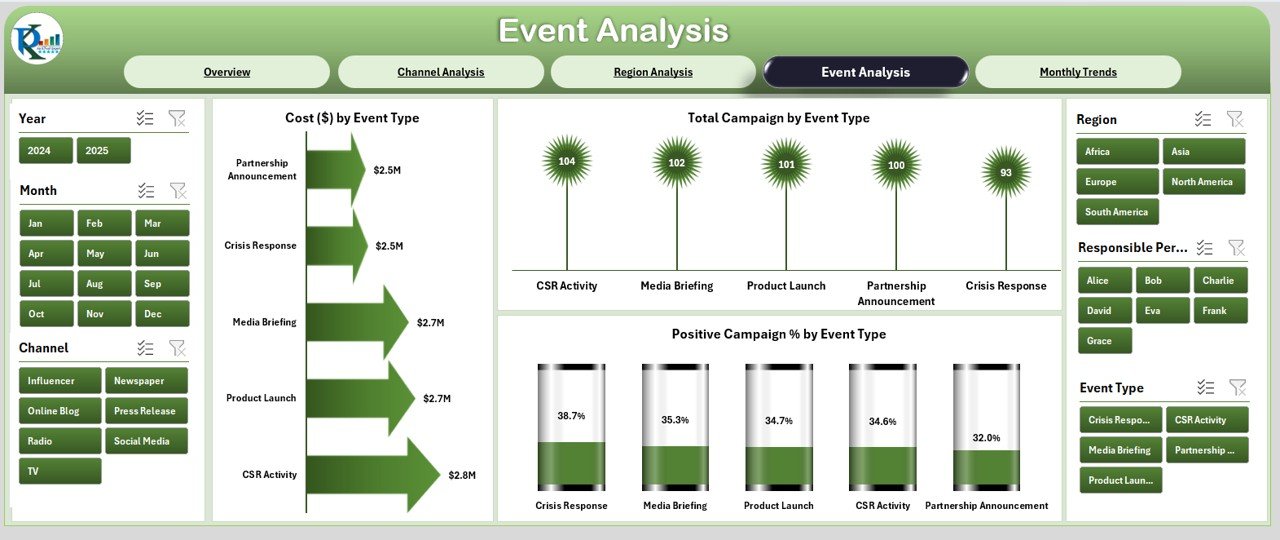
🎪 Event Performance – Analyze ROI of PR events like launches or conferences.
-
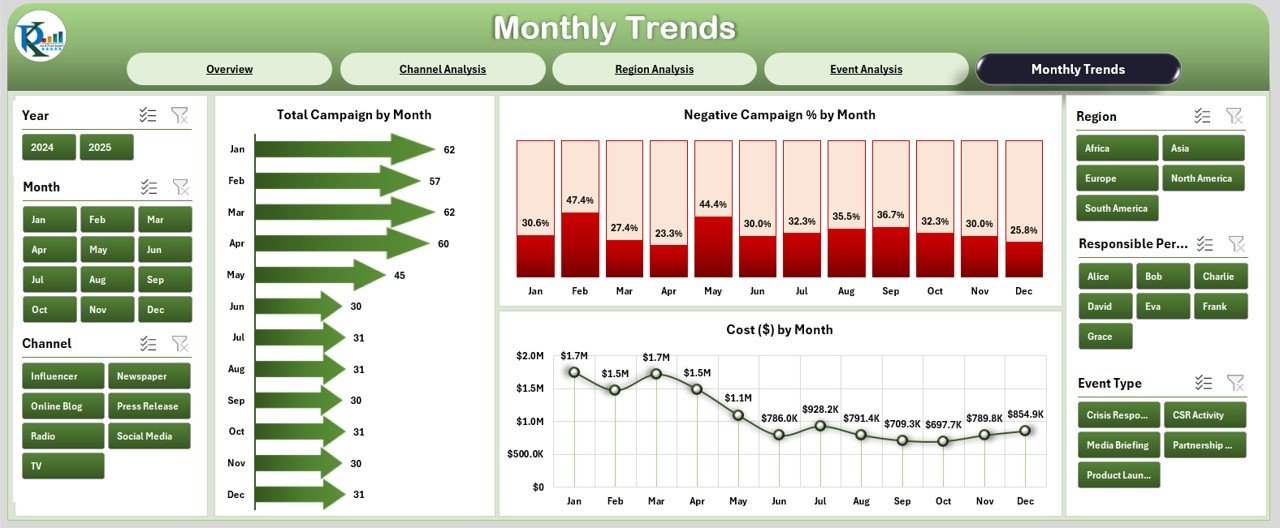
📆 Monthly Trends – Spot seasonal peaks, cost changes, and negative PR trends.
-
🗂 Support Sheet – Organized backend with structured reference data.
-
🛠 Customizable – Add new KPIs or adapt visuals to your PR strategy.
-
💰 Cost-Effective – Excel-based, no expensive PR analytics tools required.
📂 What’s Inside the PR Dashboard
-
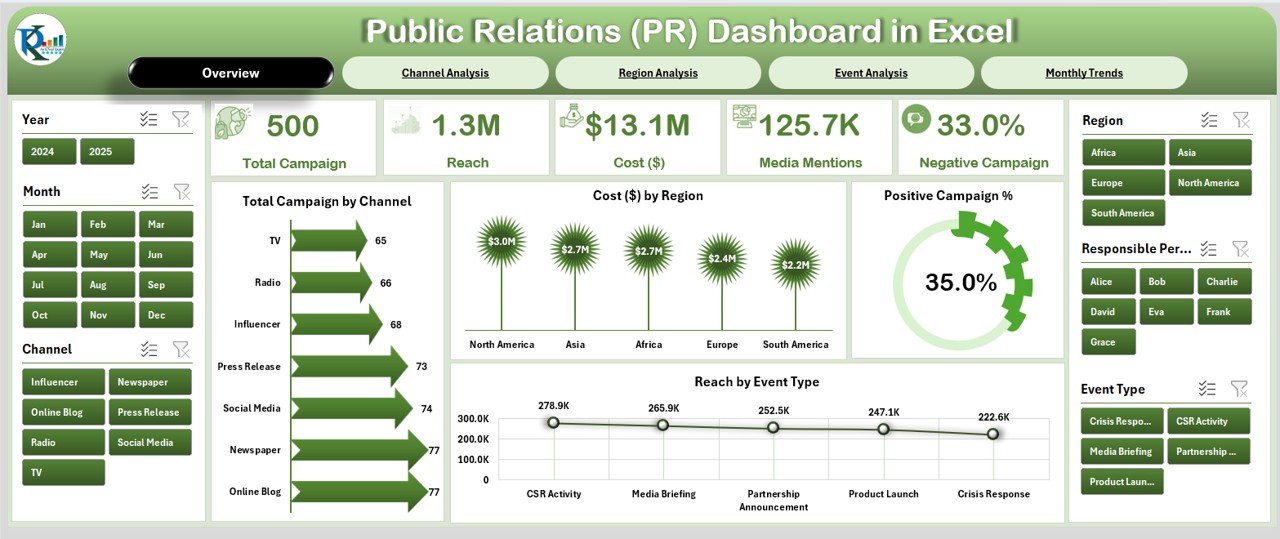
Overview Page – The central hub with KPI cards, slicers, and charts for campaign, cost, sentiment, and reach.
-
Channel Analysis – Track performance by media type (social, print, TV, digital, events).
-
Region Analysis – Monitor campaigns, positive % results, and mentions across locations.
-
Event Analysis – Evaluate cost, reach, and sentiment for PR events.
-
Monthly Trends – Analyze campaign count, sentiment %, and cost trends month by month.
-
Support Sheet – The backend powering all visuals with dropdowns, regions, statuses, and channels.
📖 How to Use the PR Dashboard
-
Enter Campaign Data – Fill in campaign details like channel, region, event type, cost, and reach.
-
Navigate Pages – Use the page navigator to switch between overview, channels, events, and trends.
-
Filter with Slicers – Narrow down insights by time, region, or campaign type.
-
Review Metrics – Use KPI cards and charts to measure performance and sentiment.
-
Take Action – Identify high-performing regions/channels and optimize campaign budgets.
👥 Who Can Benefit from This Dashboard?
-
🏢 Corporate PR Teams – Track digital, print, and media campaigns.
-
🌍 Nonprofits & NGOs – Measure outreach and awareness initiatives.
-
🏛 Government Agencies – Monitor public perception of policies and programs.
-
🎪 Event Firms – Evaluate event reach, sentiment, and cost efficiency.
-
🚀 Startups & SMEs – Optimize PR spending and identify effective channels.
This dashboard provides a single source of truth for campaign analysis and storytelling.
✅ Click here to read the Detailed blog post
Visit our YouTube channel to learn step-by-step video tutorials


Reviews
There are no reviews yet.