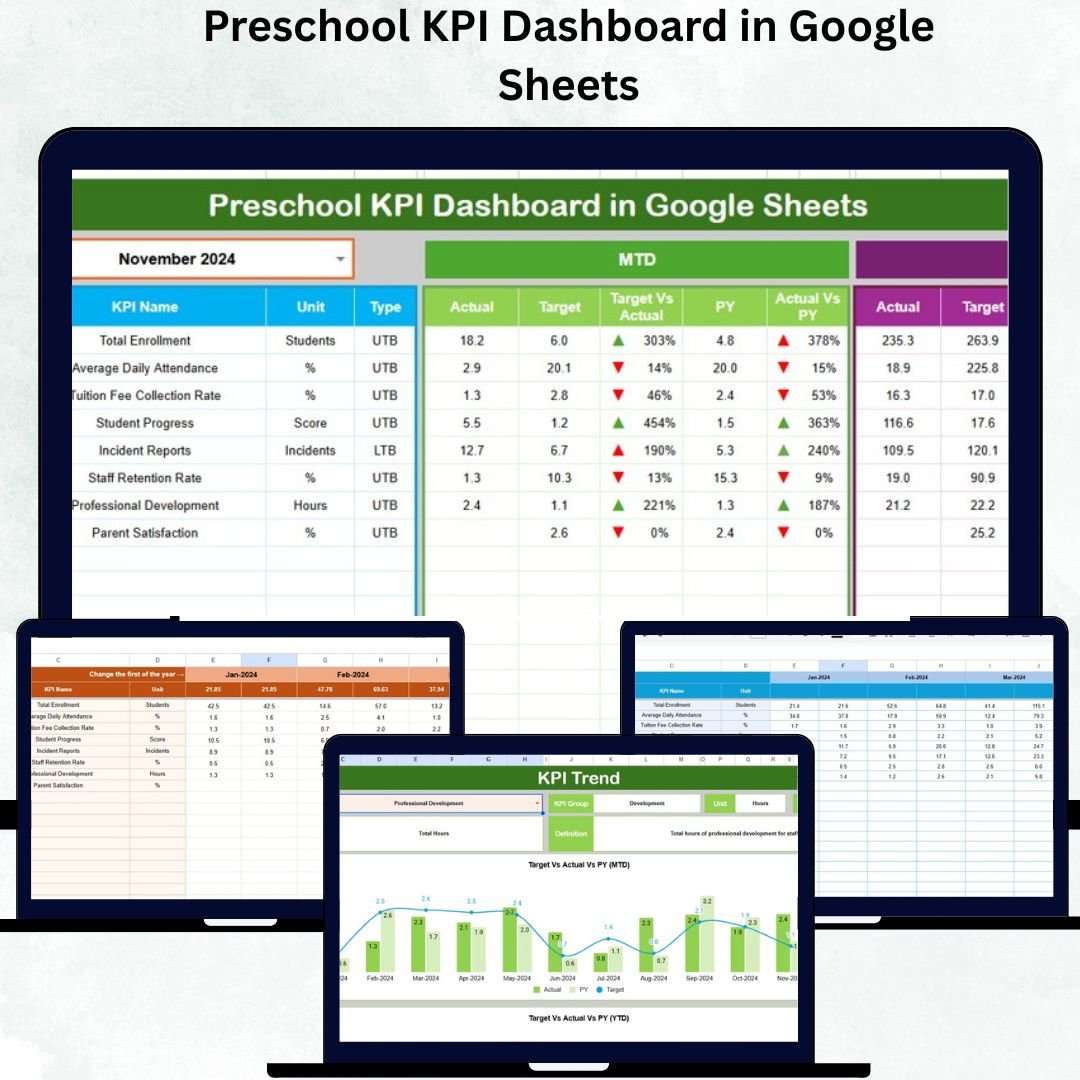
Running a preschool involves more than teaching — it’s about balancing academic goals, operational efficiency, and parent satisfaction. That’s where the Preschool KPI Dashboard in Google Sheets comes in — your all-in-one, cloud-based performance tracker that turns data into actionable insights.
This smart, easy-to-use dashboard helps preschool administrators, teachers, and owners monitor key performance indicators such as student enrollment, attendance, staff performance, classroom utilization, and parent feedback — all in one place.
Built in Google Sheets, it offers automation, visual charts, and trend analysis — without any coding or complex setup.
✨ Key Features of Preschool KPI Dashboard in Google Sheets
✅ 📊 Centralized Performance Tracking – View all important metrics like enrollment, attendance, satisfaction, and teacher efficiency on a single screen.
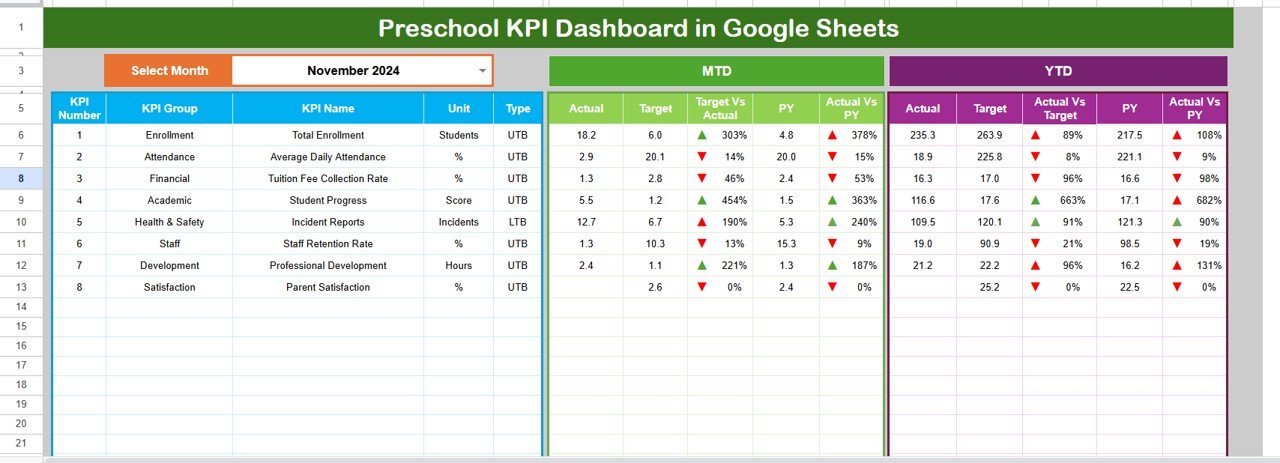
✅ 🎯 Real-Time Analysis – Select any month from the drop-down menu, and the dashboard instantly updates to show MTD (Month-to-Date) and YTD (Year-to-Date) results.
✅ 📈 Conditional Formatting & Trends – Instantly spot performance highs and lows with green/red arrows and visual progress charts.
✅ ⚙️ Automated Calculations – Input once — and let formulas auto-update across all reports and charts.
✅ ☁️ Cloud-Based Access – Collaborate in real time; share securely with your staff or management team.
✅ 📉 Historical Comparisons – Track year-over-year progress to see how academic and operational performance evolves.
✅ 🧩 Fully Customizable – Add or modify KPIs, formulas, and visuals according to your preschool’s goals.
✅ 💰 Cost-Effective Tool – Forget expensive BI tools — everything runs within Google Sheets!
📦 What’s Inside the Preschool KPI Dashboard
Your template includes six professionally designed worksheets, each serving a key function:
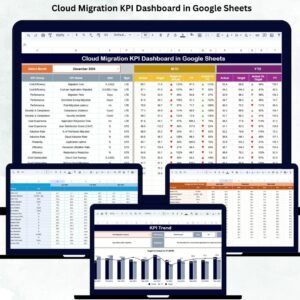
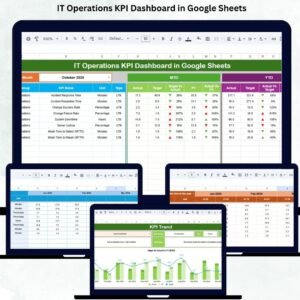
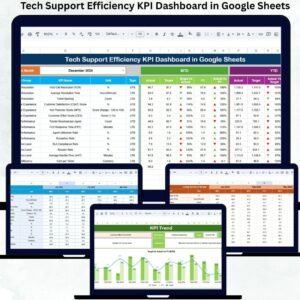
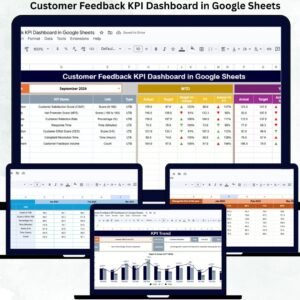
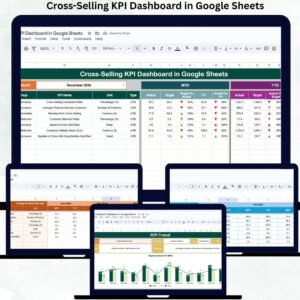
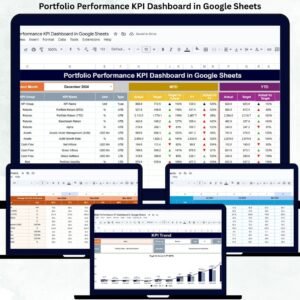
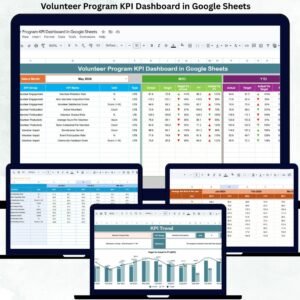
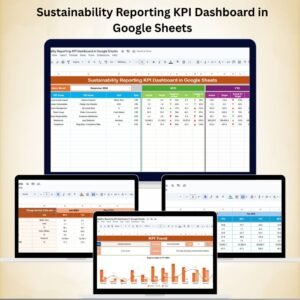
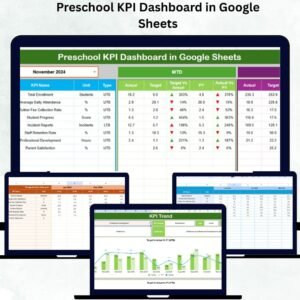
1️⃣ Dashboard Sheet Tab – The main control panel showing MTD & YTD Actual vs Target vs Previous Year KPIs with visual indicators.
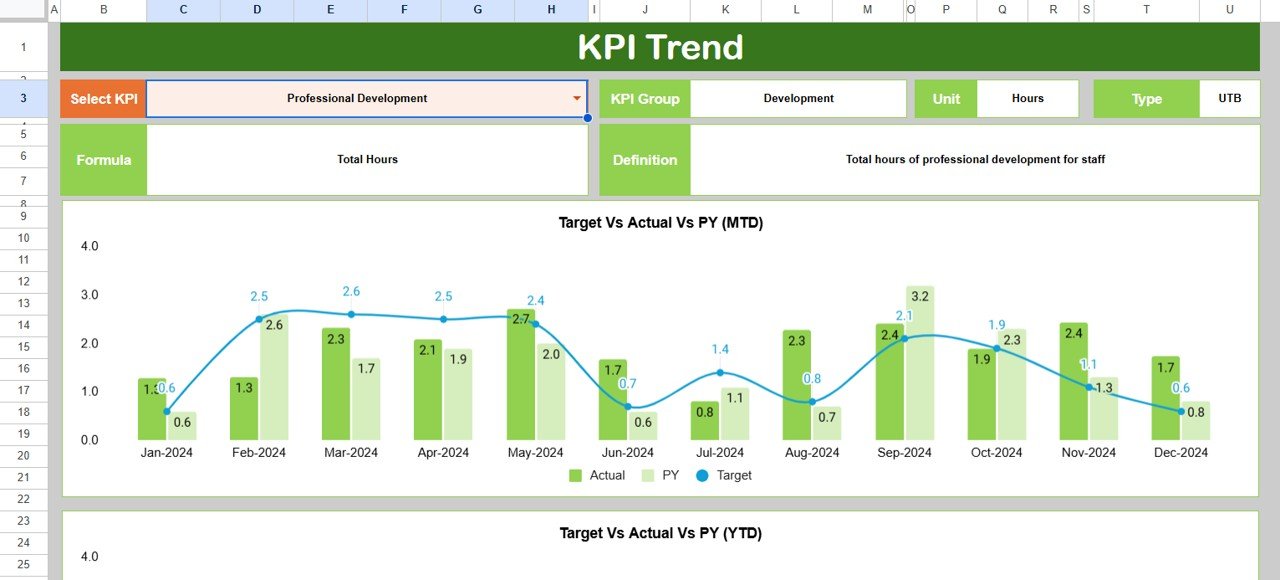
2️⃣ Trend Sheet Tab – Analyze KPI progress month-by-month using dropdown-based charts for Actual, Target, and Previous Year values.
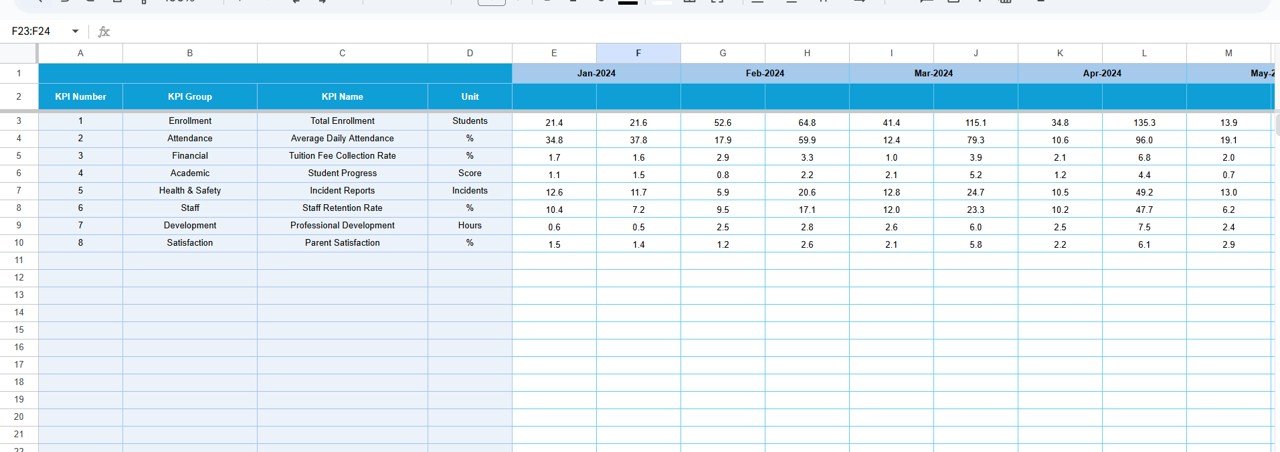
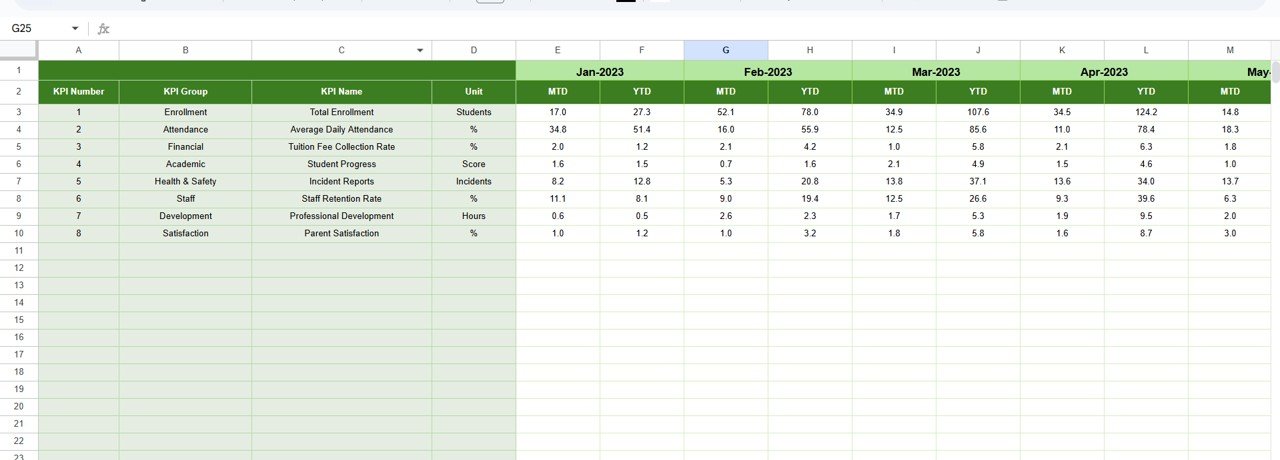
3️⃣ Actual Numbers Input Sheet – Enter real-time performance data; this automatically feeds into the dashboard.
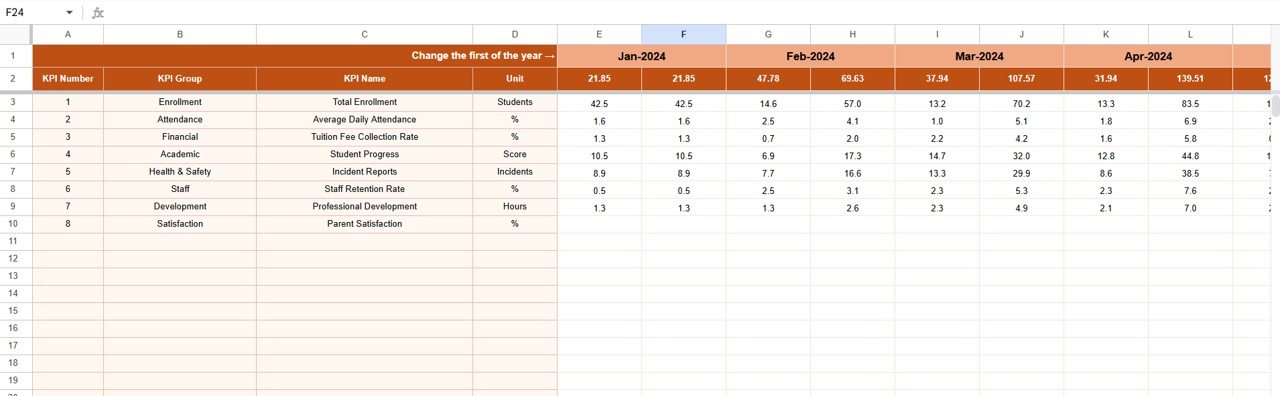
4️⃣ Target Sheet Tab – Define monthly and yearly goals for each KPI; compare instantly with live data.
5️⃣ Previous Year Numbers Sheet – Store historical data to assess growth and improvement over time.
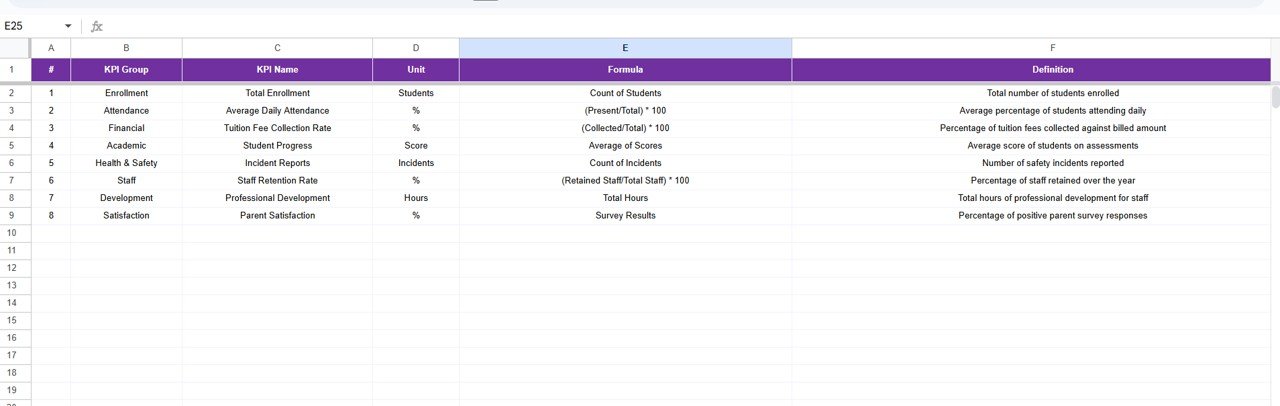
6️⃣ KPI Definition Sheet – Reference section listing KPI Name, Group, Formula, Unit, and Definition for total clarity.
This organized setup ensures every stakeholder — from administrators to teachers — interprets data accurately and consistently.
🧭 How to Use the Preschool KPI Dashboard
1️⃣ Input Data Monthly – Update MTD and YTD numbers for each KPI in the Actual Numbers Sheet.
2️⃣ Set Performance Targets – Use the Target Sheet to define success benchmarks.
3️⃣ Track Monthly Performance – Select a month in the dashboard (cell D3) to view results instantly.
4️⃣ Monitor Trends – Use the Trend Sheet to review progress across months.
5️⃣ Compare with Previous Year – Identify areas of growth or decline using the Previous Year Sheet.
6️⃣ Review & Act – Identify underperforming areas and make timely improvements.
With just a few clicks, you’ll have a full overview of your preschool’s performance — ready to present in meetings or share with staff.
👥 Who Can Benefit from This Preschool KPI Dashboard
🎓 School Owners & Administrators – Get a complete operational overview and strategic decision support.
👩🏫 Teachers & Academic Coordinators – Track teaching efficiency and classroom outcomes.
📊 Finance & Operations Teams – Monitor budgets, expenses, and resource allocation.
👨👩👧 Parent Communication Teams – Strengthen engagement by sharing transparent performance insights.
🏫 Franchise/Group Preschool Networks – Compare branch-wise data for standardization and performance consistency.
No matter your preschool’s size, this dashboard will save you time, ensure accuracy, and promote a data-driven culture.Preschool KPI Dashboard in Google Sheets
📘 Conclusion
The Preschool KPI Dashboard in Google Sheets is a ready-to-use management solution that transforms complex data into simple visuals. With real-time insights, automated calculations, and easy sharing options, it empowers educators to focus on what truly matters — delivering quality early education.Preschool KPI Dashboard in Google Sheets
Use it to monitor, measure, and improve your preschool’s performance — every single month!


Reviews
There are no reviews yet.