
Is your pharmacy running into delays, patient wait times, or inefficient handoffs between stages? The Pharmacy Workflow Bottleneck Analysis Dashboard in Excel is your all-in-one solution to identify, analyze, and eliminate operational bottlenecks. Built for pharmacy managers, team leads, and healthcare administrators, this dashboard turns raw data into actionable insights—helping you streamline workflows and boost performance like never before.
📊 Key Features of the Pharmacy Workflow Bottleneck Analysis Dashboard
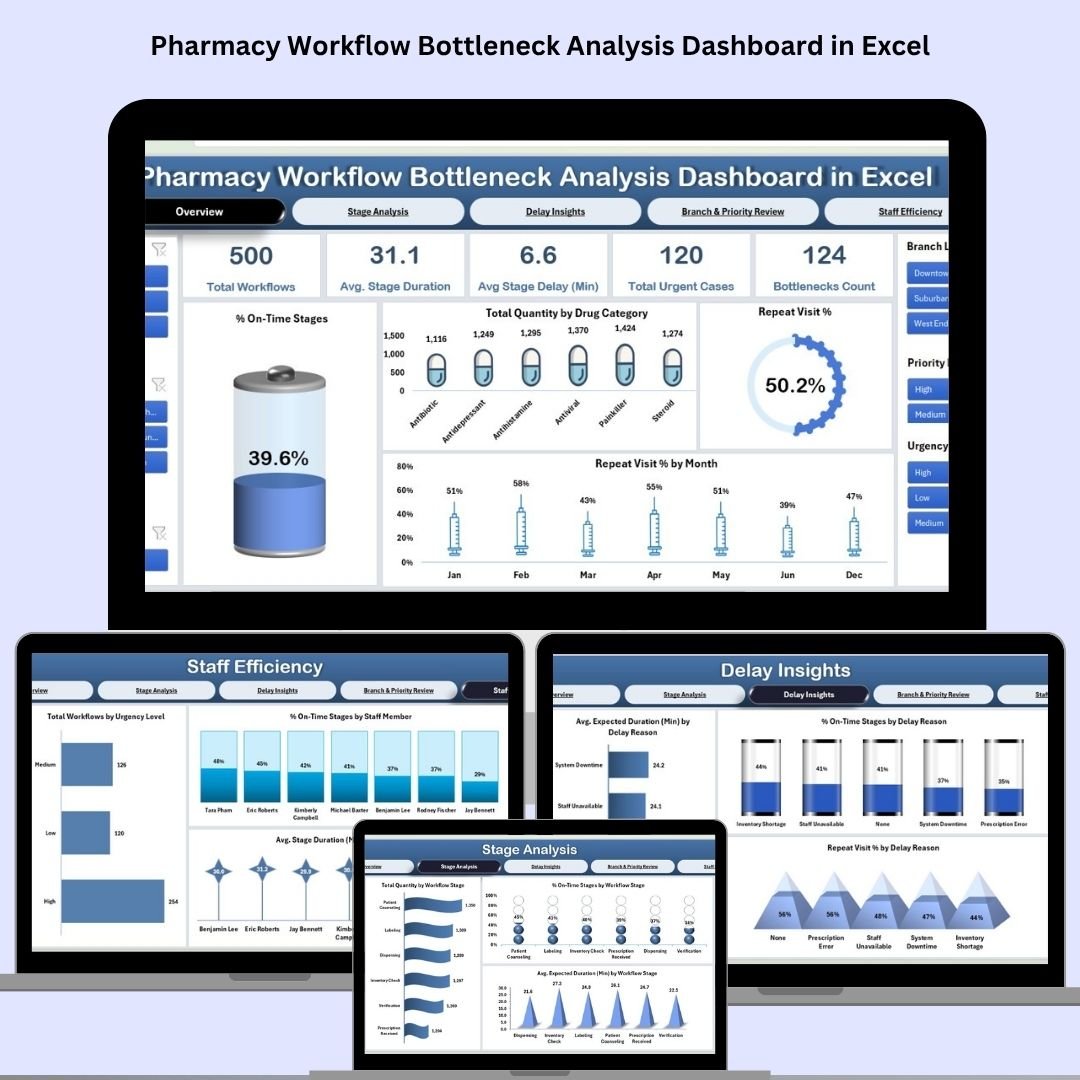
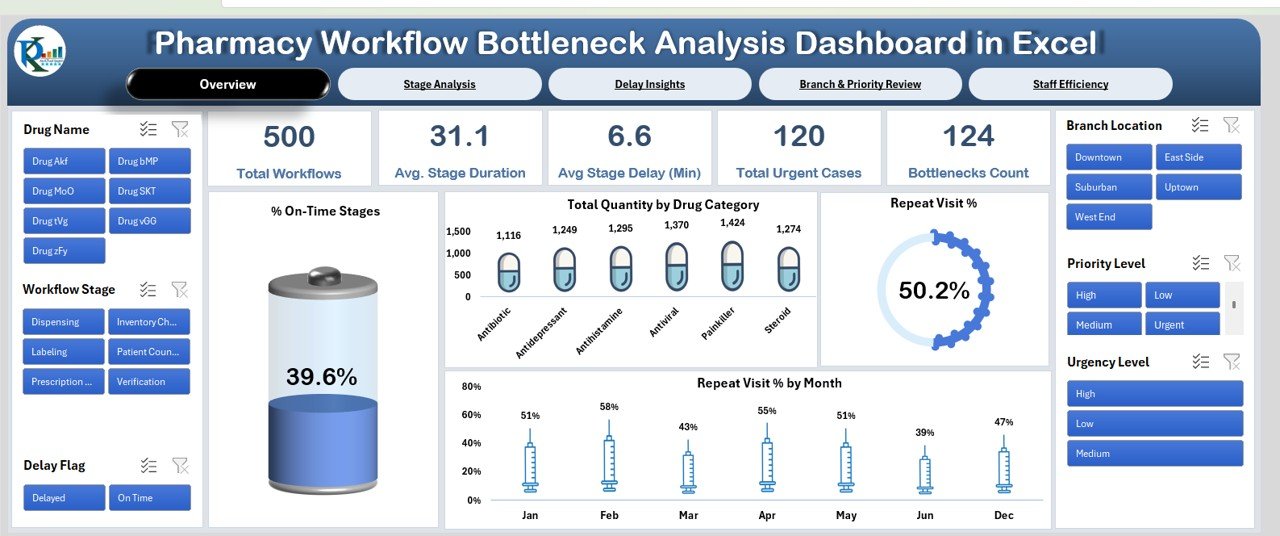
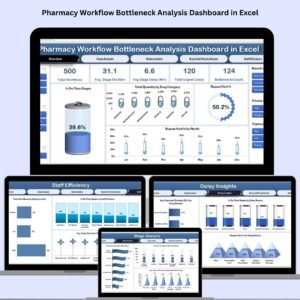
📋 Overview Sheet Tab
Get a high-level summary of your pharmacy operations:
-
🧮 Total Workflows Completed
-
⏱️ Avg. Stage Duration & Delay (Min)
-
🚨 Bottlenecks Count & Urgent Case Volume
-
📈 Visuals for:
-
% On-Time Stages
-
Total Quantity by Drug Category
-
Repeat Visit % & Monthly Trends
-
📍 All metrics dynamically update based on your selected date range or filters.
🔍 What’s Inside the Pharmacy Workflow Dashboard
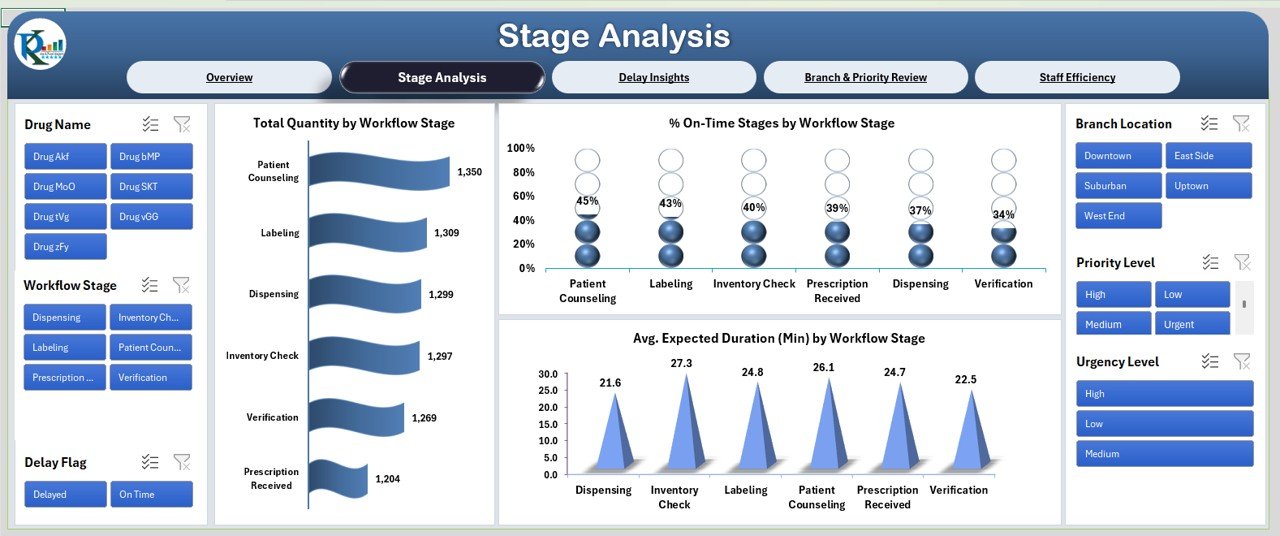
1️⃣ Stage Analysis Sheet Tab
-
Breakdown of workflow by stage
-
See where bottlenecks are happening and why
-
Charts:
-
% On-Time by Stage
-
Total Quantity by Stage
-
Avg. Expected vs Actual Duration
-
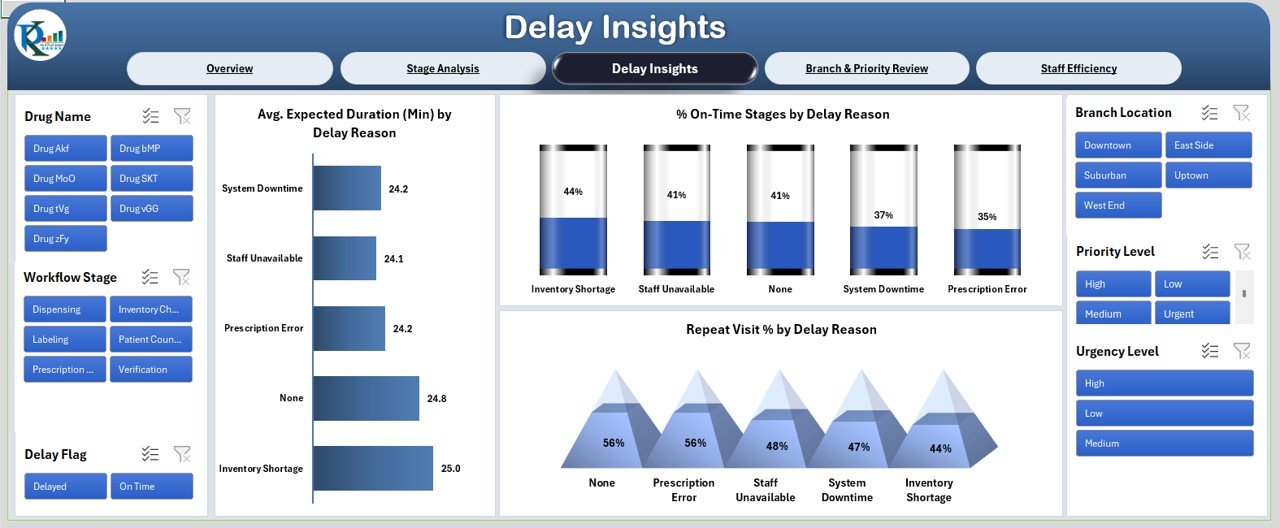
2️⃣ Delay Insights Sheet Tab
-
Analyze delay causes and their impact
-
Charts include:
-
% On-Time by Delay Reason
-
Avg. Duration by Reason
-
Repeat Visit % by Delay Cause
-
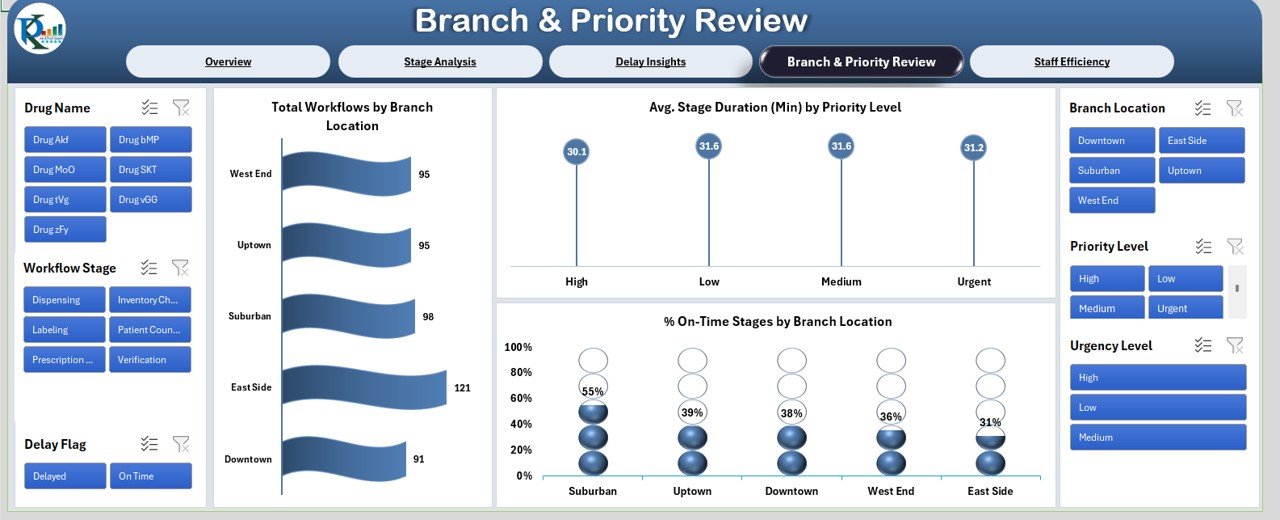
3️⃣ Branch & Priority Review Sheet Tab
-
See performance metrics by branch and urgency level
-
Key charts:
-
Total Workflows by Branch
-
% On-Time by Branch
-
Avg. Duration by Priority Level
-
4️⃣ Staff Efficiency Sheet Tab
-
Review staff-level productivity
-
Charts display:
-
% On-Time by Staff
-
Avg. Stage Duration per Staff
-
Total Workflows by Urgency
-
5️⃣ Data Sheet Tab
The engine behind the dashboard—enter workflow data here. Fields include:
-
Date
-
Workflow Stage
-
Delay Reason
-
Duration
-
Staff Name
-
Branch
-
Priority
-
Urgency
🧠 All other sheets are powered by this data and update automatically—no manual chart editing needed!
🚀 How to Use the Dashboard
📝 Step 1: Input your workflow data into the Data Sheet
📊 Step 2: Navigate to the Overview and other tabs to view insights
⏱️ Step 3: Spot delays and bottlenecks using real-time charts
📍 Step 4: Use filters to drill down by branch, staff, or urgency level
👥 Step 5: Take action—reassign staff, streamline stages, or improve training
Whether your pharmacy handles 50 workflows a day or 500, this dashboard makes complex operations manageable.
👨⚕️ Who Should Use This Dashboard?
🏥 Pharmacy Managers – Eliminate inefficiencies and improve turnaround
👩⚕️ Healthcare Administrators – Track KPIs across locations and shifts
🏬 Multi-Branch Pharmacies – Compare performance across branches
👨🔬 Clinical Workflow Analysts – Gain data-driven insights into daily operations
🧪 Hospital Outpatient Units – Monitor bottlenecks across departments
If you manage pharmacy teams, this dashboard is your operational command center.
💡 Why You’ll Love This Excel Dashboard
✅ 100% Excel—no additional tools or software required
✅ Interactive & Automated—charts update instantly with data
✅ Detailed drill-downs—by branch, delay reason, urgency, or staff
✅ Easy to use—built-in dropdowns and clean formatting
✅ Saves hours on manual reports—automate your insights
✅ Fully customizable—add KPIs or tailor to your own process
Improve efficiency. Reduce wait times. Enhance customer care.
🔁 Click here to read the Detailed blog post
Click here to read the Detailed blog post


Reviews
There are no reviews yet.