


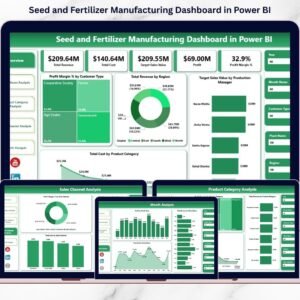
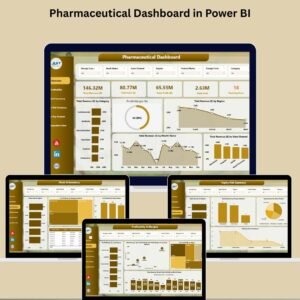
Stay ahead in the competitive healthcare industry with the Pharmaceutical Dashboard in Power BI—your all-in-one analytics hub for tracking sales, profits, inventory, and more. Whether you’re managing pharmaceutical distribution, sales teams, or inventory logistics, this ready-to-use dashboard delivers deep, real-time insights with powerful visuals that drive smart decisions and better outcomes.
From understanding regional revenue breakdowns to preventing inventory expiry, this dashboard does more than display data—it unlocks performance across your entire pharmaceutical supply chain.

✨ Key Features of the Pharmaceutical Dashboard in Power BI
📊 Dashboard Sheet Tab – Get a Quick Financial Snapshot
Instantly monitor key metrics:
-
💰 Total Revenue and Total Profit
-
📦 Units Sold
-
🧾 Total Cost
-
📈 Profit Margin (%)
All shown as bold KPI cards to help you assess your business at a glance.
🌍 Overview Page – Dive Deep into Sales Analysis
Analyze performance by:
-
🧪 Category (e.g., pain relief, vaccines)
-
🌐 Region (North, South, East, West)
-
📅 Month (trend view)
-
🏥 Sales Channel (hospital, distributor, pharmacy)
Spot seasonal spikes, identify high-performing areas, and optimize distribution strategies.
💹 Profitability & Margins – Compare Sales Channels & Regions
Track revenue, profit, and margin:
-
🔬 By Category
-
🧭 By Region
-
📦 By Sales Channel
-
📆 By Month
Visually see where you’re making the most—and least—money.
🧪 Stock & Inventory Page – Monitor Expiry and Stock Levels
Real-time insights into:
-
📦 Units Sold by Region
-
❄️ Storage Condition Overview
-
⛔ Out-of-stock vs. In-stock items
-
⌛ Expiry Risk Alerts by Region, Condition, Channel & Category
Avoid waste, improve shelf-life visibility, and streamline reordering.
🧑💼 Sales Rep Analysis – Empower High Performers
Track the Top 7 Sales Reps by:
-
💵 Total Profit
-
💰 Total Revenue
-
🧮 Units Sold
Recognize your sales heroes and replicate their success across teams.
🔍 Decomposition View – Break Down the “Why”
Drill deeper into KPIs and uncover the drivers of success—or failure. With interactive decomposition trees, you’ll know exactly what’s moving the needle.
📦 What’s Inside the Pharmaceutical Dashboard in Power BI
-
3 Interactive Pages: Dashboard, Overview, Profit & Inventory Insights
-
Advanced Visuals: Bar charts, line graphs, KPI cards, donut charts
-
Filters: Region, Category, Channel, Month—analyze your way
-
Fully Customizable: Add your own metrics, adjust layouts, or create new visuals
🛠️ How to Use the Pharmaceutical Dashboard
-
🧾 Connect your Excel data to the dashboard
-
🎯 Use slicers to drill into categories, channels, and regions
-
📊 Track KPIs in real-time
-
📉 Explore charts to uncover trends and gaps
-
🔄 Update monthly for consistent performance monitoring
👥 Who Can Benefit from This Dashboard?
-
💼 Pharmaceutical Business Owners
-
🧑🔬 Sales & Marketing Managers
-
🏥 Hospital & Clinic Admins
-
📦 Inventory Managers
-
🧮 Finance Analysts
-
👨💻 Data & BI Teams in Pharma Sector


Reviews
There are no reviews yet.