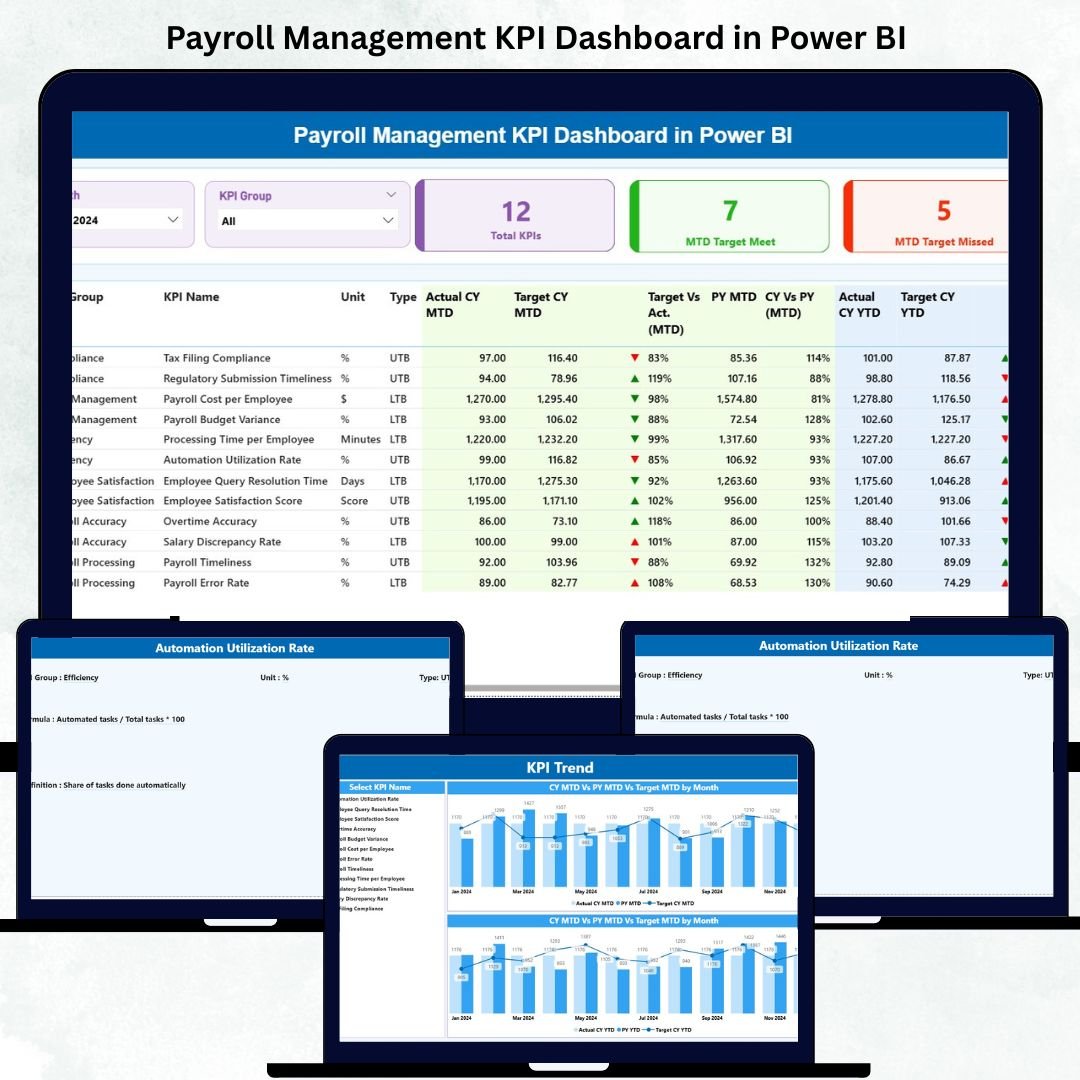
Payroll is one of the most critical functions in any organization — where precision, timeliness, and compliance define operational success. Managing payroll through spreadsheets often leads to inefficiencies, errors, and delays. The Payroll Management KPI Dashboard in Power BI solves this problem with a smart, data-driven approach that turns payroll data into real-time insights.
This ready-to-use interactive dashboard empowers HR and finance professionals to analyze payroll KPIs, monitor compliance, and streamline salary disbursement — all in one visual platform. Built entirely in Microsoft Power BI, it combines automation, transparency, and powerful analytics for better control over payroll operations.
Whether you’re an HR manager, finance executive, or payroll specialist, this dashboard helps you track efficiency, detect errors early, and ensure that every paycheck is accurate, on time, and compliant.
⚙️ Key Features of the Payroll Management KPI Dashboard in Power BI
📊 Three Interactive Pages: Summary Dashboard, KPI Trend, and KPI Definition.
💡 Excel Data Integration: Automatically pulls from Excel Actual, Target, and Definition sheets.
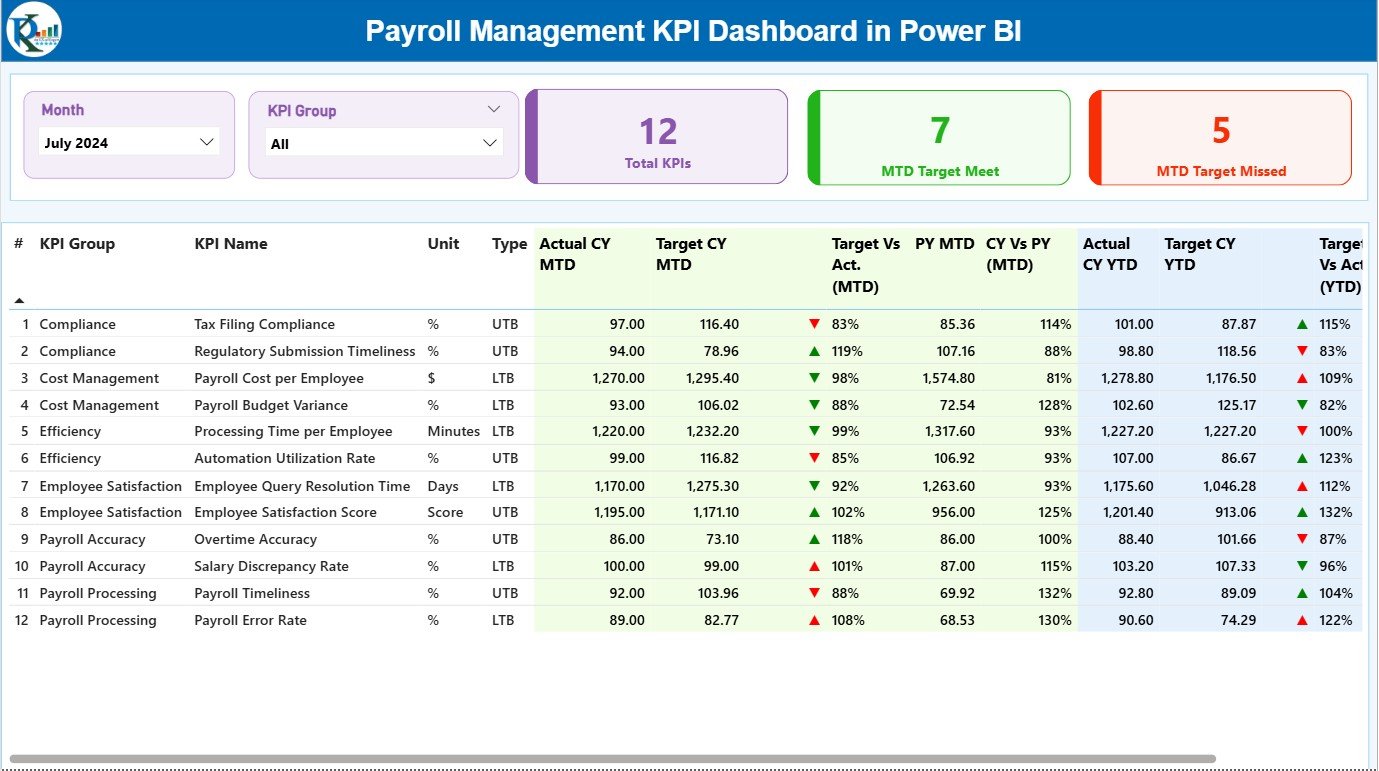
📅 Month & KPI Group Slicers: Quickly filter data for focused analysis.
🎯 Actual vs Target vs Previous Year (PY): Compare monthly and yearly payroll performance.
🟢🟡🔴 Visual Indicators: Green = On Target | Yellow = Near Target | Red = Below Target.
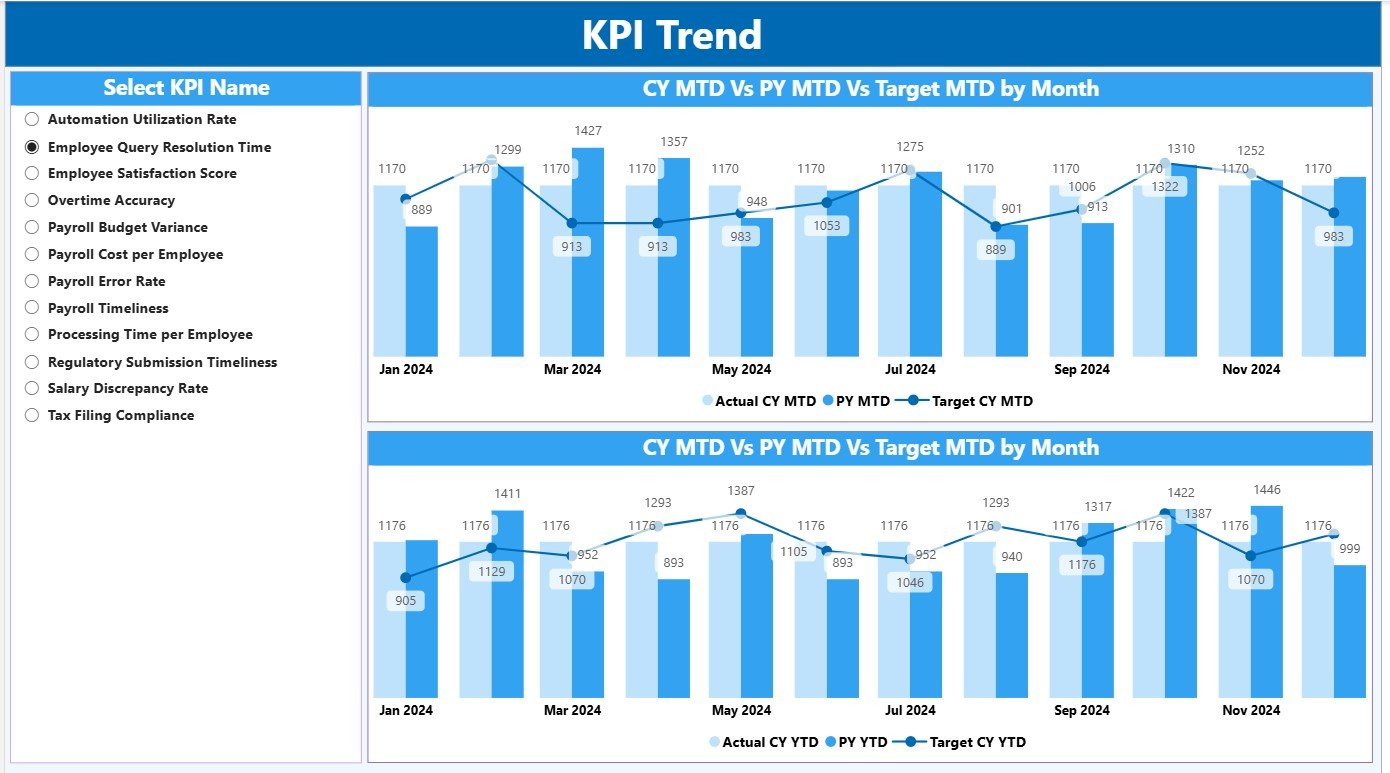
📈 Trend Charts: Track payroll accuracy, disbursement speed, and cost efficiency over time.
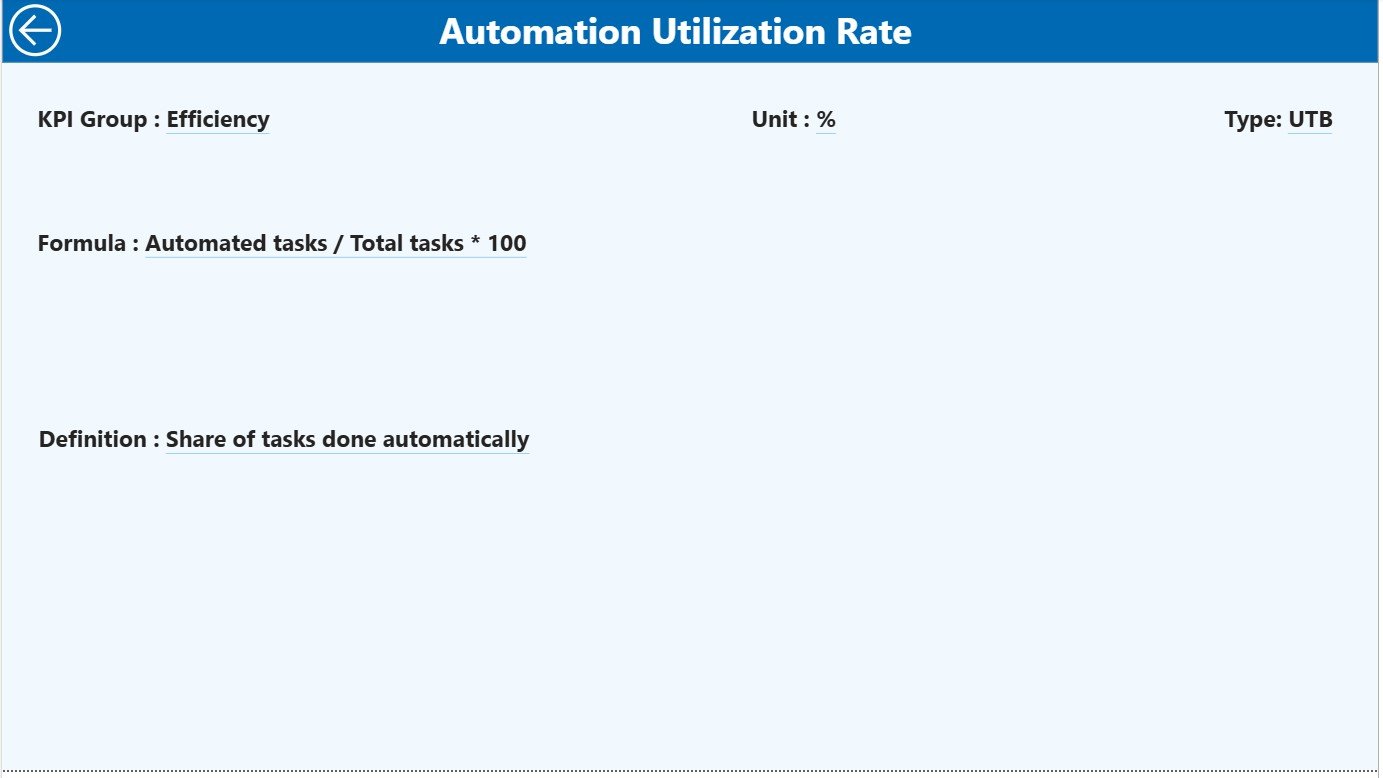
🔍 Drill-Through Feature: View detailed KPI formulas and definitions directly within Power BI.
✅ Real-Time Refresh: Update visuals instantly with the “Refresh” button.
💻 Cloud Ready: Publish to Power BI Service for secure sharing and collaboration.
📊 Dashboard Structure Overview
🧭 1️⃣ Summary Page – Payroll Performance at a Glance
Your command center for all payroll analytics.
-
View MTD (Month-to-Date) and YTD (Year-to-Date) KPI performance.
-
Cards display Total KPIs Count, MTD Target Met, and Target Missed Count.
-
Charts show accuracy rates, processing times, and cost efficiency.
💡 Purpose: Get a complete payroll health summary in one visual view.
📈 2️⃣ KPI Trend Page – Track Payroll Trends Over Time
Dive deeper into payroll performance with dynamic visuals.
-
Combo charts show Actual, Target, and Previous Year performance.
-
Interactive KPI selector updates all visuals in real time.
-
Color-coded charts reveal rising or declining trends in key payroll areas.
📊 Purpose: Identify process improvements and track long-term accuracy.
📘 3️⃣ KPI Definition Page – Drill-Through Transparency
Understand how each KPI is calculated.
-
Shows Formula, Unit, Definition, and Type (LTB or UTB).
-
Access directly from the Summary Page via right-click drill-through.
-
Return easily with the “Back” navigation button.
📖 Purpose: Maintain KPI clarity, accuracy, and accountability.
💾 Excel Data Source Structure
🧾 Input_Actual Sheet:
-
Records Actual KPI values by month.
-
Columns: KPI Name, Month, MTD, and YTD.
🎯 Input_Target Sheet:
-
Stores MTD and YTD targets for each KPI.
-
Aligned structure ensures seamless comparison.
📋 KPI Definition Sheet:
-
Defines KPI Name, Group, Unit, Formula, and Definition.
-
Specifies performance direction (Lower or Upper the Better).
📎 Purpose: Acts as the data backbone for the Power BI visuals — simple, organized, and easy to update.
🌟 Advantages of Using the Payroll Management Dashboard
✅ Centralized Payroll Monitoring – All key KPIs consolidated into one dashboard.
✅ Real-Time Analytics – Instantly identify discrepancies or delays.
✅ Automation & Accuracy – No manual report creation or spreadsheet errors.
✅ Transparent KPI Tracking – Clearly defined metrics for compliance and reporting.
✅ Data-Driven Decisions – Analyze cost efficiency and operational performance.
✅ Scalable Design – Works for startups, SMEs, and large enterprises alike.
✅ Professional Reporting Tool – Perfect for HR reviews and management dashboards.
💡 Best Practices for Effective Use
📌 Update Actual and Target data monthly.
📌 Use consistent data formats in Excel (dates, decimals, text).
📌 Regularly review MTD and YTD metrics.
📌 Validate KPI definitions to ensure accuracy.
📌 Back up Excel data before each refresh cycle.
📌 Use drill-throughs for transparent discussions during audits.
📌 Leverage Power BI Gateway for automated data refresh.
👥 Who Can Benefit from This Dashboard
👩💼 HR Managers – Monitor payroll accuracy and efficiency.
👨💼 Finance Controllers – Analyze payroll costs and budget impact.
📊 Business Analysts – Track trends and improve processing timelines.
🏢 Operations Heads – Ensure compliance and timely disbursements.
🔍 Auditors – Review payroll accuracy and validation metrics.
🧩 Conclusion
The Payroll Management KPI Dashboard in Power BI isn’t just a visualization tool — it’s a strategic command center for payroll optimization. By consolidating all payroll KPIs into one platform, it enhances accuracy, improves compliance, and empowers leaders to make informed decisions backed by real data.
With this dashboard, organizations can streamline salary processing, detect anomalies instantly, and maintain complete transparency in payroll operations.
💰 Simplify payroll. Visualize efficiency. Empower data-driven HR decisions.
🔗 Click Here to Read the Detailed Blog Post
📺 Visit our YouTube Channel for step-by-step tutorials.


Reviews
There are no reviews yet.