
In today’s fast-paced business environment, maximizing productivity while minimizing wasted time is a top priority for every organization. But without the right tracking system, managing workflow efficiency becomes a guessing game—leading to missed deadlines, bottlenecks, and uneven workloads.
The Office Workflow Efficiency Report in Excel is a ready-to-use, interactive template that helps teams monitor task completion rates, evaluate workloads, and identify process inefficiencies. Whether you’re a manager overseeing multiple departments or an employee striving to meet deadlines, this report provides data-driven insights to keep projects on track and resources well-utilized.
✨ Key Features of the Office Workflow Efficiency Report
✅ Three Main Reporting Sheets – Summary, Report, and Data for easy navigation and analysis.
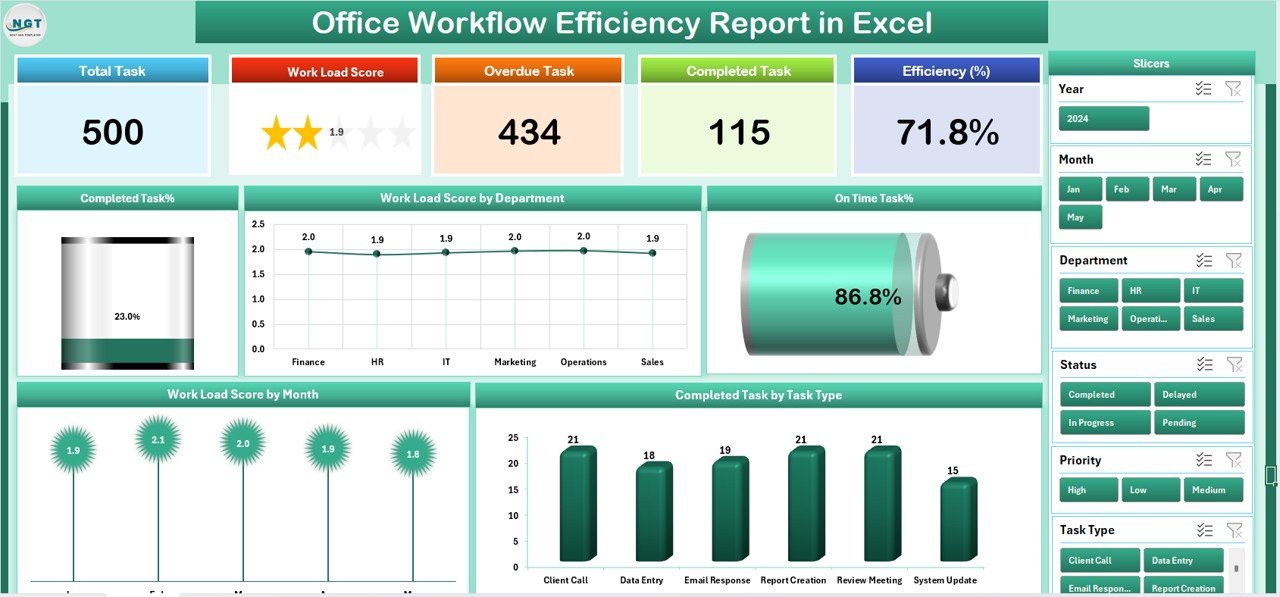
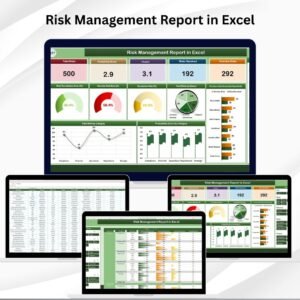
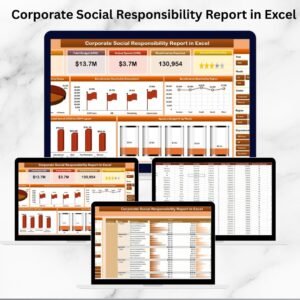
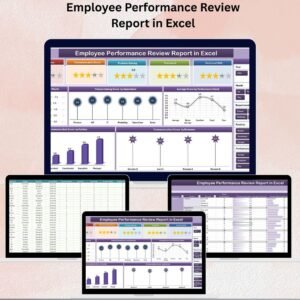
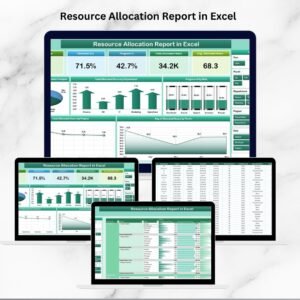
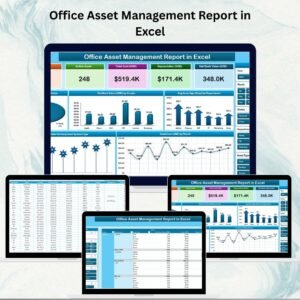
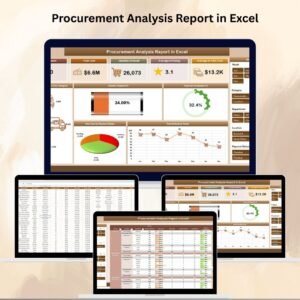
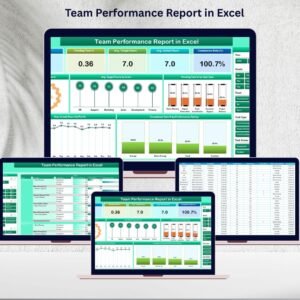
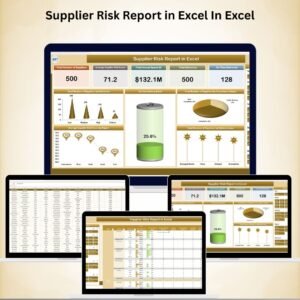
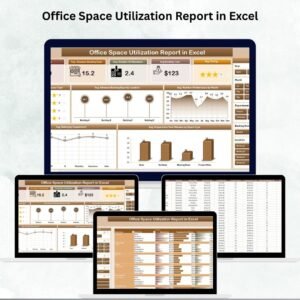
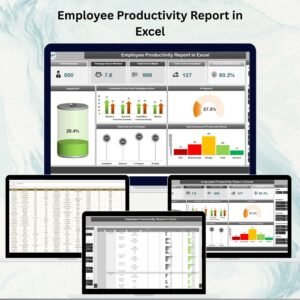
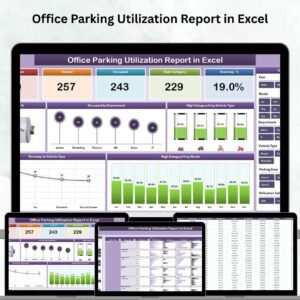
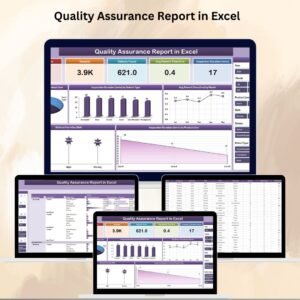
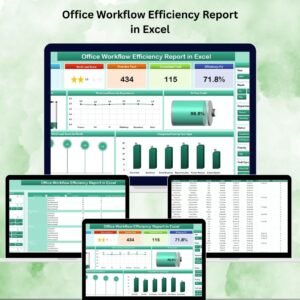
✅ Interactive Dashboard – Summary Page with KPI cards, slicers, and charts for instant insights.
✅ Performance Tracking Metrics – Completed Task %, On-Time Task %, Workload Score by Department & Month, and Task Type Analysis.
✅ Department & Time Filters – Quickly drill down into specific data segments with slicers.
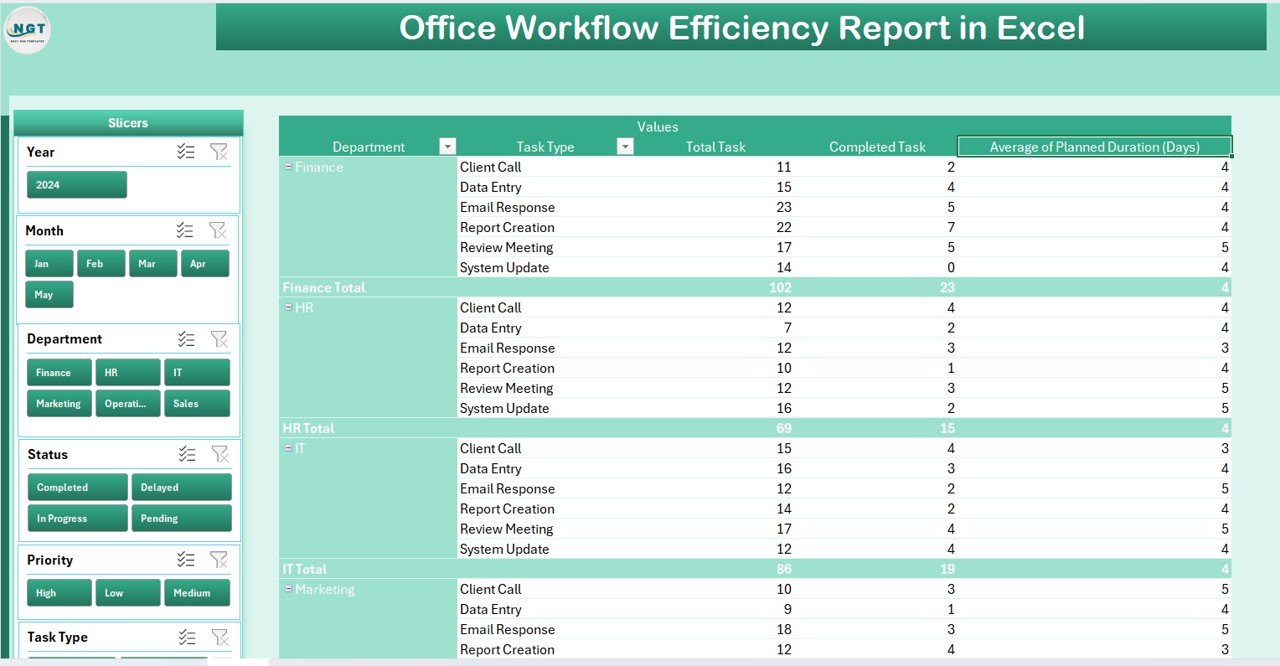
✅ Detailed Report Page – Table view with task details, assigned personnel, completion status, and timeliness indicators.
✅ Data Storage & Updates – Raw Data Sheet for easy data entry and updates.
✅ Customizable Setup – Modify slicers, metrics, and charts to suit your organization’s needs.
📂 What’s Inside the Office Workflow Efficiency Report
-
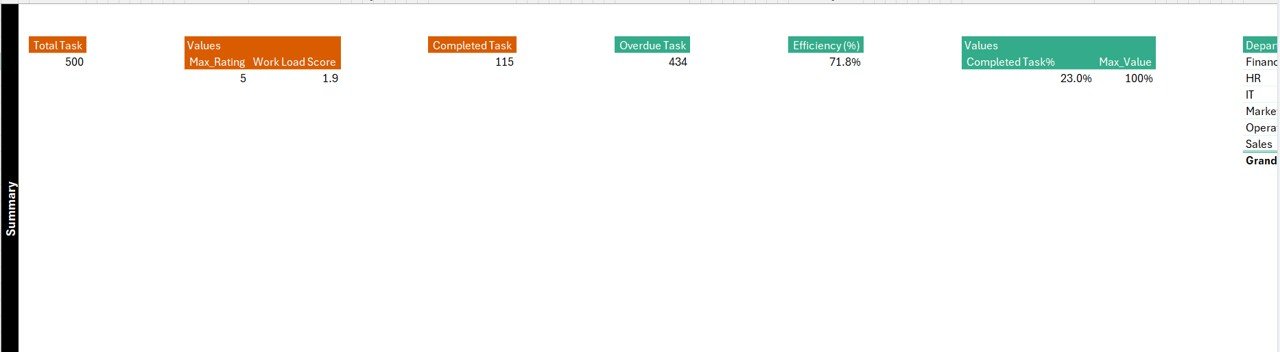
Summary Page – Your main dashboard with five KPI cards and multiple charts for quick performance reviews.
-
Report Page – In-depth data table filtered by department, task type, or time period for granular analysis.
-
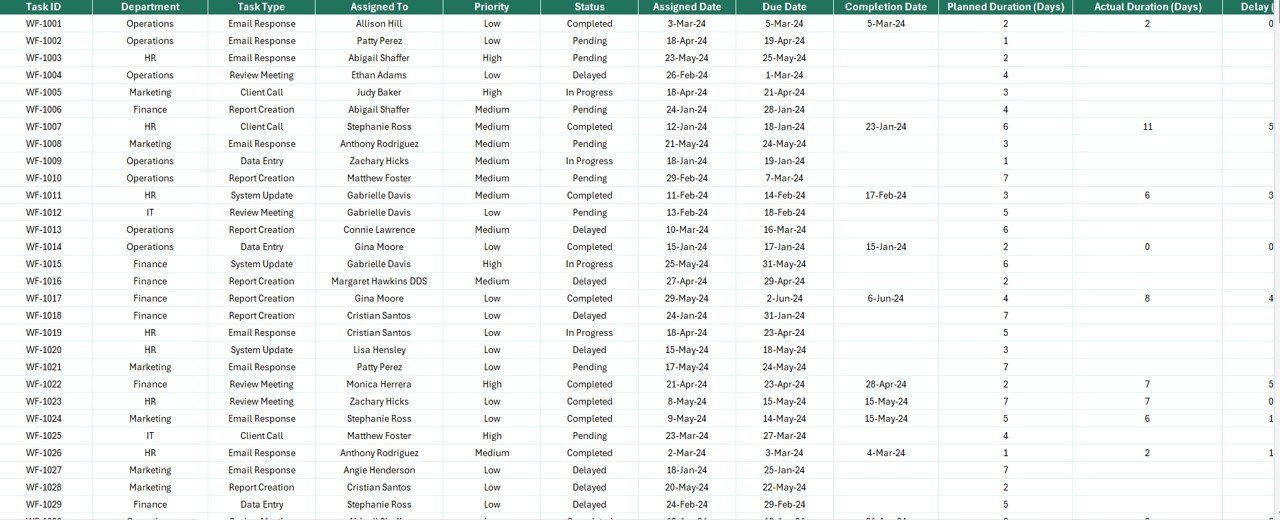
Data Sheet – Stores raw task data that powers the entire report. Add or import new records easily.
-
Support Sheet – Houses dropdown values, reference lists, and slicer configurations for smooth operation.
🛠 How to Use the Office Workflow Efficiency Report
-
Collect Task Data – Gather details like task name, department, start/end dates, assigned person, status, and type.
-
Enter Data – Input all collected information into the Data Sheet.
-
View Summary Insights – Check KPI cards and charts to monitor department performance and task completion rates.
-
Drill Down in Report Page – Use slicers to analyze specific departments or project timeframes.
-
Take Action – Identify underperforming areas and adjust resources or timelines as needed.
🎯 Who Can Benefit from This Report
🏢 Corporate Offices – Monitor and improve team productivity.
📅 Project Managers – Track milestones and ensure deliverables are on time.
📞 Customer Support Teams – Manage service request workflows effectively.
🧑💼 HR Departments – Oversee recruitment, onboarding, and training tasks.
📈 Operations Managers – Optimize workload distribution across departments.
🚀 Why Choose This Workflow Report?
-
Centralized Data – All task-related performance data in one file.
-
Real-Time Analysis – Automatic chart updates when data changes.
-
Better Resource Allocation – Identify workload imbalances instantly.
-
Improved Decision-Making – Data-driven insights for productivity improvements.
-
Reduced Errors – Standardized data entry formats minimize mistakes.


Reviews
There are no reviews yet.