
Managing office issues effectively is essential for ensuring smooth operations, employee satisfaction, and overall organizational efficiency. Without a structured system, issues can pile up, response times get delayed, and employees feel unheard. That’s why we created the Office Issues Management Dashboard in Excel—a ready-to-use solution that centralizes issue tracking, provides instant visibility, and supports data-driven decision-making. ✅
This dashboard is designed for HR teams, operations managers, and office administrators who want a simple yet powerful way to monitor and resolve issues across departments, channels, and locations. With multiple interactive sheets, visual charts, and summary cards, you’ll always stay on top of what matters most: timely resolutions and happier employees.
✨ Key Features of the Dashboard
-
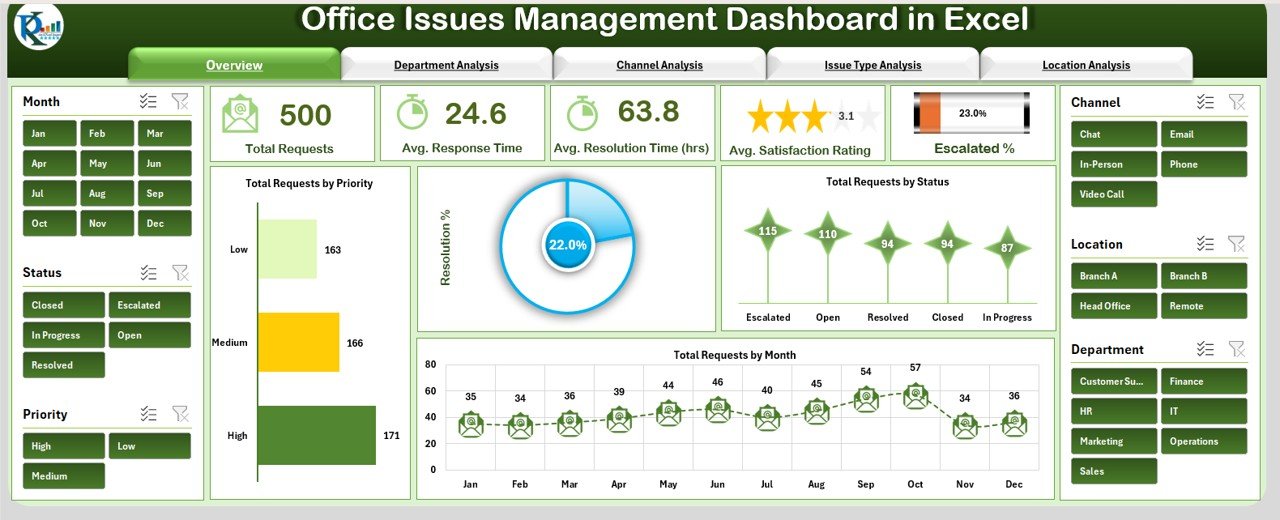
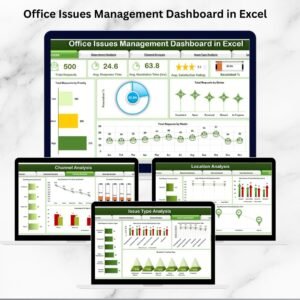
📊 Overview Dashboard – View total requests, average response and resolution times, employee satisfaction, and escalation percentage in one glance.
-
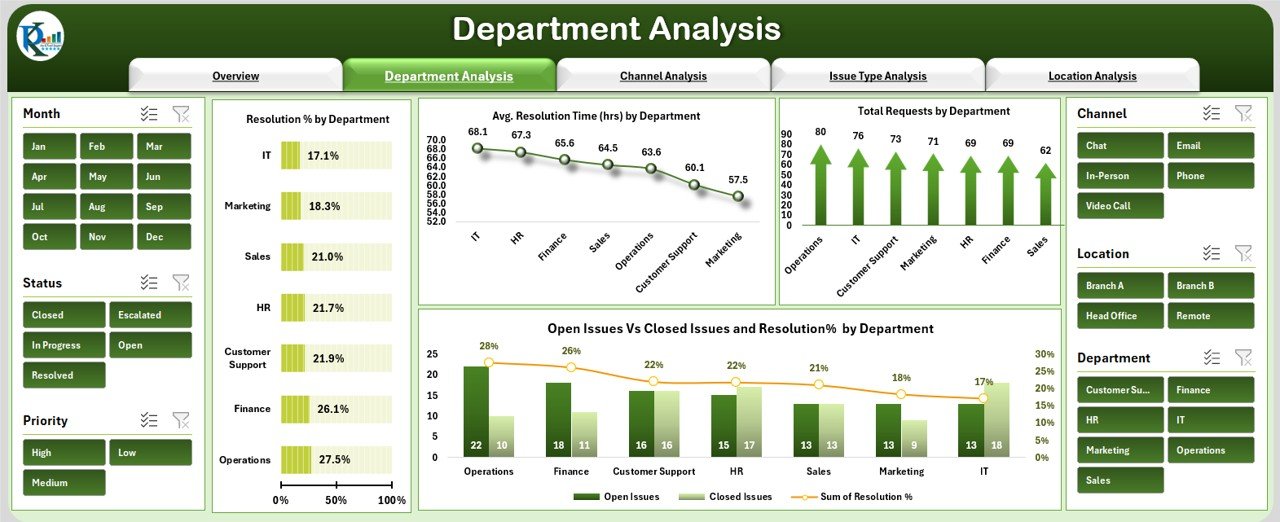
🏢 Department Analysis – Measure performance across departments with resolution rates, workload distribution, and open vs closed issues.
-
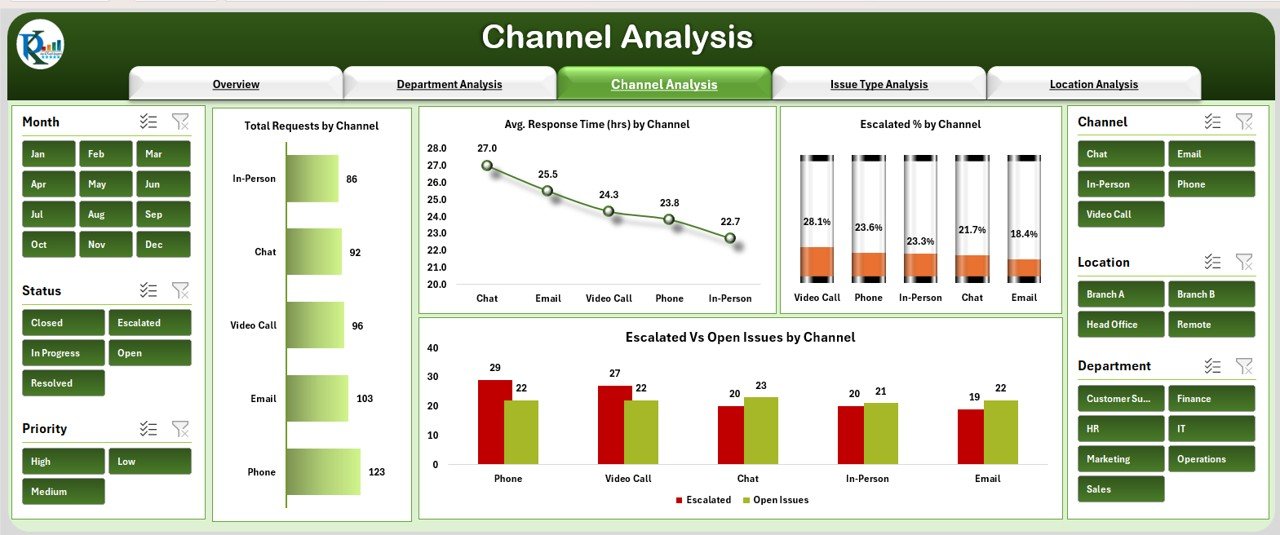
📞 Channel Analysis – Track which reporting channels (email, portal, phone, etc.) are most effective and where delays occur.
-
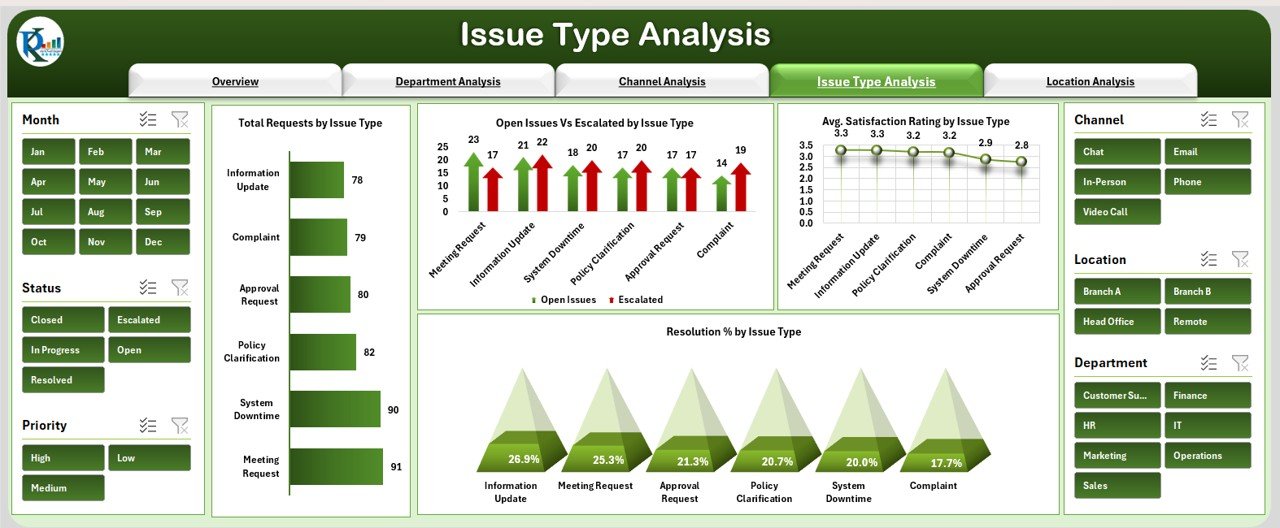
📂 Issue Type Breakdown – Identify recurring issue categories, their satisfaction ratings, and escalation trends.
-
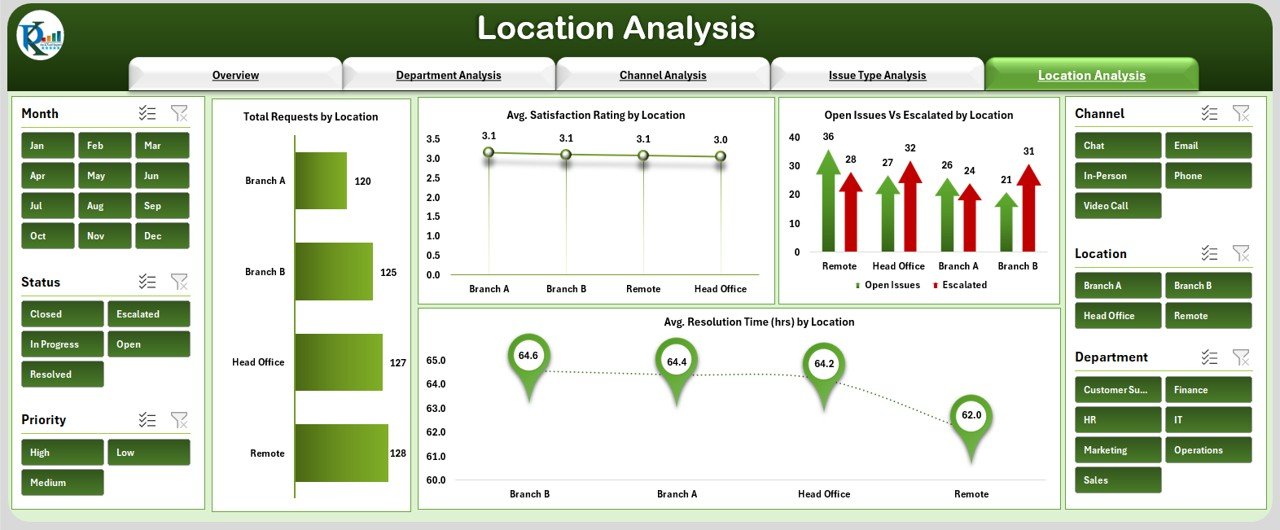
🌍 Location Insights – Compare performance by office branch or location, including satisfaction ratings and resolution times.
-
🔄 Automated Updates – Input data once in the Data Sheet, and all dashboards update instantly.
-
🔒 Structured & Accurate – Ensures reliable reporting with consistent fields for priority, status, channel, department, and more.
-
🛠 Customizable – Easily modify fields, categories, or visuals to fit your office setup.
📂 What’s Inside the Dashboard
The template comes with six dedicated sheet tabs:
-
Overview Sheet Tab – High-level cards and charts for quick insights into office issues.
-
Department Analysis Sheet – Drill down into department-specific performance.
-
Channel Analysis Sheet – Track efficiency of reporting channels.
-
Issue Type Analysis Sheet – Monitor issue categories and recurring trends.
-
Location Analysis Sheet – View issue distribution and satisfaction by location.
-
Data Sheet Tab – A structured input table for all issue records, powering every chart.
This structured design ensures both simplicity and depth—perfect for both daily use and executive reporting.
🛠 How to Use the Dashboard
-
Record office issue details in the Data Sheet with fields like priority, department, channel, and status.
-
Review the Overview Dashboard for a quick summary of performance and satisfaction levels.
-
Use Department, Channel, and Issue Type Analysis tabs to identify bottlenecks and recurring problems.
-
Leverage the Location Analysis tab to monitor performance across branches.
-
Update the data regularly to ensure accurate reporting and informed decision-making.
👥 Who Can Benefit from This Dashboard?
-
HR Teams – Track employee satisfaction with issue resolutions.
-
Operations Managers – Monitor bottlenecks across departments and channels.
-
Office Admins – Ensure smoother day-to-day issue handling.
-
Business Leaders – Gain high-level insights into office challenges.
-
Large Organizations – Handle multiple departments, channels, and locations with ease.
✅ Why Choose This Template?
-
Save hours of manual reporting with automated dashboards
-
Spot recurring problems before they escalate
-
Boost employee confidence with timely resolutions
-
Support data-driven resource allocation and planning
-
Ensure accountability across departments and locations
-
Designed to be plug-and-play—no coding or macros required
🔗 Click here to read the Detailed Blog Post
Watch the step-by-step video Demo:


Reviews
There are no reviews yet.