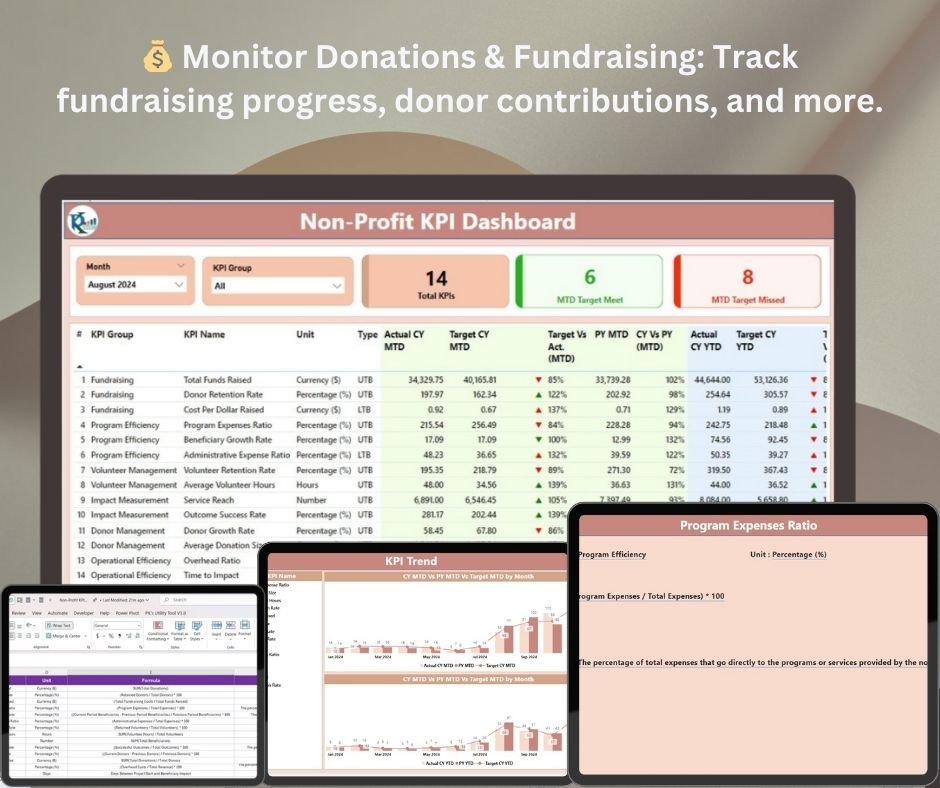


The Non-Profit KPI Dashboard in Power BI is an essential tool designed for non-profit organizations looking to track and optimize their performance across various key metrics. This powerful Power BI dashboard allows you to monitor KPIs such as donation tracking, fundraising progress, volunteer engagement, program effectiveness, and financial performance. With real-time data monitoring, this dashboard helps you ensure that your non-profit is on track to meet its goals, optimize its resources, and achieve its mission.
Whether you’re managing a small community charity, a global NGO, or any other non-profit entity, the Non-Profit KPI Dashboard in Power BI provides an intuitive and interactive solution for managing and visualizing performance data. With its detailed reporting and dynamic visualizations, you can make data-driven decisions that improve operational efficiency, fundraising strategies, and overall program impact.
Key Features of the Non-Profit KPI Dashboard in Power BI
💰 Donation & Fundraising Tracking
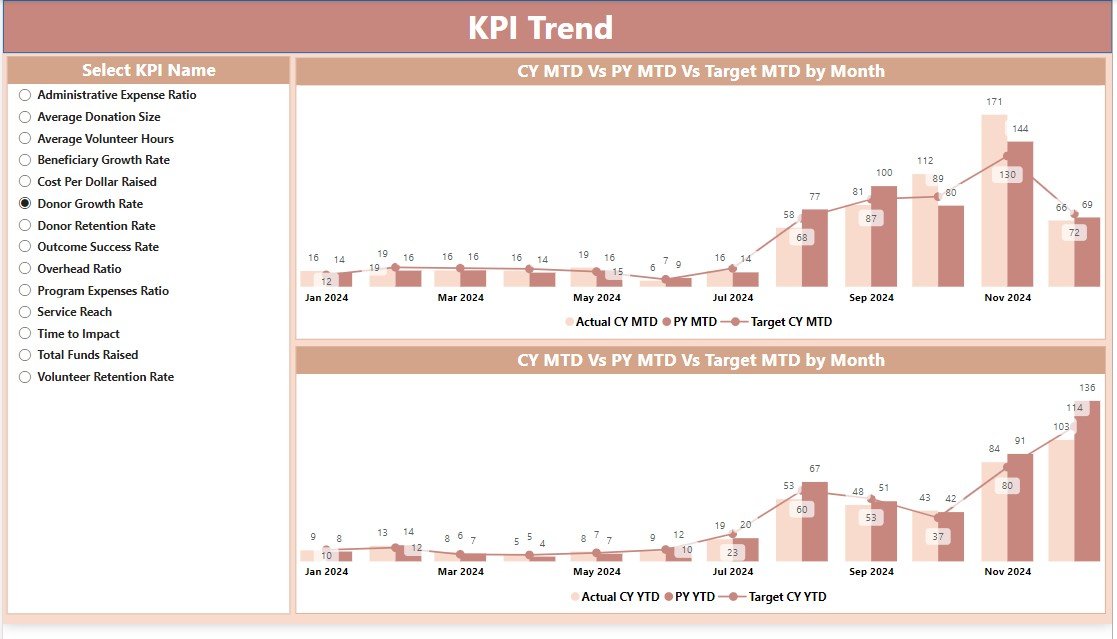
Track donations, fundraising progress, and donor contributions in real-time. Visualize trends, compare year-over-year fundraising data, and ensure that your fundraising efforts are on target.
⚡ Volunteer & Engagement Monitoring
Monitor volunteer participation and engagement with your organization’s initiatives. Track volunteer hours, activities, and engagement to maximize the impact of your volunteer programs.
📈 Program Effectiveness Insights
Evaluate the effectiveness of various programs and projects within your organization. Track key metrics such as program participation, outcomes, and success rates to measure impact.
📅 Financial & Budget Management
Monitor financial performance, including revenue, expenses, and budget adherence. Track spending and revenue to ensure your organization is operating efficiently and within budget.
🖥️ Interactive & User-Friendly Interface
The Power BI dashboard provides an easy-to-navigate, interactive interface that allows you to explore key data points, drill down into specific details, and gain actionable insights.
Why You’ll Love the Non-Profit KPI Dashboard in Power BI

✅ Track Key Metrics in Real-Time
Monitor all important KPIs in real time, including donations, volunteer hours, program effectiveness, and financial performance, to ensure your non-profit is on track to meet its goals.
✅ Optimize Fundraising Efforts
Evaluate fundraising campaigns and donor contributions to ensure that your fundraising goals are being met. Identify trends and adjust your strategies accordingly to increase donor engagement.
✅ Measure Program Impact & Effectiveness
Track and evaluate the impact of your organization’s programs. Use insights from the dashboard to improve programs and maximize their effectiveness in the community.
✅ Improve Volunteer Engagement
Monitor volunteer participation and track volunteer hours to ensure that your organization has the resources needed to carry out its mission effectively.
✅ Simplify Financial & Budget Monitoring
Track your financial health with ease. Monitor revenue, expenses, and budget performance to ensure that your non-profit is running efficiently and transparently.
What’s Inside the Non-Profit KPI Dashboard Template?
- Donation & Fundraising Tracking: Track and analyze donations, fundraising progress, and donor contributions.
- Volunteer Engagement & Participation: Monitor volunteer hours, engagement levels, and program impact.
- Program Effectiveness: Measure program outcomes, participation rates, and success metrics to ensure effectiveness.
- Financial & Budget Performance: Track revenue, expenses, and overall financial health of your non-profit.
- Real-Time Data Insights: Get real-time updates on key KPIs to drive decision-making.
- Customizable KPIs: Adjust the dashboard to track the specific metrics most important to your non-profit’s success.
How to Use the Non-Profit KPI Dashboard in Power BI
1️⃣ Download the Template: Access your Non-Profit KPI Dashboard in Power BI.
2️⃣ Input Your Data: Enter donation, volunteer, program, and financial data into the dashboard.
3️⃣ Track & Monitor KPIs: Use the dashboard to monitor donations, volunteer participation, program success, and financial health.
4️⃣ Analyze & Optimize: Use insights from the dashboard to adjust strategies, improve fundraising efforts, and increase program impact.
Who Can Benefit from the Non-Profit KPI Dashboard in Power BI?
🔹 Non-Profit Managers & Executives
🔹 Fundraising Teams & Donor Managers
🔹 Volunteer Coordinators & Engagement Managers
🔹 Program Managers & Impact Analysts
🔹 Financial Officers & Budget Managers in Non-Profits
🔹 Anyone Seeking to Improve Non-Profit Operations & Performance
Track, analyze, and optimize the performance of your non-profit with the Non-Profit KPI Dashboard in Power BI. Monitor donations, program effectiveness, volunteer engagement, and financial health to ensure your non-profit is making the greatest impact.
Click here to read the Detailed blog post
Visit our YouTube channel to learn step-by-step video tutorials
Youtube.com/@PKAnExcelExpert


Reviews
There are no reviews yet.