



The Multicolor Filling Bars in Excel Cells Without Using Chart template is a visually engaging and easy-to-use tool designed to bring color-coded, dynamic progress bars into your Excel sheets. This template allows you to represent data visually within cells without using traditional charts, giving you a cleaner and more customized presentation of your data.
Perfect for tracking KPIs, sales goals, project milestones, or any other performance metrics, these colorful filling bars offer a quick way to monitor progress, spot trends, and highlight areas that need attention. The multicolor bars are fully customizable and can be adjusted based on your data, making them a versatile tool for personal or business use.

Key Features of the Multicolor Filling Bars in Excel Cells Without Using Chart
📌 Color-Coded Progress Bars
The filling bars automatically change color based on data values, providing an immediate visual representation of progress. Use different colors to highlight various stages, from low performance to high achievement.
🛠 No Chart Required
Unlike traditional charts, these filling bars are inserted directly into cells using conditional formatting. This keeps your Excel sheets clean and simple, without the need for separate chart areas or space-consuming visualizations.
💡 Customizable Color Ranges
You can easily set up different color schemes to reflect your data needs. Whether you want to use red for low values, yellow for moderate, and green for high values, or set up any color pattern that works for your goals, the bars can be customized to suit your preferences.
🔢 Real-Time Data Updates
As the data changes, the filling bars automatically adjust in real-time, ensuring that your progress is always up to date. This feature helps you track performance as it evolves without manually changing the chart.
🚀 Clean and Compact Layout
The bars are integrated into the cells, so you don’t need to allocate extra space for charts. This feature ensures a tidy, space-efficient layout in your worksheet, helping you stay organized.
📊 Easy Performance Monitoring
Quickly assess the status of your goals or KPIs with the help of visual indicators. The filling bars provide an instant understanding of where you stand in terms of progress, allowing you to make timely decisions.
⚙ Simple Setup and Customization
Setting up the multicolor filling bars is simple, even for those with basic Excel skills. With a few clicks, you can apply conditional formatting and customize the visual design to suit your needs.
🚀 Why You’ll Love the Multicolor Filling Bars in Excel Cells Without Using Chart
✅ Instant Visual Progress Tracking – Monitor your data progress at a glance with color-coded filling bars. ✅ Customizable Color Schemes – Adjust the colors to match your specific performance metrics. ✅ No Need for Charts – Keep your sheets neat and organized without the clutter of charts. ✅ Real-Time Updates – See the bars update automatically as you change the data. ✅ Simple Setup – Quick to set up, with easy-to-follow instructions.
📂 What’s Inside the Multicolor Filling Bars in Excel Cells Without Using Chart?
- Color-Coded Bars: Visually represent your data within Excel cells without using charts.
- Customizable Ranges: Tailor the color scheme to reflect your specific goals or metrics.
- Real-Time Data Updates: The bars automatically adjust based on the changes in your data.
- Clear Setup Instructions: Simple steps to get the filling bars up and running in your spreadsheet.
🔍 How to Use the Multicolor Filling Bars in Excel Cells Without Using Chart
1️⃣ Download the Template – Instant access to the Excel file upon purchase. 2️⃣ Enter Your Data – Input your values, and the filling bars will adjust automatically. 3️⃣ Customize the Colors – Adjust the color scheme for each progress level (low, medium, high). 4️⃣ Track Performance – Monitor your KPIs or goals using the visual progress bars in your cells. 5️⃣ Present and Share – Use the filling bars in reports or presentations to showcase your progress.
🎯 Who Can Benefit from the Multicolor Filling Bars in Excel Cells Without Using Chart? 🔹 Business Analysts
🔹 Project Managers
🔹 Sales Teams
🔹 Marketing Teams
🔹 Financial Analysts
🔹 Anyone needing a clean, efficient way to track and present data
Track and monitor your progress effortlessly with the Multicolor Filling Bars in Excel Cells Without Using Chart. This tool offers a simple, effective way to visually represent data while keeping your Excel sheets organized and professional.
Click here to read the Detailed blog post
https://www.pk-anexcelexpert.com/multicolor-filling-bars-in-excel-cells-without-using-chart/
Visit our YouTube channel to learn step-by-step video tutorials
Watch the step-by-step video tutorial:
Compatibility and Requirements
- Works in Microsoft Excel desktop (Excel 2016 or later, or Microsoft 365).
- The bars use conditional formatting inside the cells, so there are no chart objects to manage. If you also want regular charts, Microsoft’s guide to creating a chart from start to finish covers the steps.
Frequently Asked Questions
How do the filling bars work without a chart?
They are built into the cells with conditional formatting, so the bars sit next to your data and take no extra space on the sheet.
Can I change the colors?
Yes. Set your own color scheme for each progress level, for example red for low values, yellow for moderate and green for high.
Do the bars update when my numbers change?
Yes. Enter or change a value and the bar adjusts on its own.
What can I track with it?
KPIs, sales goals, project milestones or any other metric you measure as progress toward a target.
Do I need advanced Excel skills?
No. The setup is simple even with basic Excel skills, and setup instructions are included.
Related Progress Bar and Chart Templates
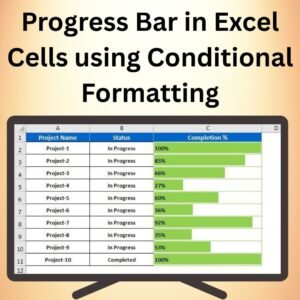
- Progress Bar in Excel Cells using Conditional Formatting: another in-cell progress bar
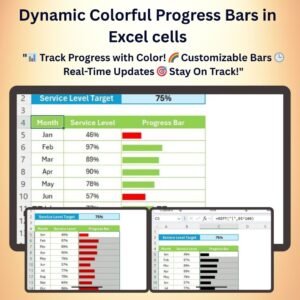
- Dynamic Colorful Progress Bars in Excel cells: colorful bars that change with your data
- Multi-color Data bar with REPT function: data bars built with a formula
- Stylish Progress Bar chart in Excel: a chart-based progress bar
- Data Analyst’s Chart & Visualization Pack: 10 chart templates for Excel and Google Sheets
Browse all Excel chart templates or the Excel dashboard templates.









Reviews
There are no reviews yet.