
 MTD & YTD Metrics – Compare targets with actual performance.
 Automated & Interactive – Easy-to-use, with color-coded indicators.
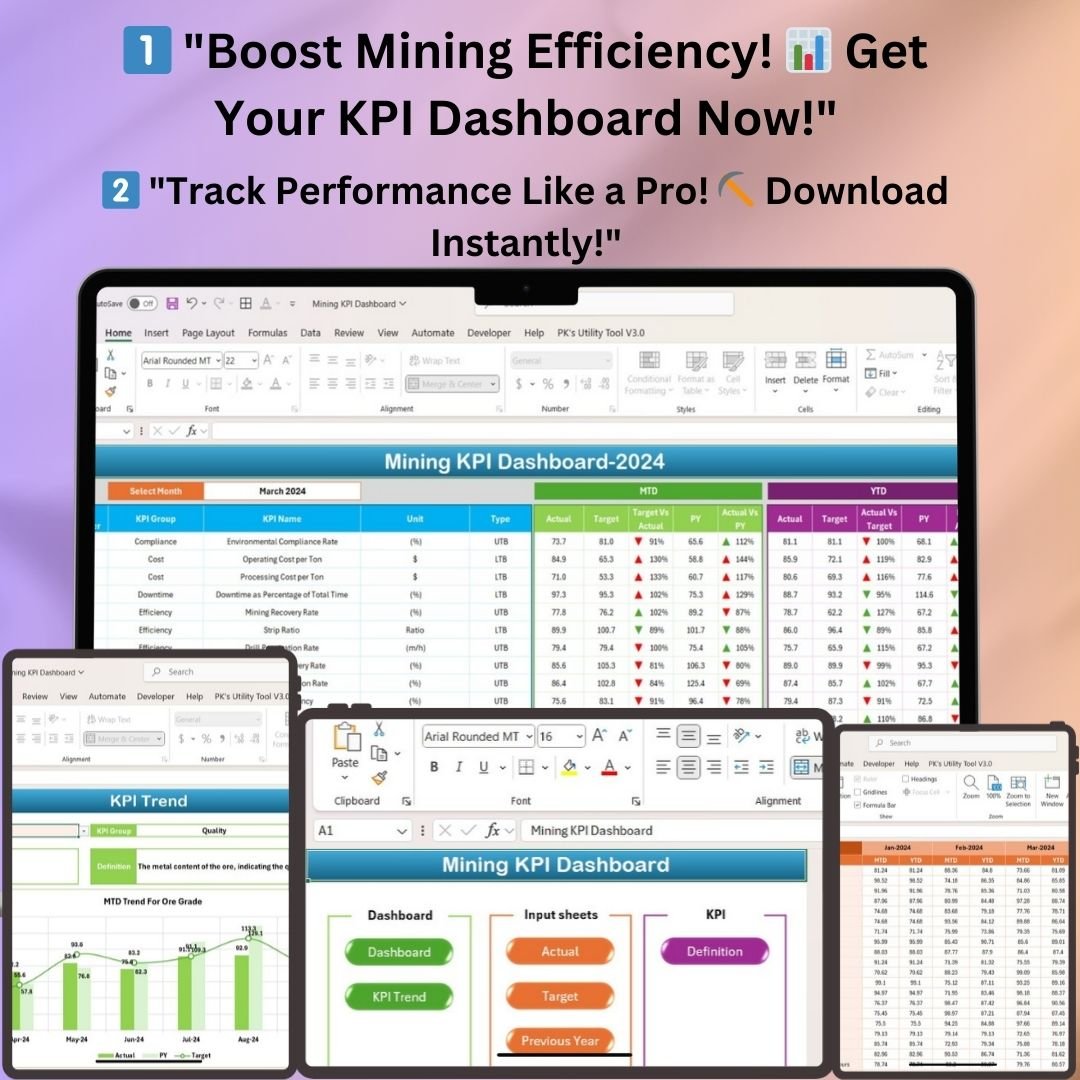
 Instant Download – Start optimizing your mining operations today!
The Mining KPI Dashboard in Excel is an advanced performance tracking tool designed for mining operations, enabling businesses to monitor key performance indicators (KPIs) with real-time insights, visual trends, and data-driven decision-making. This user-friendly dashboard ensures optimal operational efficiency, safety compliance, and financial performance by providing MTD (Month-to-Date) and YTD (Year-to-Date) data, target comparisons, and historical performance insights.
With easy navigation, interactive charts, and automated calculations, this Excel-based dashboard helps you streamline reporting and enhance strategic planning. Whether you’re managing production output, cost per ton, safety incidents, or equipment utilization, this tool is your go-to mining performance solution!
Key Features & Functionalities
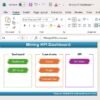
 Home Sheet – Your Navigation Hub
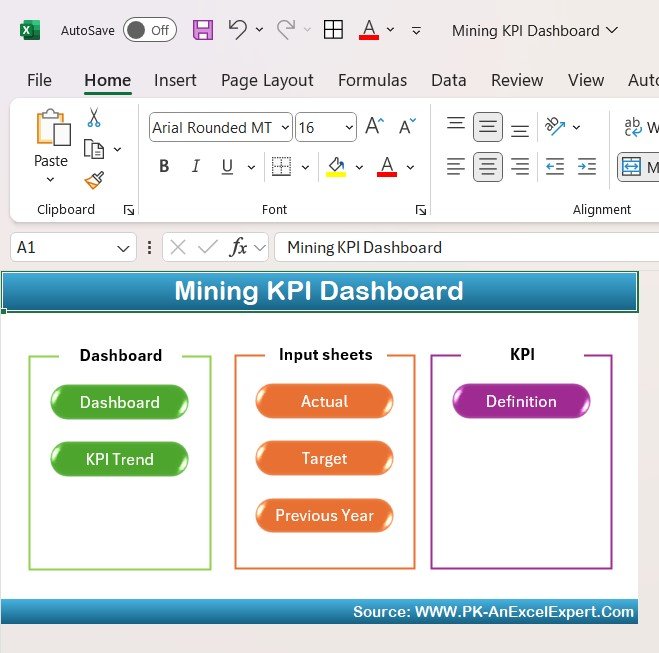
The Home Sheet acts as the control center for the entire dashboard.
- Provides quick access to all key sections, including the Dashboard, KPI Trend, and Data Input Sheets.
- Designed with user-friendly navigation buttons for easy interaction.
- Acts as a centralized menu for monitoring mining operations effortlessly.
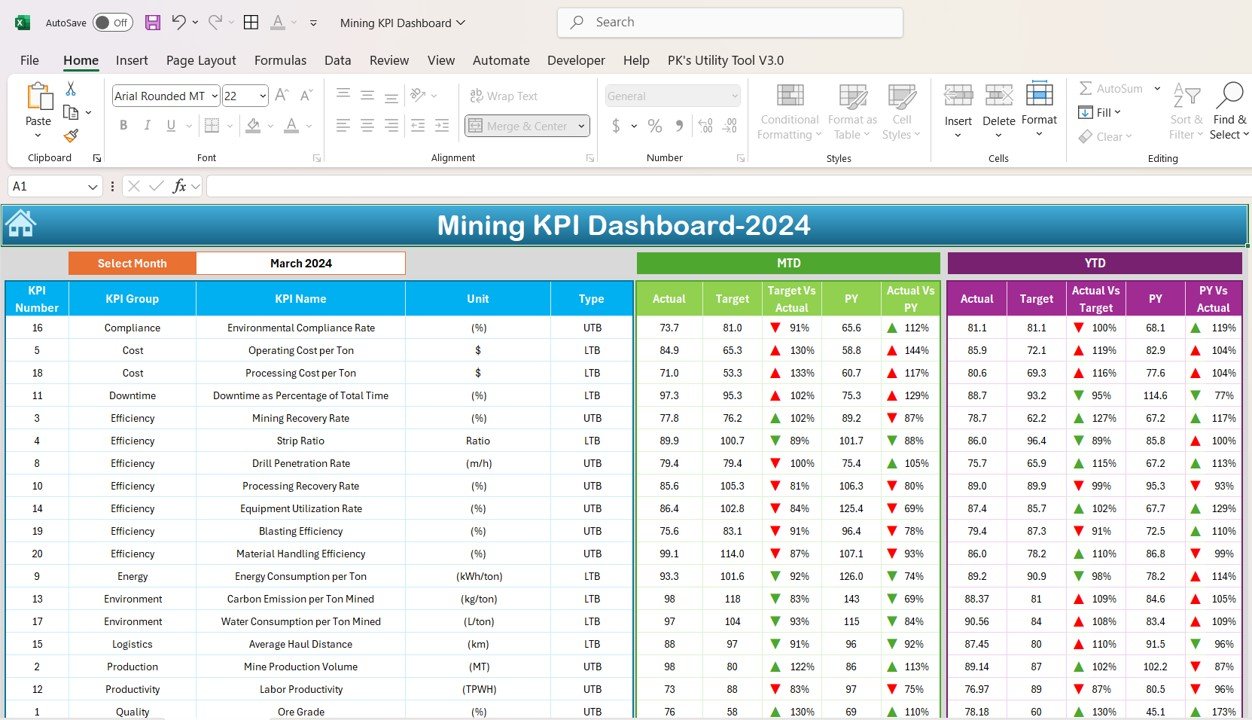
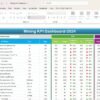
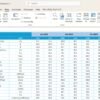
 Dashboard Sheet – Real-Time Mining KPI Insights
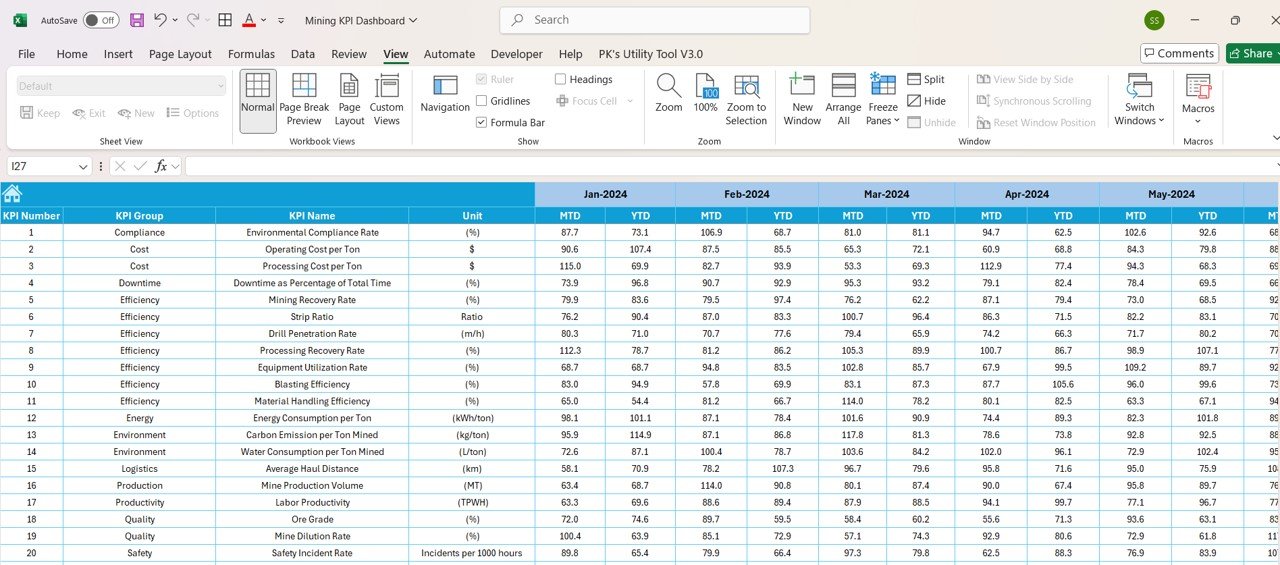
The Dashboard Sheet is the heart of the system, offering a visual snapshot of mining performance.
- Comprehensive KPI Overview: Displays all key MTD & YTD metrics in a structured format.
- Target vs. Actual Comparison: Track actual performance against predefined targets to measure efficiency.
- Previous Year vs. Actual Data: Compare current performance with historical trends to evaluate improvements.
- Conditional Formatting: Color-coded indicators (up/down arrows) highlight performance trends instantly.
- Dynamic Monthly Selection: Choose any month from the dropdown menu, and the data updates automatically.
 Example KPIs Tracked:
 Production Output (Tons) Cost per Ton Equipment Utilization Rate Safety Incidents Energy Consumption Ore Grade Percentage
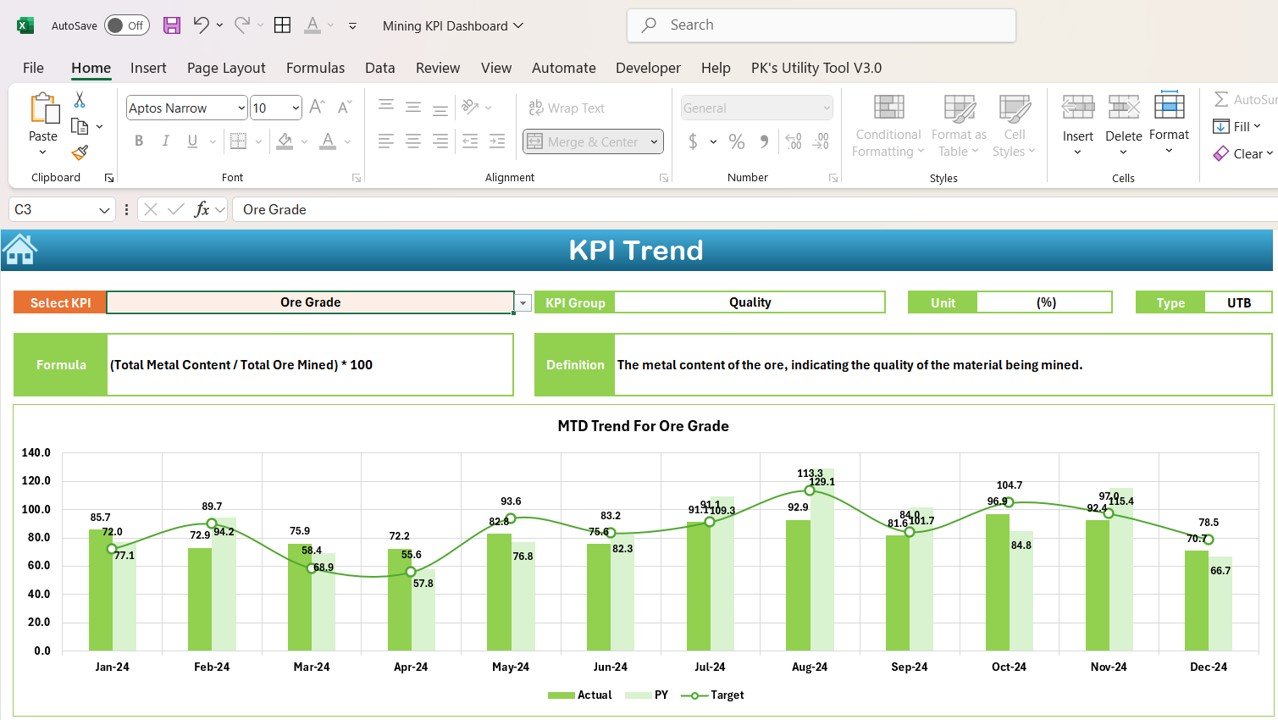
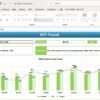
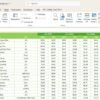
 KPI Trend Sheet – Analyze Long-Term Trends
The KPI Trend Sheet enables users to drill down into detailed trend analysis for each KPI.
- Select a specific KPI from the dropdown list to view its historical trends.
- Displays MTD and YTD performance trends using interactive charts.
- Identifies seasonal patterns, operational inefficiencies, and opportunities for process improvement.
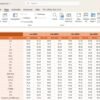
 Actual Numbers Input Sheet – Enter & Update Data Easily
- Automated Data Entry: Simply update the MTD and YTD values, and the dashboard reflects real-time changes.
- Month Selection Feature: Change the month in the dropdown menu, and all reports update dynamically.
- Ensures Accuracy: Eliminates manual errors by providing structured data input fields.
 Target Sheet – Define Your KPI Goals
- Set monthly and annual targets for each KPI.
- Helps in performance benchmarking and identifying areas for improvement.
- Provides a clear gap analysis between actual results vs. target goals.
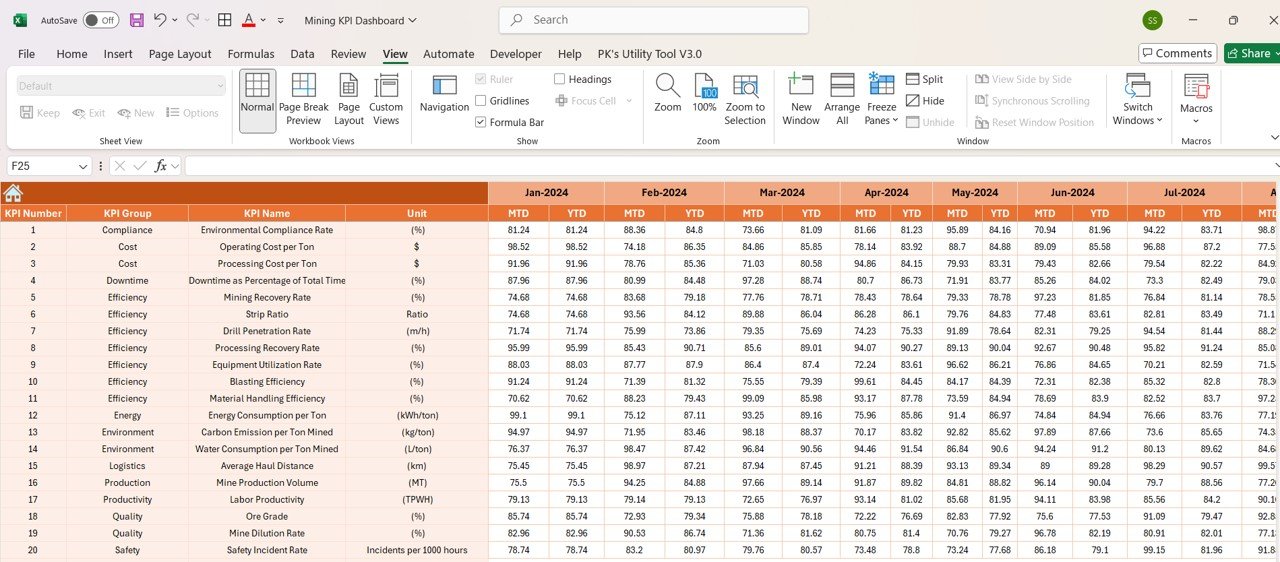
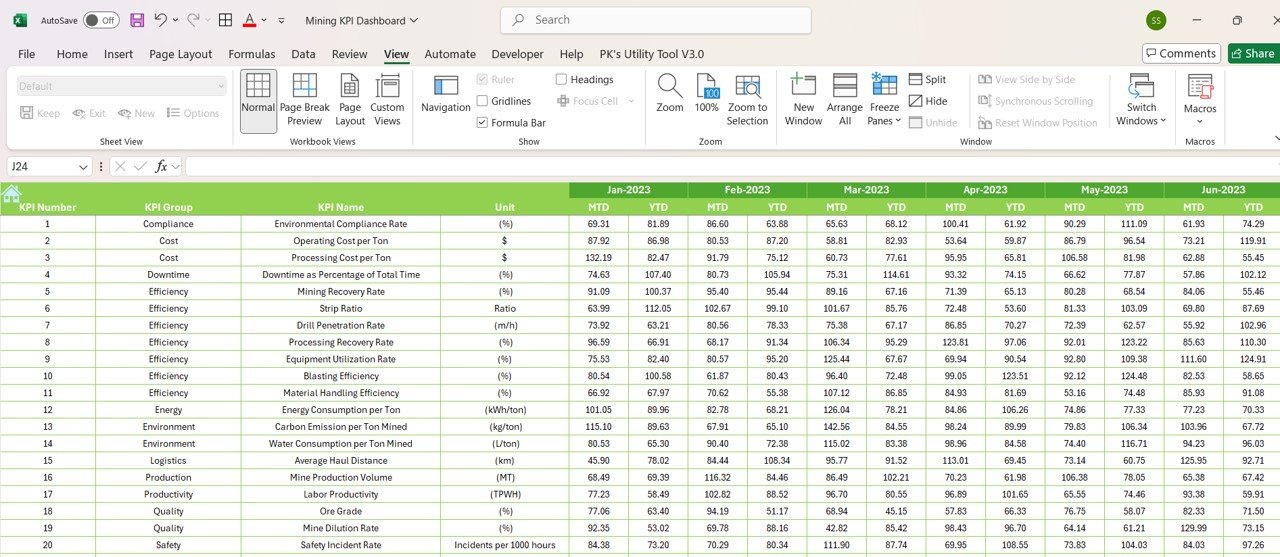
Previous Year Number Sheet – Compare Past & Present Performance
- Stores historical data to analyze year-over-year performance.
- Identify growth trends and areas needing optimization.
- Assists in predictive analysis and long-term strategy planning.
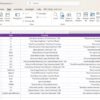
 KPI Definition Sheet – Your KPI Reference Guide
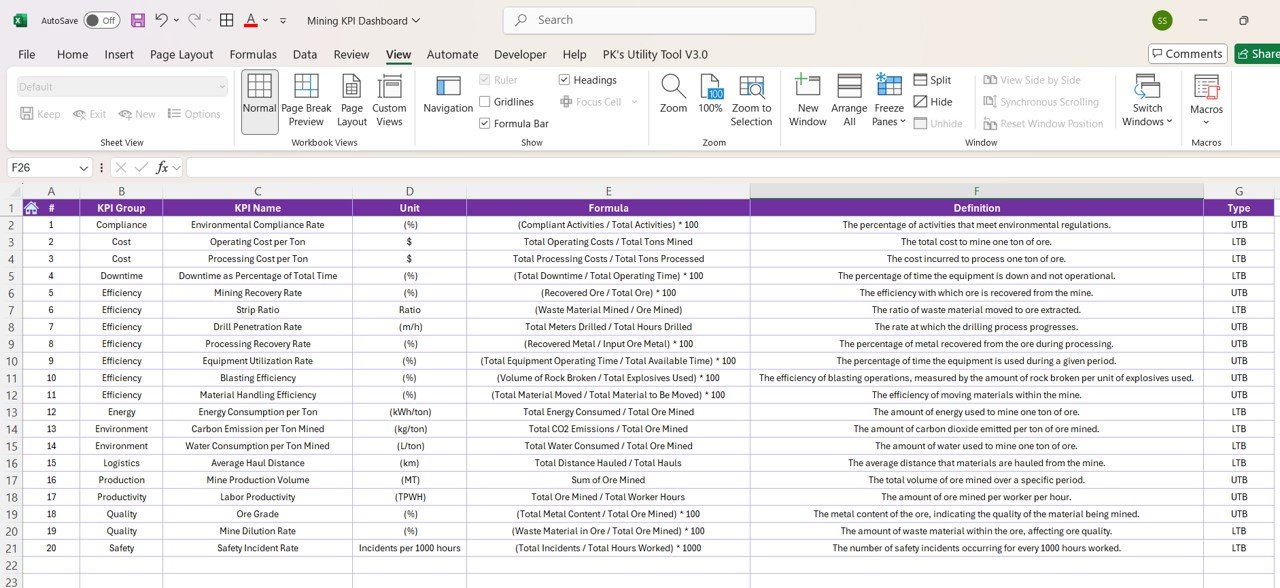
The KPI Definition Sheet serves as a knowledge base for understanding key metrics.
- Lists all tracked KPIs with detailed definitions and formulas.
- Ensures standardized reporting across departments.
- Useful for training new employees on mining KPIs and performance tracking.
Why Choose This Mining KPI Dashboard?
 100% Automated & Dynamic – No complex formulas required! Simply update the input sheets and see real-time insights. User-Friendly & Customizable – Easily modify KPI names, targets, and data ranges to suit your mining operations. Instant Performance Monitoring – Identify bottlenecks and optimize mining processes with ease. Excel-Based Flexibility – No need for additional software; works in Microsoft Excel 2016+. Industry-Specific KPI Tracking – Includes essential mining-related metrics for better resource planning.
Who Can Use This Dashboard?
Mine Managers – Track daily production, equipment efficiency, and safety compliance. Operations Teams – Analyze cost per ton, energy usage, and workforce productivity. Financial Analysts – Monitor mining financial KPIs and cost control strategies. Project Managers – Compare project performance against past years and target values.
Click hare to read the Detailed blog post
Visit our YouTube channel to learn step-by-step video tutorials


Reviews
There are no reviews yet.