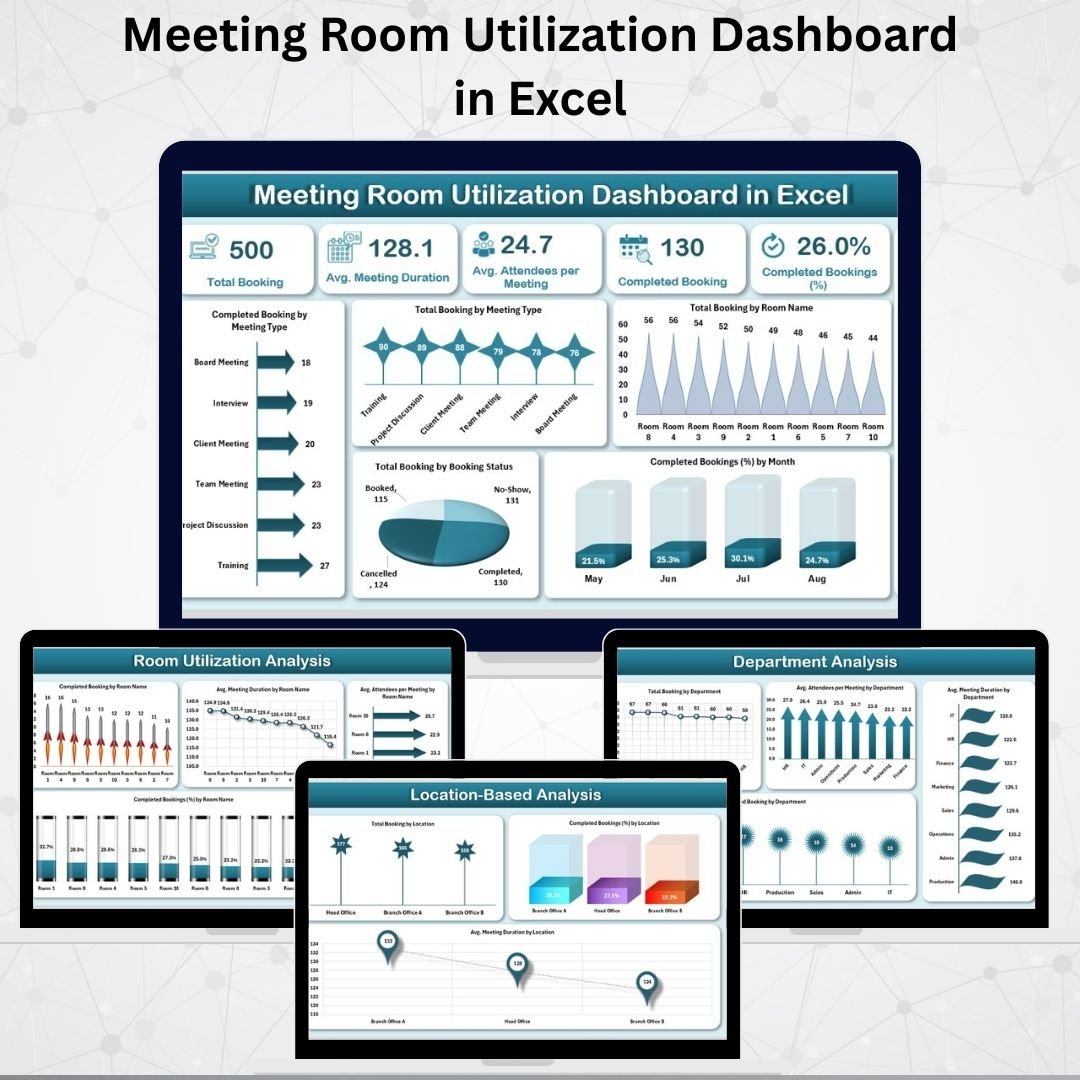

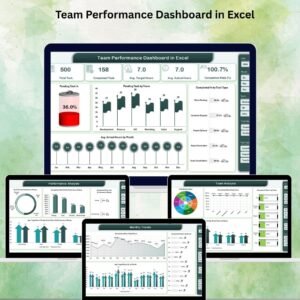
Managing meeting rooms effectively is one of the biggest challenges for modern organizations. Inefficient booking systems often lead to double-bookings, unused spaces, or departments struggling to find available rooms. The Meeting Room Utilization Dashboard in Excel solves this problem by providing a ready-to-use, interactive dashboard that tracks and analyzes meeting room usage across your organization.
With this tool, managers, administrators, and facility teams gain deep insights into booking trends, departmental demand, completion rates, and time-based patterns. This ensures optimized space allocation, reduced scheduling conflicts, and improved overall productivity.
🔑 Key Features of the Meeting Room Utilization Dashboard
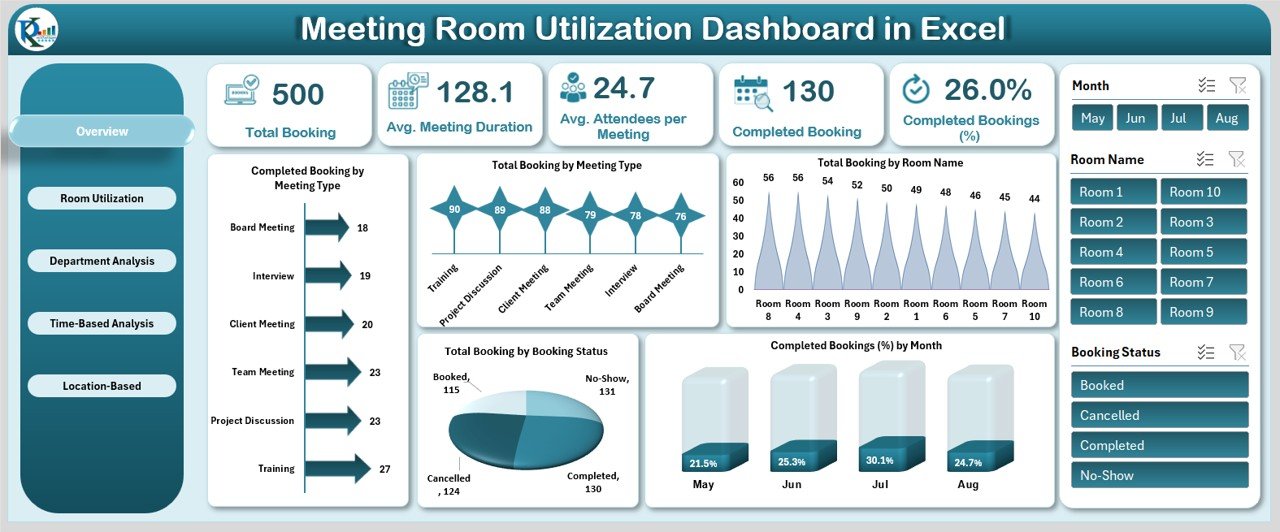
📌 Overview Sheet – Quick Performance Snapshot
Get a complete picture of your meeting rooms in one glance.
-
Total Bookings made
-
Average Meeting Duration ⏱
-
Average Attendees per Meeting 👥
-
Completed Bookings & % Completion
-
Charts showing booking trends by type, status, and room name
This gives managers the insights they need to monitor utilization instantly.
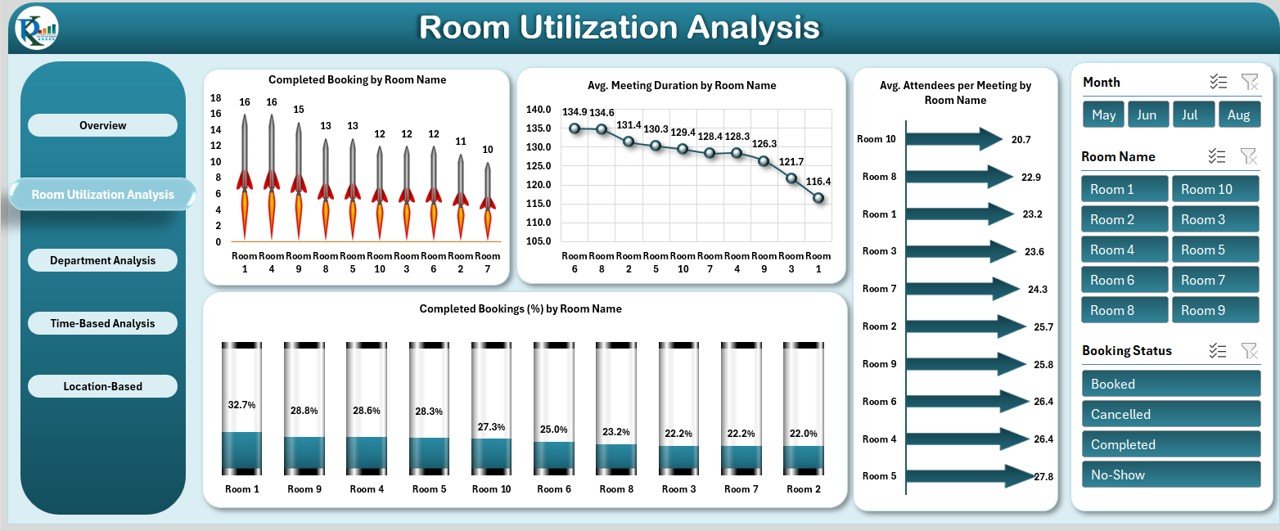
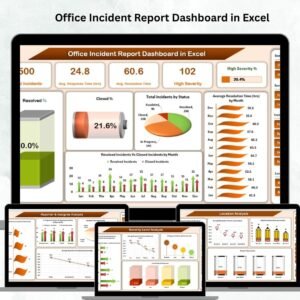
🏢 Room Utilization Analysis
Identify which rooms are being used most, and which remain underutilized.
-
Completed Bookings by Room Name
-
Avg. Meeting Duration per Room ⏱
-
Avg. Attendees per Room 👥
-
Completion % by Room
These insights help optimize room allocation and reduce wastage of resources.
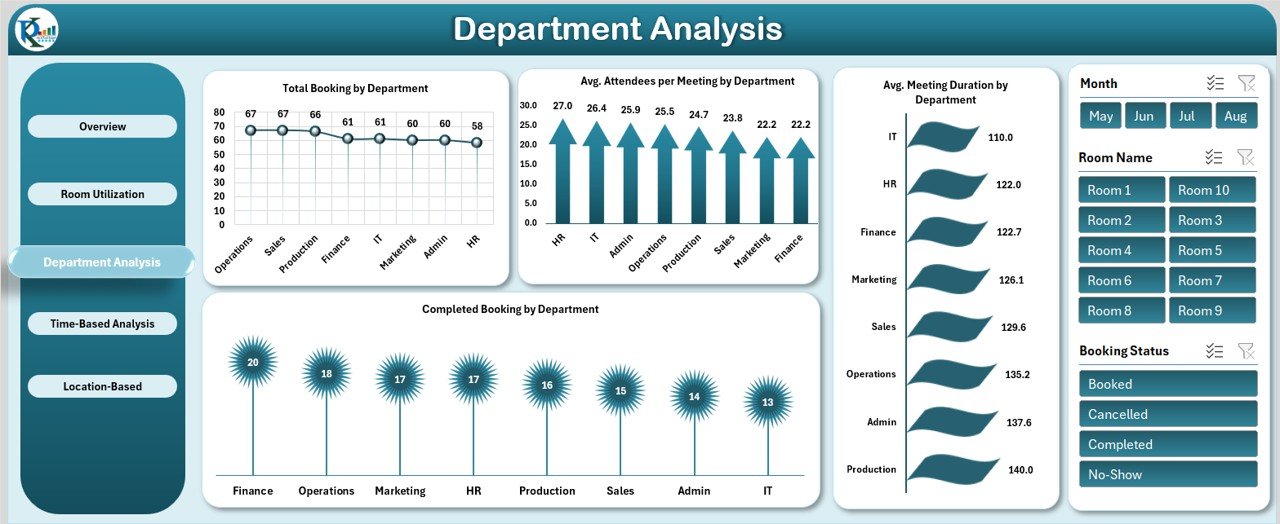
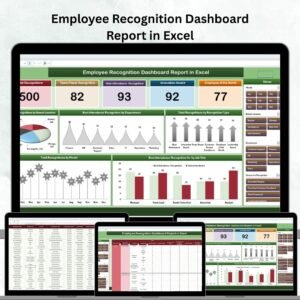
🏬 Department Analysis
Different departments use rooms differently. This sheet tracks:
-
Total Bookings by Department
-
Avg. Meeting Duration by Department
-
Avg. Attendees per Meeting by Department
-
Completed Bookings by Department
With these reports, you can understand departmental demand and plan better capacity.
⏰ Time-Based Analysis
Monitor patterns over days, weeks, or months.
-
Avg. Meeting Duration by Month
-
Meeting Duration by Type 📅
-
Organizer-Specific Meeting Analysis
-
Attendee Counts by Organizer
This helps organizations detect peak usage times and forecast room demand.
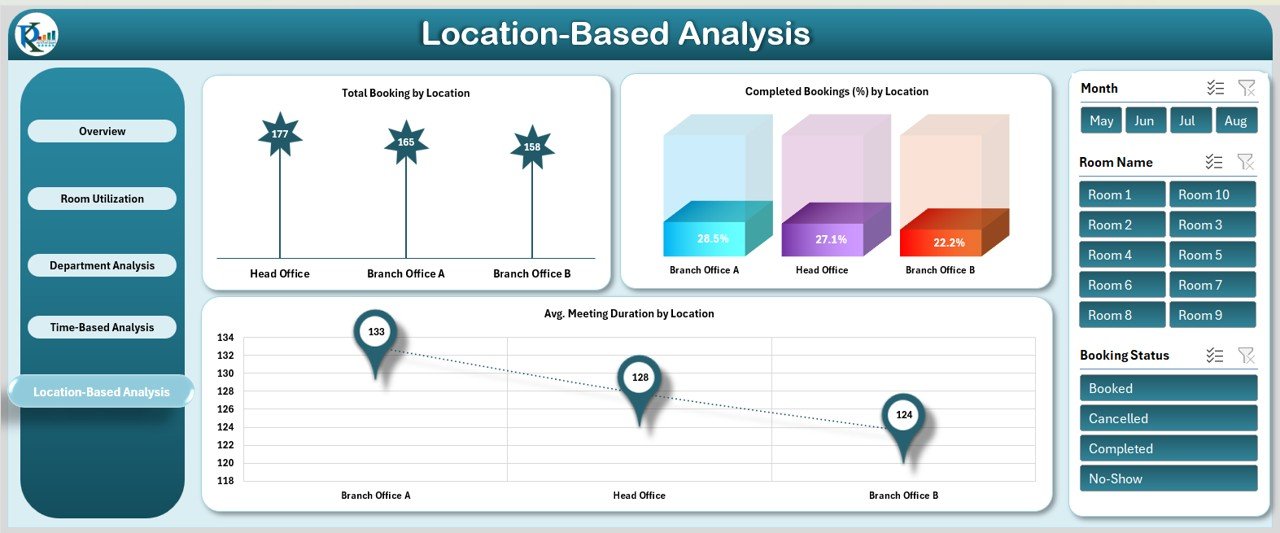
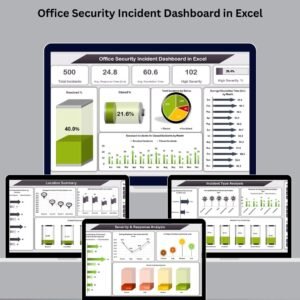
🌍 Location-Based Analysis
For multi-office setups, compare usage across locations.
-
Total Bookings by Location
-
Completion % by Location
-
Avg. Meeting Duration by Location
Perfect for companies with branches or multiple facilities.
📑 Data Sheet – Central Database
All booking data is captured here and dynamically linked to the dashboard.
-
Booking ID
-
Room Name
-
Meeting Type
-
Department
-
Organizer
-
Location
-
Date & Time
-
Attendees Count
-
Booking Status
With accurate inputs, the dashboard updates automatically to reflect real-time utilization.
🎯 Benefits of Using This Dashboard
-
✅ Optimize Room Usage: Identify underutilized or overbooked rooms
-
✅ Improve Scheduling: Detect conflicts and peak times for better planning
-
✅ Measure Productivity: Analyze meeting durations, attendance & completion rates
-
✅ Department Insights: Understand booking needs across teams
-
✅ Location-Based Planning: Manage office resources more effectively
🙌 Who Can Benefit from This Dashboard?
-
🏢 Office Administrators – for tracking meeting space efficiency
-
📅 Facility Managers – to improve room allocation
-
👨💼 Department Heads – to analyze team meeting patterns
-
🏬 Multi-location Companies – to balance room demand across offices
🚀 Opportunities for Enhancement
-
Integration with Google Calendar / Outlook for real-time sync
-
Predictive analytics to forecast future demand 📈
-
Automated email/SMS alerts for conflicts ⚠️
-
Mobile-friendly dashboard for on-the-go access 📲
🔗 Click here to read the Detailed blog post
🔗 Visit our YouTube channel for step-by-step video tutorials


Reviews
There are no reviews yet.