


Optimizing production efficiency is one of the biggest priorities for manufacturing companies. From labor hours to material consumption, every small deviation affects profitability. But when teams rely on scattered spreadsheets, manual reports, or outdated tracking methods, they fail to see the true picture. The Manufacturing Production Variance Analysis Dashboard in Excel solves this challenge instantly. It brings all variance metrics into one clean, interactive, and automated dashboard—helping manufacturers minimize cost, improve accuracy, and maximize output.
This dashboard is designed for managers, production teams, analysts, and plant supervisors who want a powerful yet easy way to monitor variances without advanced tools. With automated calculations, slicers, charts, and page-wise insights, this template transforms raw production data into clear decision-making reports.
📊 Key Features of the Manufacturing Production Variance Analysis Dashboard in Excel
This Excel-based dashboard includes multiple analytical pages, real-time charts, and full automation. You can compare variance by plant, department, line, shift, and month within seconds.
⭐ Highlights:
-
Automated variance formulas
-
Page navigator for quick movement
-
Interactive slicers for deep comparison
-
Clean KPI cards for instant clarity
-
Department, line, plant & monthly views
-
Standard vs Actual cost comparison
This dashboard is ideal for reducing waste, improving efficiency, and strengthening production planning.
🧩 What’s Inside the Manufacturing Variance Dashboard
This dashboard contains five analytical pages and a backend data sheet that powers all calculations. Each page focuses on a specific area of production.
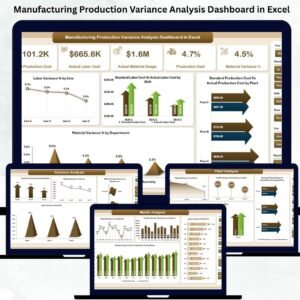
🏭 1. Overview Page – Complete Variance Snapshot

The Overview Page is the heart of the dashboard. It displays all major production variances in one screen.
✔ KPI Cards Include:
-
Labor Variance %
-
Material Variance %
-
Total Production Cost Variance
-
Standard Cost Summary
-
Actual Cost Summary
✔ Key Charts:
-
Labor Variance % by Line – Identify underperforming lines
-
Standard Labor Cost vs Actual Labor Cost by Shift – See which shifts exceed targets
-
Standard vs Actual Production Cost by Plant – Compare plantwise performance
-
Material Variance % by Department – Spot wastage or inefficient usage
This page helps managers detect cost leakage and take action immediately.
🏢 2. Department Analysis Page – Compare Performance Across Departments
This page gives a detailed view of how each department performs against standards.
✔ Charts Include:
-
Labor Variance % by Department
-
Standard vs Actual Labor Cost
-
Standard vs Actual Production Cost
-
Material Usage Variance
Users can compare production, quality, maintenance, or engineering departments with one click.
🏭 3. Plant Analysis Page – Plant-Wise Variance Evaluation
Every plant operates differently. This page shows which plants perform efficiently and which ones need intervention.
✔ Key Visuals:
-
Material Variance % by Plant
-
Total Production Cost Variance by Plant
-
Standard vs Actual Labor Cost by Plant
-
Standard vs Actual Production Cost by Plant
You instantly identify high-performing plants and locations where improvement is needed.
📉 4. Variance Analysis Page – Deep-Dive Variance Breakdown
This page focuses purely on variances and their root causes.
✔ Charts Include:
-
Production Cost Variance % by Plant
-
Material Variance % by Line
-
Material Usage Variance by Department
-
Labor Variance % by Shift
This deep analysis helps resolve bottlenecks, reduce waste, and improve accuracy.
📅 5. Month Analysis Page – Track Trends Month by Month
Manufacturing performance changes monthly. This page reveals trend patterns and helps in forecasting.
✔ Charts Include:
-
Material Variance % by Month
-
Total Production Cost Variance
-
Standard vs Actual Labor Cost
-
Standard vs Actual Production Cost
These visuals support smarter scheduling, budgeting, and resource allocation.
👥 Who Can Benefit from This Dashboard?
-
Production Managers
-
Manufacturing Analysts
-
Plant Supervisors
-
Industrial Engineers
-
Quality Teams
-
Lean & Six Sigma Professionals
Anyone working with manufacturing data will find this dashboard extremely valuable.
📘 Click here to read the Detailed Blog Post
📺 Visit our YouTube channel to learn step-by-step video tutorials
👉 Youtube.com/@PKAnExcelExpert


Reviews
There are no reviews yet.