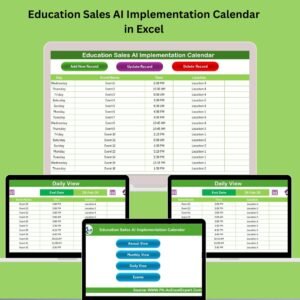
The Knowledge Base KPI Dashboard in Excel is a comprehensive tool designed to help businesses, organizations, and support teams effectively track and manage their knowledge base performance. Whether you’re running a customer support system, managing an internal knowledge repository, or looking to optimize content delivery, this Excel-based dashboard provides a streamlined way to track key performance indicators (KPIs) and improve the efficiency of your knowledge management strategy.
By monitoring KPIs such as article views, user engagement, and content effectiveness, this dashboard offers insights into how well your knowledge base is meeting user needs. Whether you’re tracking customer satisfaction with knowledge base articles or monitoring internal documentation usage, this dashboard gives you the data needed to enhance your knowledge management efforts and continuously improve the quality of your content.
Key Features of the Knowledge Base KPI Dashboard in Excel
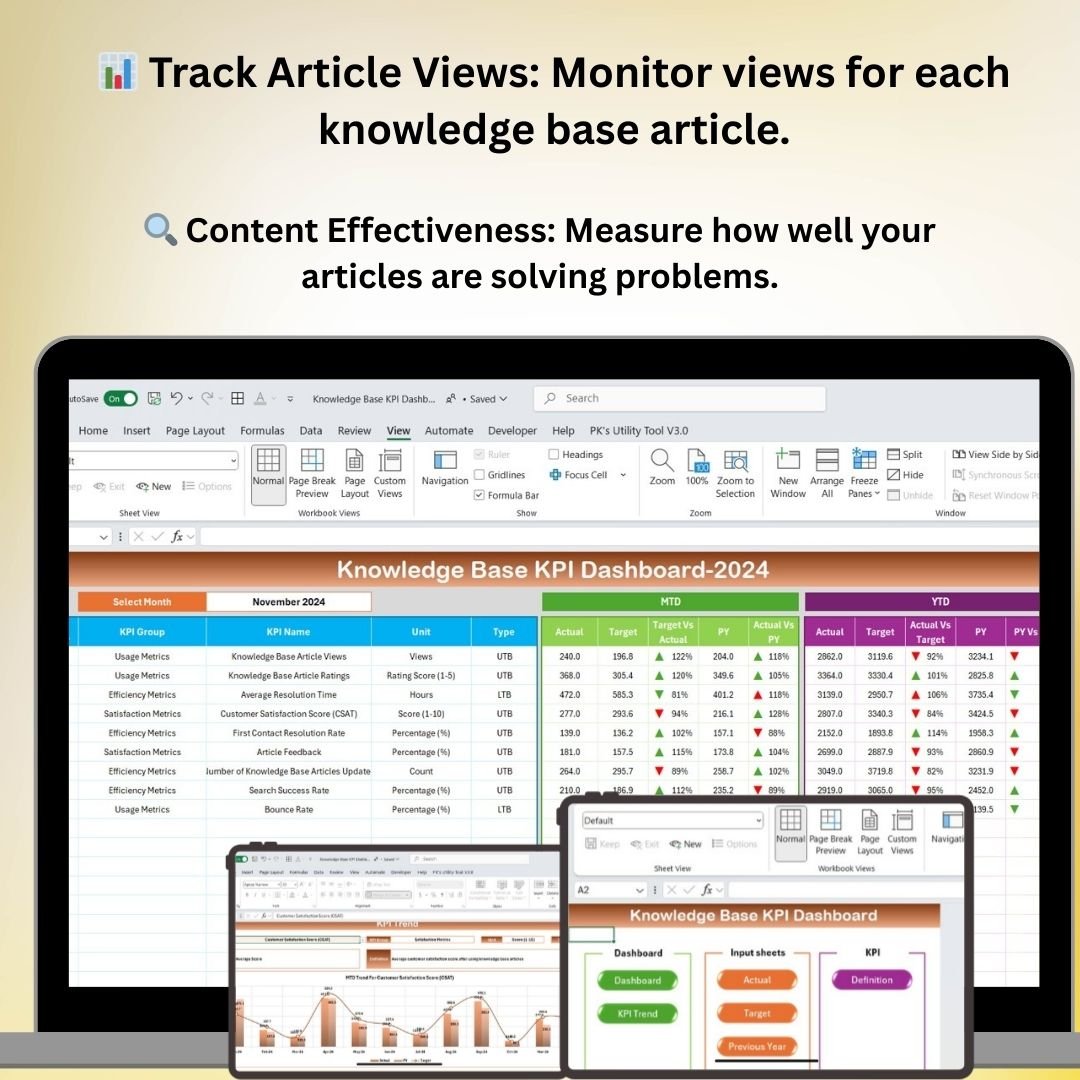
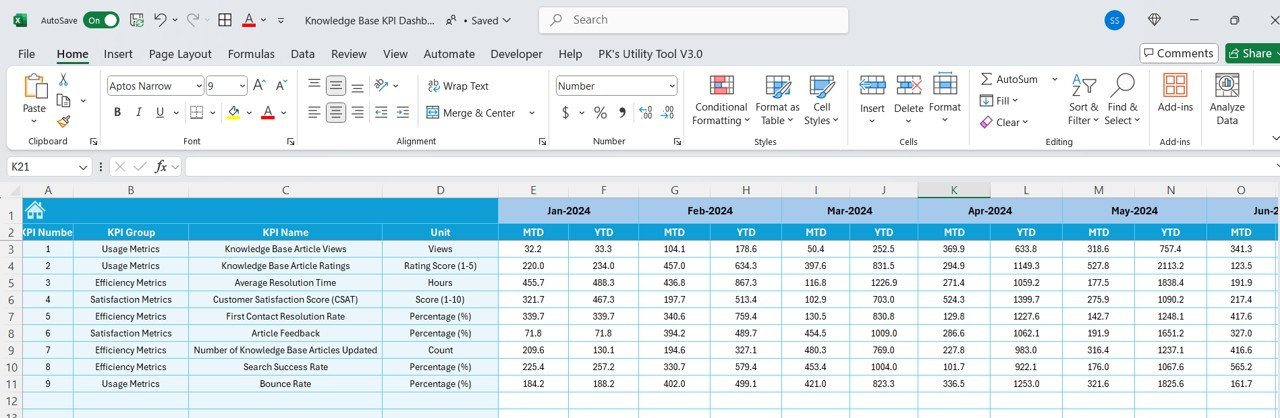
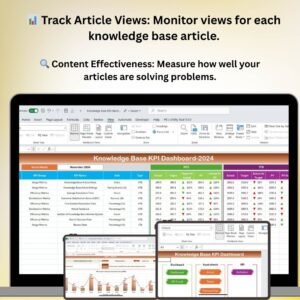
📊 Article View Tracking
Monitor the number of views for each knowledge base article. This feature helps you identify the most popular and useful articles, as well as those that need updating or improvement.
🔍 Content Effectiveness Analysis
Track how effective your articles are in solving customer problems by measuring the number of views versus the number of successful resolutions or feedback. Use this insight to refine and enhance your content.
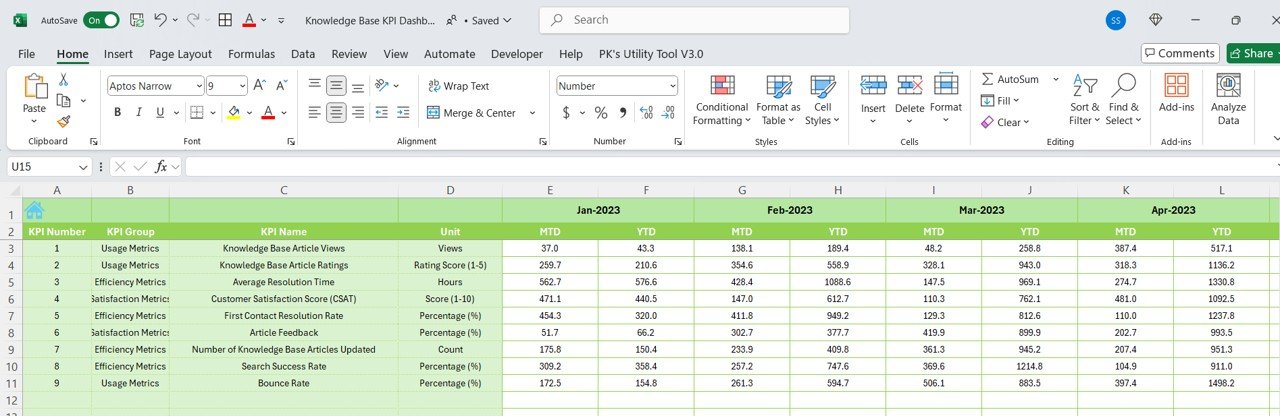
📅 Time-Based Performance Monitoring
Analyze knowledge base performance over different time periods (daily, weekly, monthly). This time-based tracking helps you assess trends, identify peak usage periods, and measure the effectiveness of any updates or improvements.
📉 Search Success Rate
Track the success rate of searches conducted within your knowledge base. Identify gaps in content or areas where users are not finding the information they need.
📈 Customer Satisfaction & Feedback Tracking
Collect and track user feedback related to specific articles or overall knowledge base content. Use this data to identify areas for improvement and measure the impact of updates or content changes.
⚙️ Customizable KPIs & Metrics
Customize the dashboard to track the KPIs that matter most to your organization, whether you are monitoring internal knowledge sharing, customer support efficiency, or content usage.
Why You’ll Love the Knowledge Base KPI Dashboard in Excel
✅ Streamline Knowledge Management
Track the effectiveness of your knowledge base in one place. Monitor article views, content performance, and user feedback to optimize your content delivery.
✅ Improve Content Engagement
Identify which articles are engaging users and which need improvement. Use insights from the dashboard to enhance your content and better meet user needs.
✅ Data-Driven Decisions for Content Optimization
Leverage data to make informed decisions about content updates, additions, or removals. Improve the overall effectiveness of your knowledge base by understanding what works and what doesn’t.
✅ Boost Customer Satisfaction & Support Efficiency
Track user satisfaction with knowledge base articles and improve the resolution rate of customer issues. A well-optimized knowledge base reduces support inquiries and enhances the customer experience.
✅ Customizable & Scalable
Adapt the dashboard to meet your specific knowledge management goals. Whether you’re managing a small team’s internal knowledge or an extensive customer-facing knowledge base, this tool is scalable for various business needs.
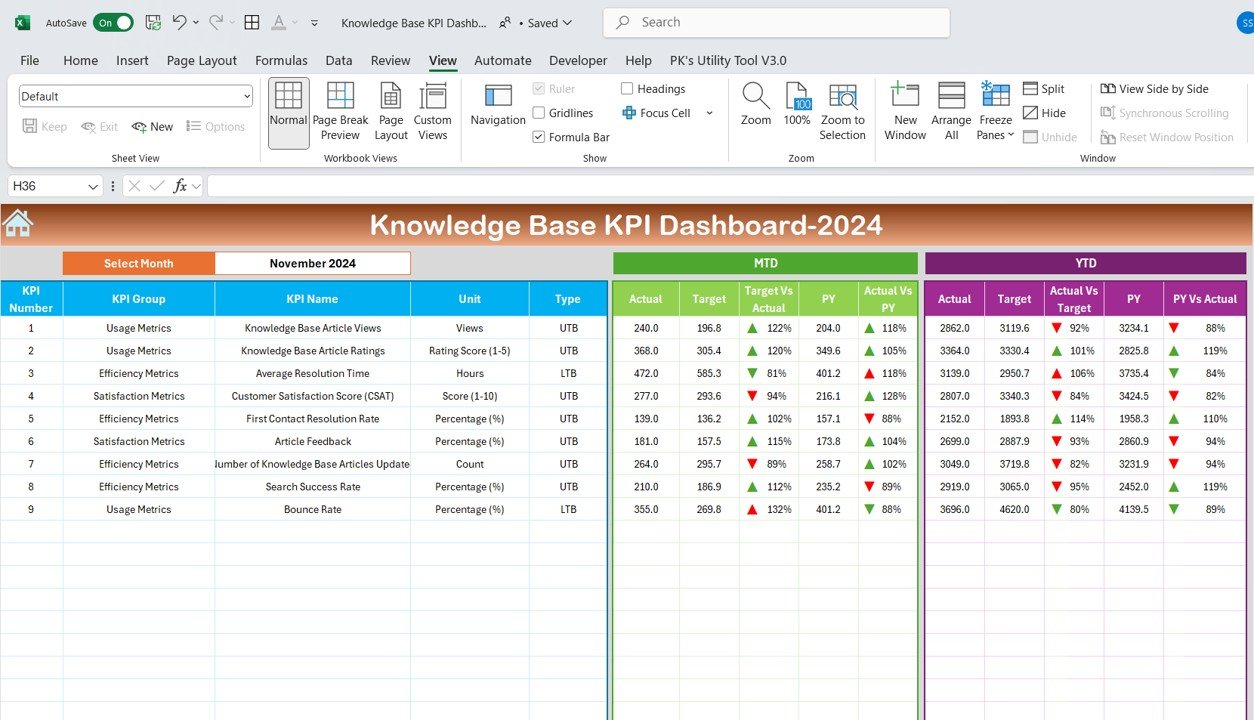
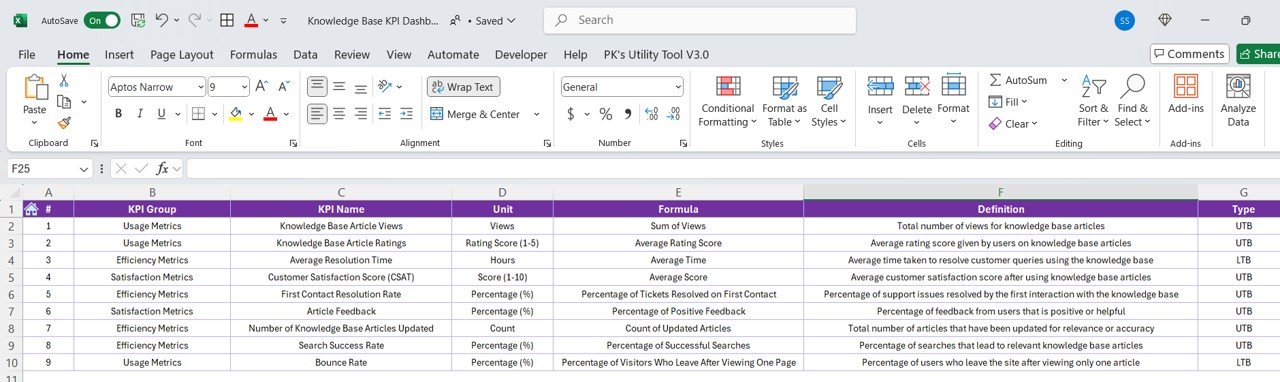
What’s Inside the Knowledge Base KPI Dashboard in Excel?
- Article View Tracking: Track views for each article and identify top-performing content.
- Content Effectiveness Analysis: Measure content performance by comparing views and resolutions.
- Search Success Rate Monitoring: Monitor the effectiveness of searches and identify gaps in content.
- Customer Feedback & Satisfaction Tracking: Track user feedback and satisfaction with knowledge base articles.
- Time-Based Performance Analysis: Analyze knowledge base performance over different time periods.
- Customizable Metrics & KPIs: Tailor the dashboard to reflect your specific knowledge management needs.
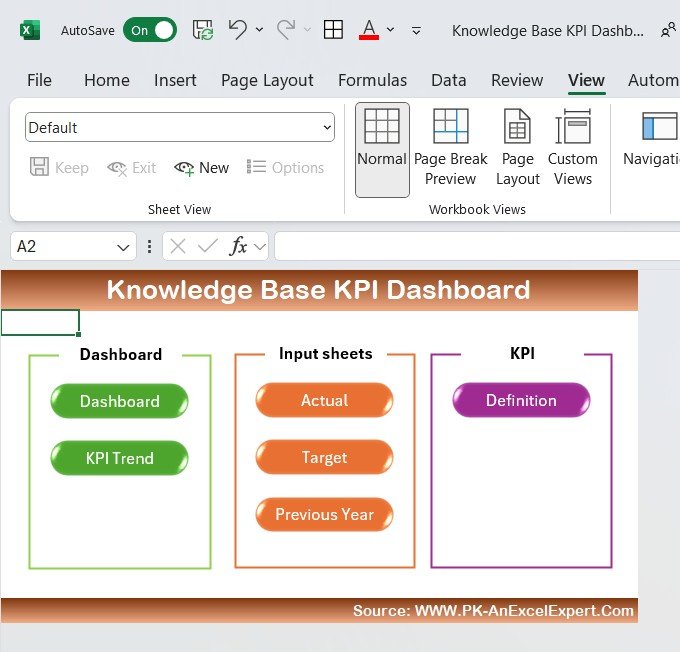
How to Use the Knowledge Base KPI Dashboard in Excel
1️⃣ Download the Template: Instantly access the Knowledge Base KPI Dashboard in Excel.
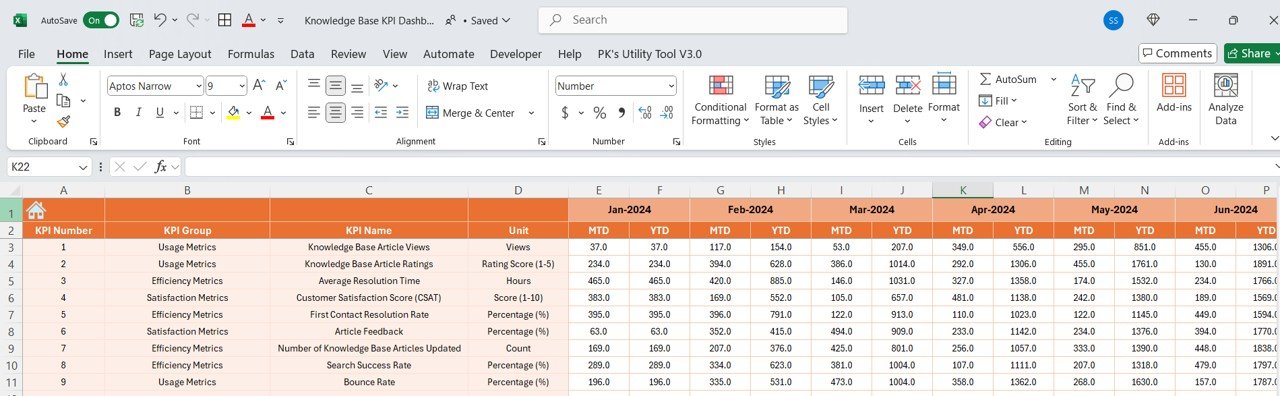
2️⃣ Set Up Your KPIs: Input your key performance indicators and relevant data for your knowledge base articles.
3️⃣ Track Article Performance: Monitor views, feedback, search success, and more.
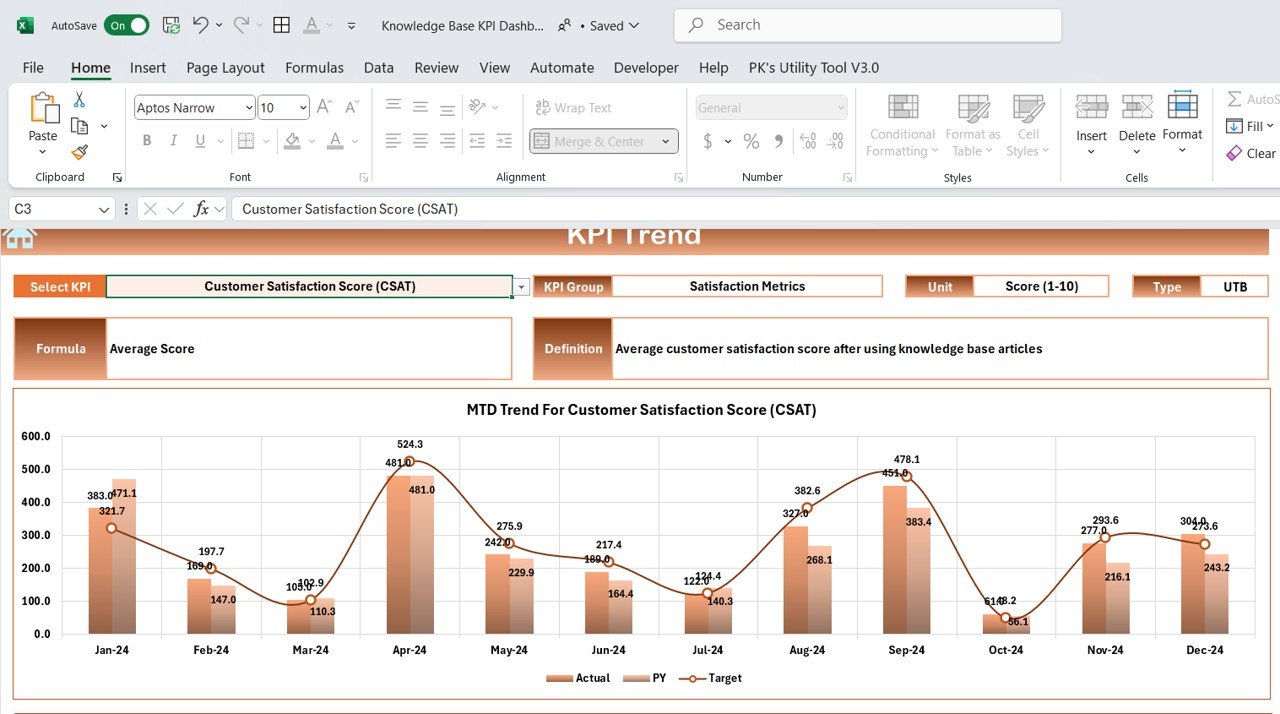
4️⃣ Analyze Data & Insights: Use data visualizations to identify trends and make decisions for optimizing content.
5️⃣ Optimize Your Knowledge Base: Continuously update and refine your knowledge base based on data-driven insights.
Who Can Benefit from the Knowledge Base KPI Dashboard in Excel?
🔹 Customer Support & Service Teams
🔹 Knowledge Base Managers & Content Strategists
🔹 E-commerce Platforms & Online Retailers
🔹 Internal Communications Teams
🔹 Knowledge Management Specialists
🔹 Small & Medium Businesses (SMBs)
🔹 Nonprofits & Educational Institutions
🔹 Large Enterprises with Customer Support Departments
Optimize your knowledge management efforts with the Knowledge Base KPI Dashboard in Excel. Track user engagement, analyze content effectiveness, and enhance your knowledge base to improve customer satisfaction and internal knowledge sharing.
Click here to read the Detailed blog post
Visit our YouTube channel to learn step-by-step video tutorials
Youtube.com/@PKAnExcelExpert


Reviews
There are no reviews yet.