
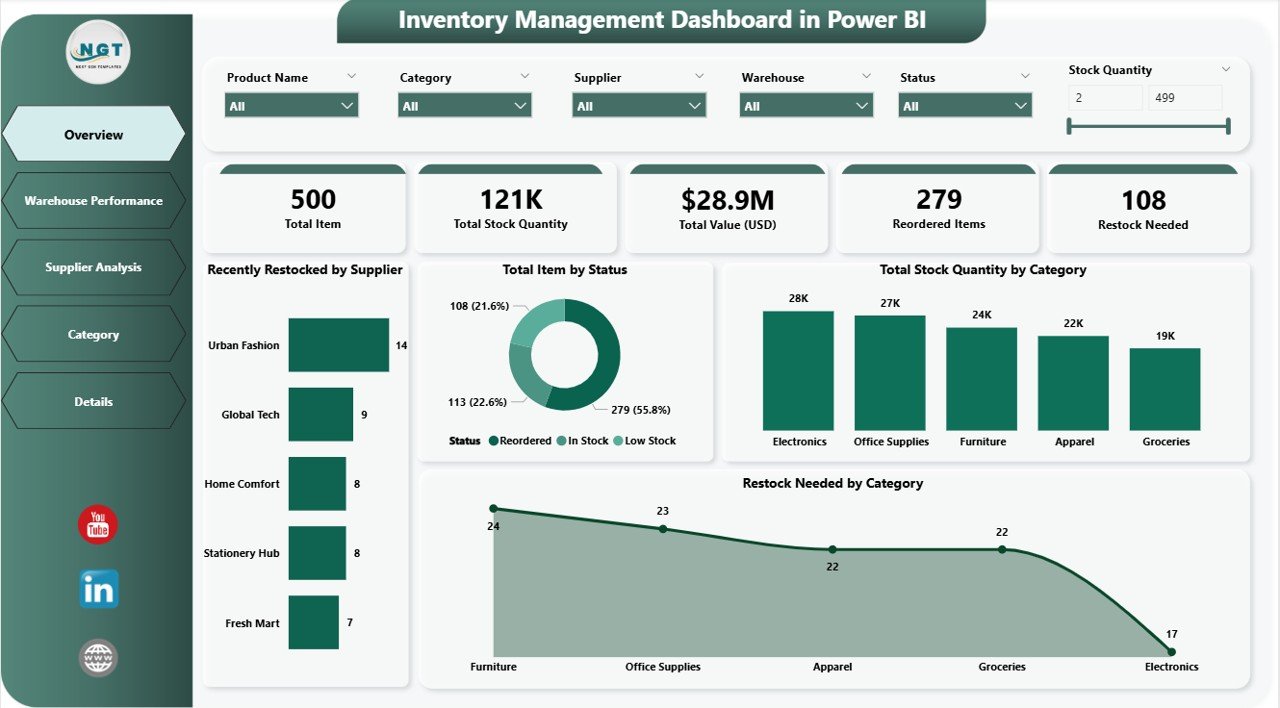
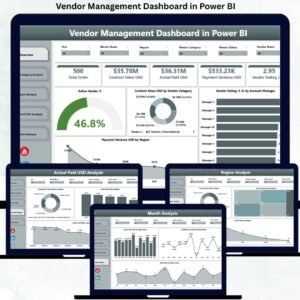
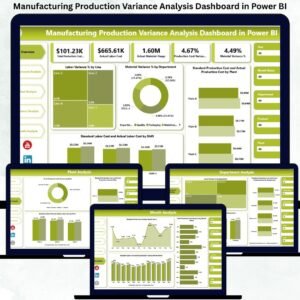
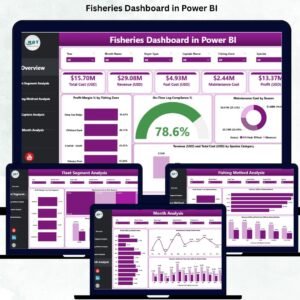
📊 Inventory Management Dashboard in Power BI is a powerful and interactive reporting solution designed to help businesses streamline their inventory control process, improve warehouse performance, and ensure real-time visibility across suppliers, categories, and stock levels. Built using Microsoft Power BI and Excel data sources, this dashboard provides a comprehensive and customizable analytics platform for any inventory-driven organization.
The dashboard includes five professionally designed report pages:
-
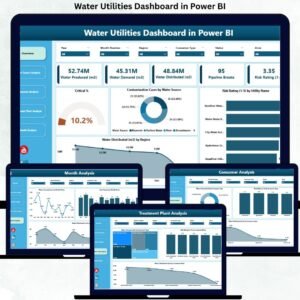
Overview Page – View quick insights with 5 KPI cards (e.g., Total Stock Quantity by Category, Restock Needed) and filter data using 6 dynamic slicers.
-
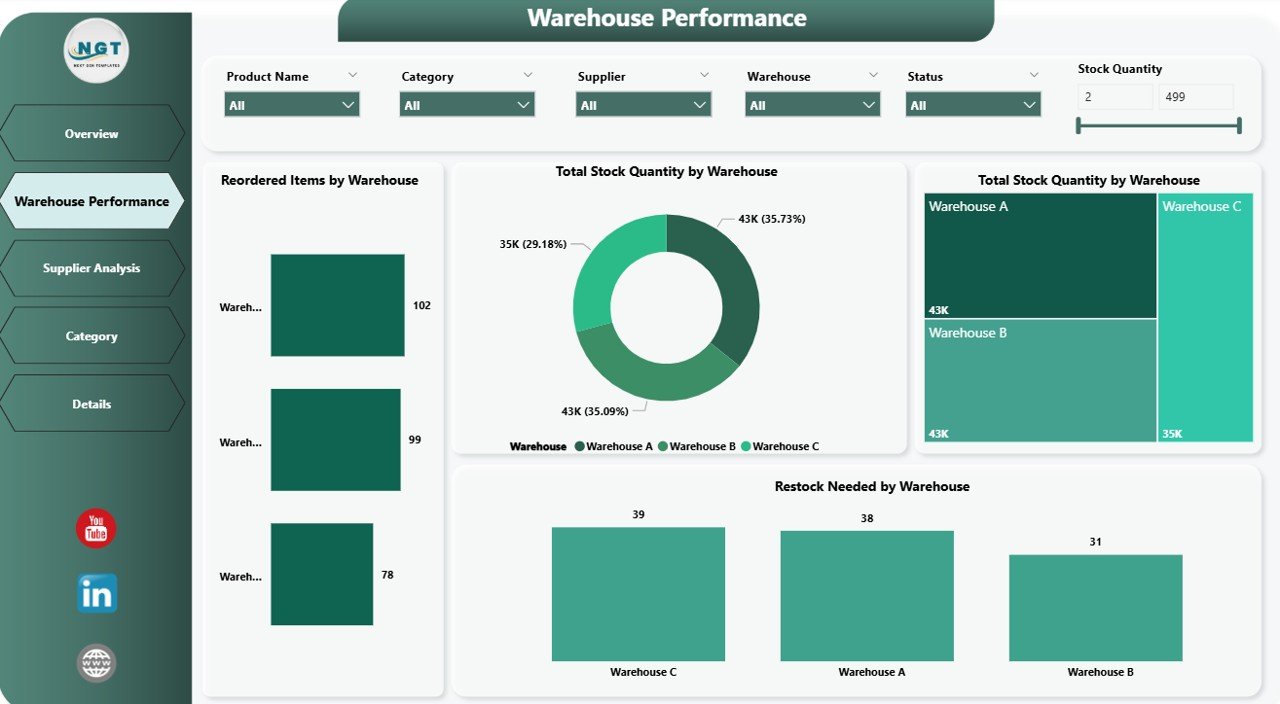
Warehouse Performance Page – Analyze stock levels and restocking trends by warehouse with visual breakdowns.
-
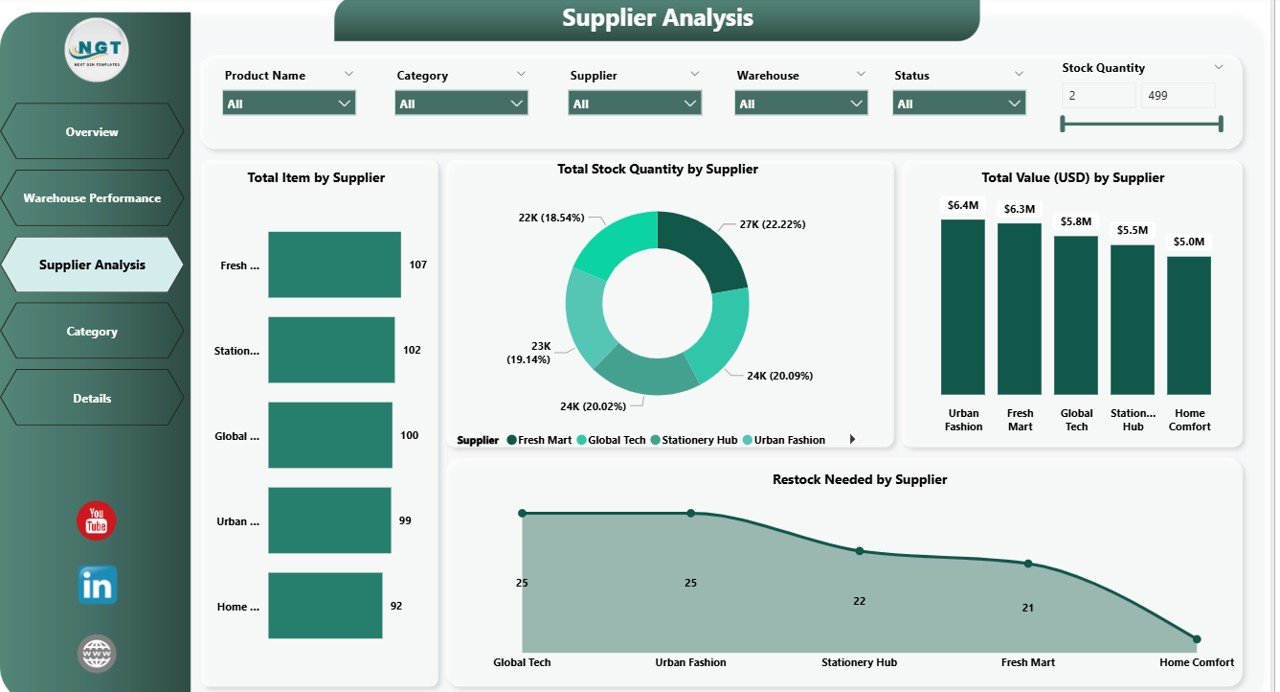
Supplier Analysis Page – Track supplier reliability, recently restocked items, and total quantities by vendor.
-
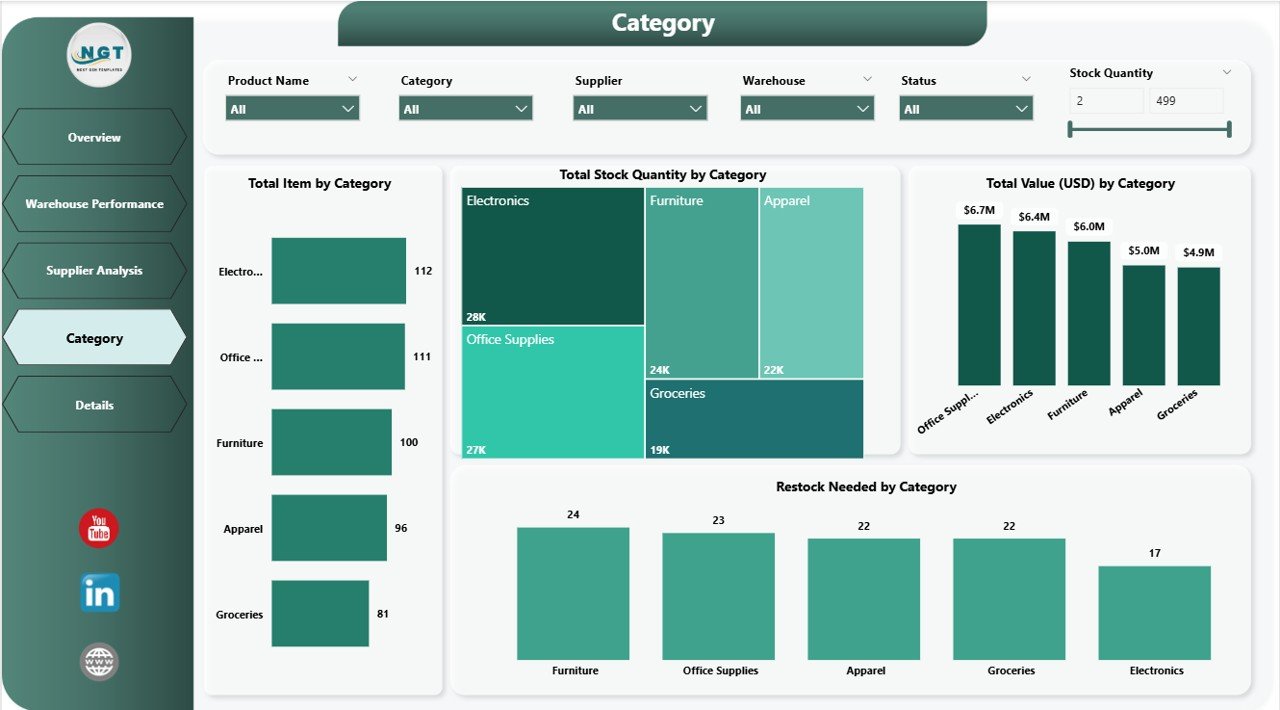
Category Page – Dive deep into category-wise performance to identify overstocked or low-stock items.
-
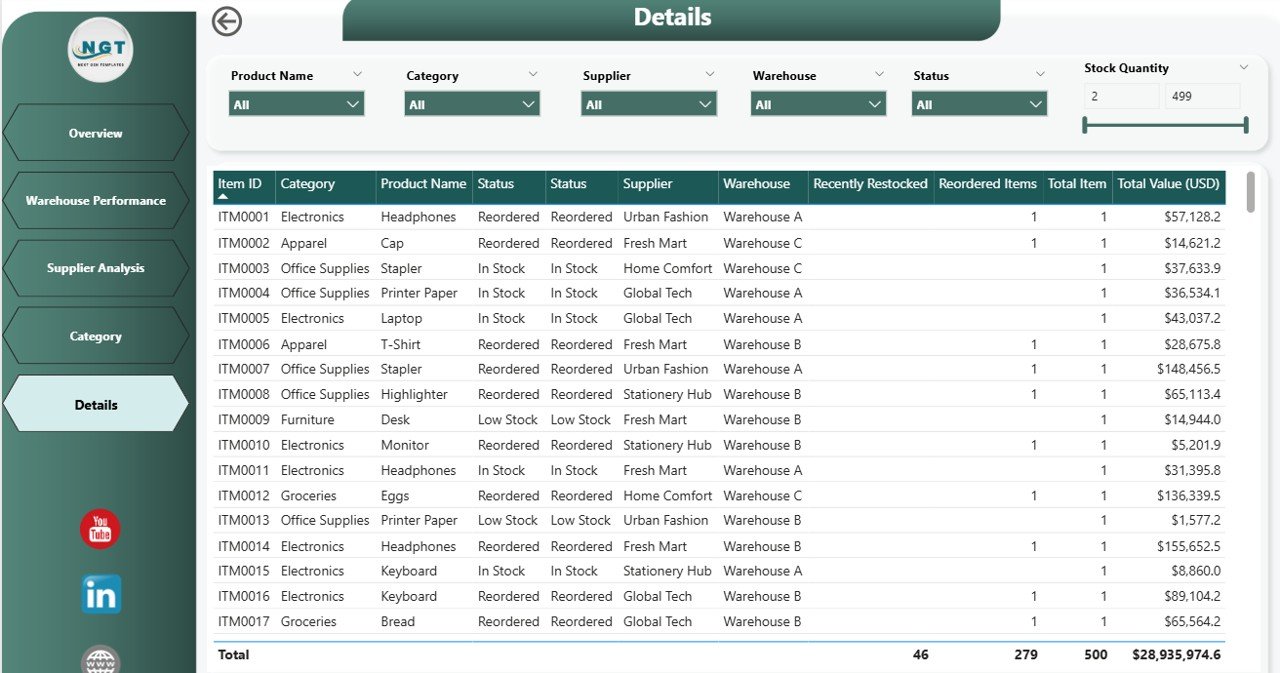
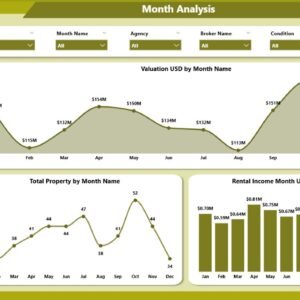
Details Page – Explore in-depth tables and trends with drill-down capabilities and slicers for advanced insights.
💡 Key benefits include:
-
Real-time tracking of stock levels, restocking needs, and supplier performance.
-
Customizable visuals & slicers to tailor insights across warehouses, suppliers, and categories.
-
Cost-saving insights through early identification of overstocking or stockouts.
-
One-click filters and clean visuals optimized for executives and operations managers.
-
Compatible with Excel data sources, allowing seamless integration with existing systems.
🎯 Perfect for operations managers, procurement teams, and inventory planners who want to monitor stock levels proactively and make data-driven decisions effortlessly.
🎥 Includes detailed YouTube walkthrough:
https://youtube.com/@PKAnExcelExpert
🔗 Click here to read the Detailed blog post


Reviews
There are no reviews yet.