
Managing international aid programs without real-time visibility is risky. When you are handling funding allocations, beneficiary reach, and multi-region programs, you cannot depend on scattered spreadsheets.
That’s exactly why the International Aid KPI Dashboard in Power BI is a game-changer.
This ready-to-use Power BI solution transforms structured Excel data into powerful, interactive visuals. Instead of reviewing dozens of static reports, you get instant insights into MTD, YTD, target achievement, and year-over-year comparisons — all in one centralized dashboard.
Now, let’s explore what makes this dashboard an essential performance management tool for aid organizations.
🚀 Key Feature of International Aid KPI Dashboard in Power BI
This dashboard is designed with clarity, accountability, and impact measurement in mind.
✔️ 3 Structured Dashboard Pages for complete performance visibility
✔️ MTD & YTD Tracking to monitor short-term and long-term impact
✔️ Target vs Actual Comparison with automatic calculations
✔️ CY vs PY Analysis to measure year-over-year progress
✔️ Visual KPI Icons (▲ Green / ▼ Red) for instant performance indication
✔️ Interactive Slicers for Month and KPI Group filtering
✔️ Drill-Through KPI Definition Page for transparency
✔️ Excel-Based Data Source for easy management
Because the dashboard combines cards, tables, and trend charts, leadership teams can identify performance gaps within seconds.
📊 What’s Inside the International Aid KPI Dashboard in Power BI
This product includes a fully structured Power BI file connected to Excel data sheets.
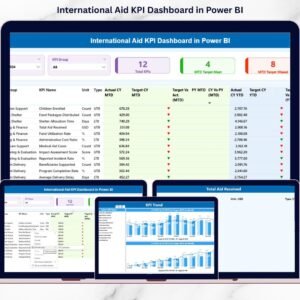
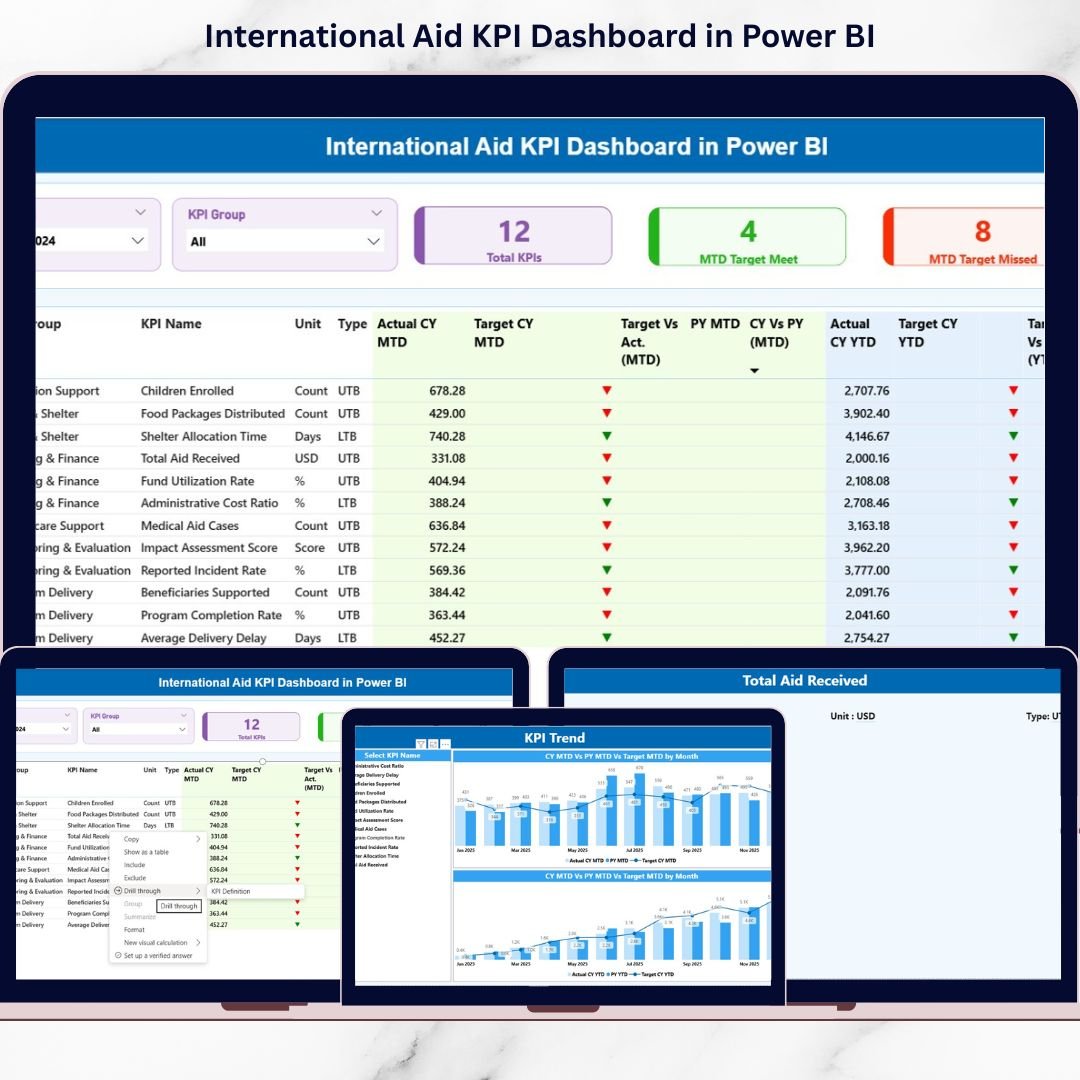
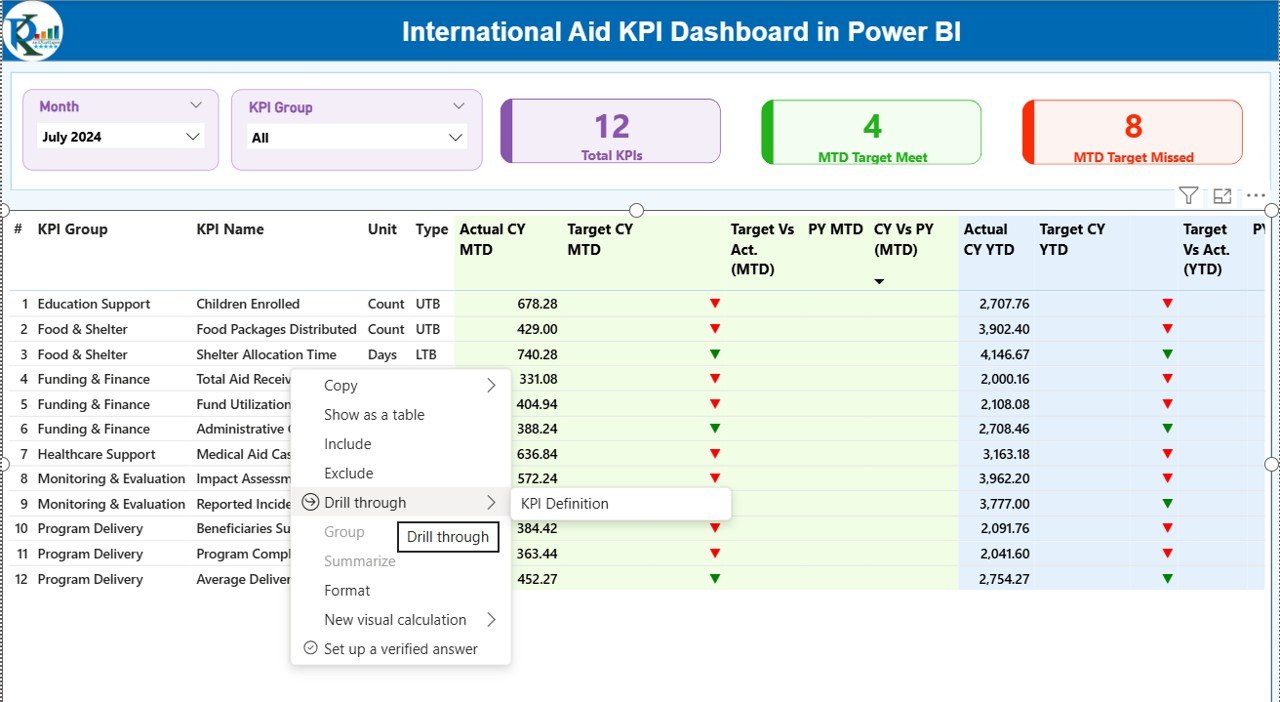
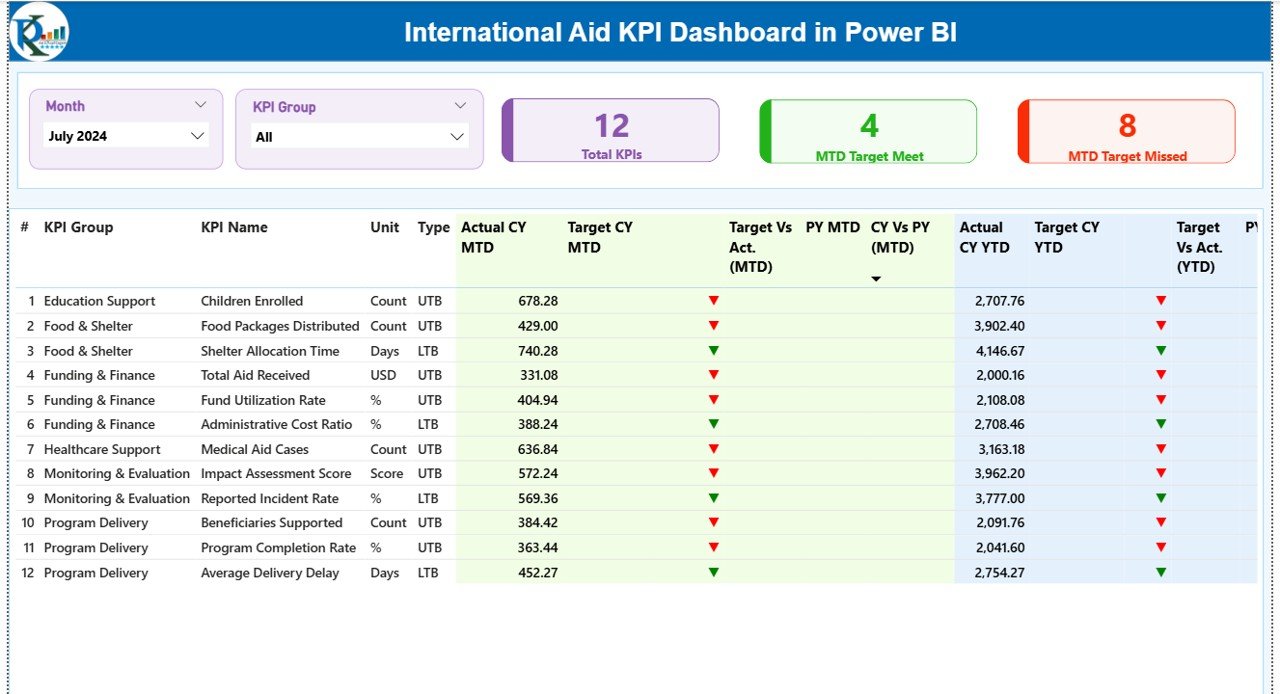
1️⃣ Summary Page – The Command Center
This page provides:
Month & KPI Group slicers
3 KPI Cards:
Total KPIs Count
MTD Target Meet Count
MTD Target Missed Count
Detailed KPI table including:
MTD Actual vs Target
YTD Actual vs Target
CY vs PY comparison
LTB / UTB type indicators
This page gives decision-makers instant clarity.
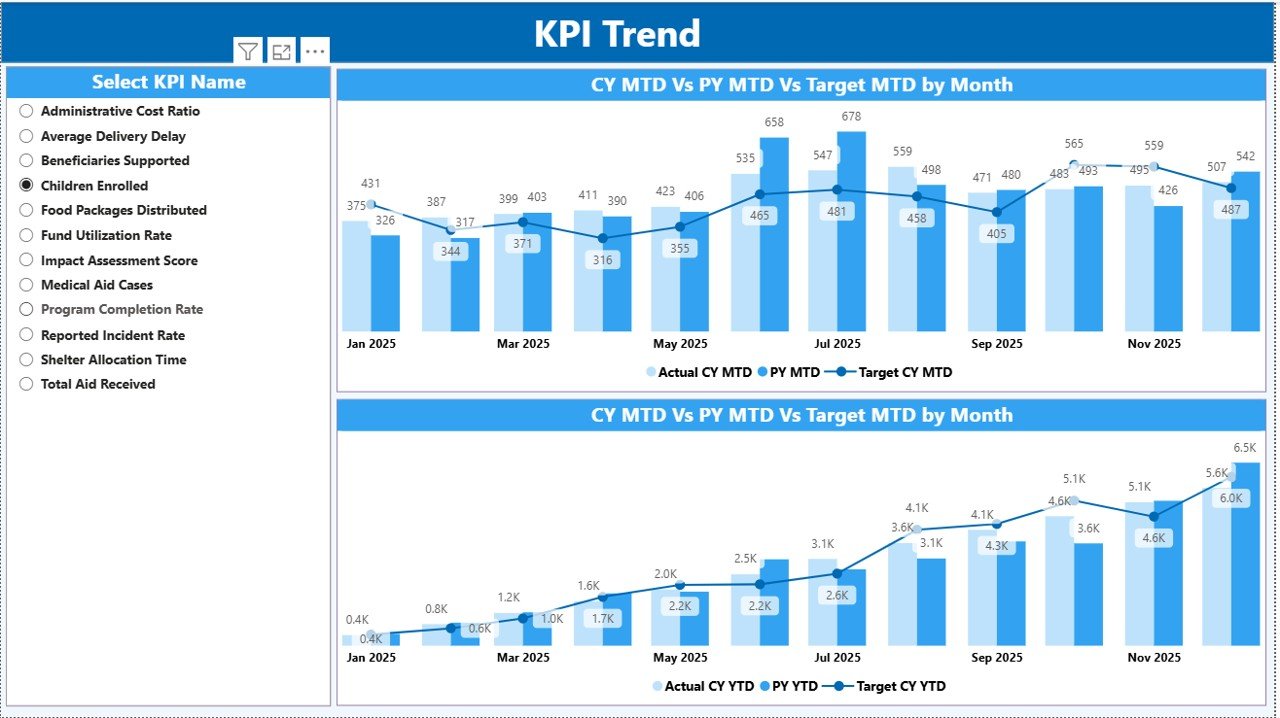
2️⃣ KPI Trend Page – Visual Performance Analysis
MTD Combo Chart (Actual, Target, Previous Year)
YTD Combo Chart (Actual, Target, Previous Year)
KPI Name slicer
This page helps managers detect patterns, trends, and seasonality.
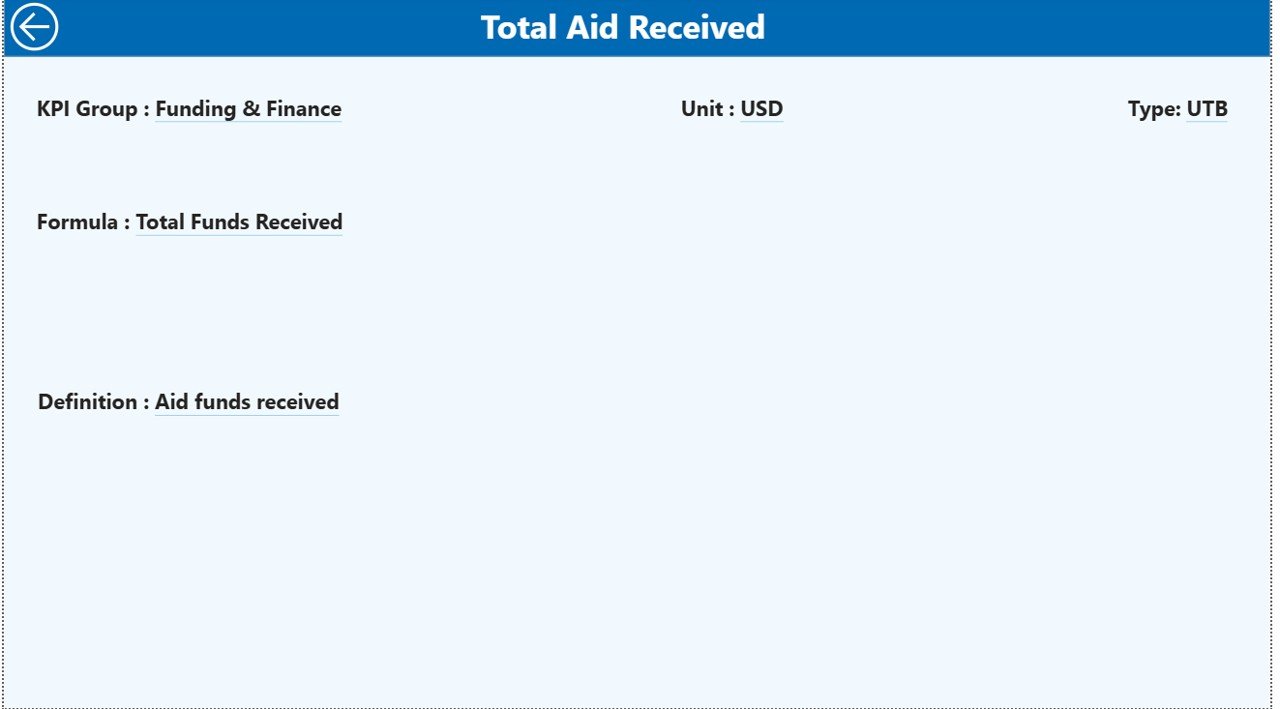
3️⃣ KPI Definition Page – Transparency Layer
Accessible via drill-through, this page shows:
KPI Formula
KPI Definition
Unit
KPI Group
Performance Type (LTB / UTB)
It ensures complete clarity and accountability.
⚙️ How to Use the International Aid KPI Dashboard in Power BI
Using this dashboard is simple and structured.
Step 1: Update Excel Data Source
Fill the three sheets:
Input_Actual – Enter MTD & YTD actual values
Input_Target – Enter MTD & YTD target values
KPI Definition – Define KPIs, formulas, and type
Step 2: Refresh Power BI
Click refresh, and all visuals update automatically.
Step 3: Analyze Performance
Filter by month
Select KPI group
Review green/red icons
Compare CY vs PY
Drill into KPI definitions
Within minutes, you gain complete program visibility.
🌍 Who Can Benefit from This International Aid KPI Dashboard in Power BI
This dashboard is ideal for:
🌎 International NGOs
🏛 Government Aid Agencies
💰 Donor-Funded Programs
🏥 Health & Education Projects
🚨 Emergency Relief Operations
📦 Food Distribution Programs
📊 Monitoring & Evaluation Teams
👩💼 Executive Leadership Teams
If your organization tracks KPIs related to funding, beneficiaries, service delivery, or operational efficiency, this dashboard is built for you.
It strengthens donor confidence, improves transparency, and supports data-driven decisions.
This International Aid KPI Dashboard in Power BI provides:
Clear performance monitoring
Automatic target comparisons
Visual trend analysis
Drill-through KPI transparency
Easy Excel integration
Structured reporting for donor meetings
If you want stronger accountability, better reporting clarity, and faster decision-making, this dashboard becomes your essential performance tool.
Click hare to read the Detailed blog post
Watch the step-by-step video tutorial:
Visit our YouTube channel to learn step-by-step video tutorials
Compatibility and Requirements
- Works in Power BI Desktop, which is free to download. Microsoft explains how to get it in Get Power BI Desktop.
- The data source is an Excel file with three sheets: Input_Actual, Input_Target and KPI Definition.
Frequently Asked Questions
Where do I enter my data?
Enter MTD and YTD actual values in the Input_Actual sheet and MTD and YTD targets in the Input_Target sheet. Define each KPI, its formula and its type in the KPI Definition sheet. Then click refresh in Power BI.
How many dashboard pages are there?
Three pages: Summary, KPI Trend and KPI Definition.
Can I filter by month or KPI group?
Yes. The Summary page has Month and KPI Group slicers. The KPI Trend page has a KPI Name slicer.
How do I see where a KPI is on or off target?
The Summary table shows green up arrows and red down arrows next to MTD and YTD actual versus target. It also shows the current year against the previous year and whether lower or upper is better (LTB / UTB).
Is there an Excel version?
Yes. See the International Aid KPI Dashboard in Excel.
Related Aid and Development Templates
- International Aid KPI Dashboard in Excel: the same dashboard in Excel
- Humanitarian Aid KPI Dashboard in Power BI: KPI tracking for humanitarian programs
- International Development KPI Dashboard in Power BI: a Power BI KPI dashboard for development work
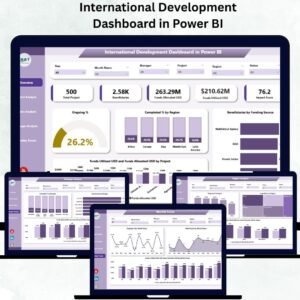
- International Development Dashboard in Power BI: a wider development dashboard
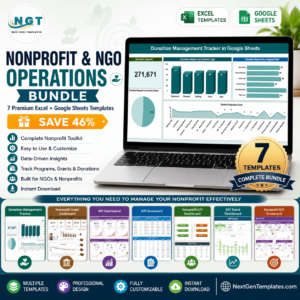
- Nonprofit & NGO Operations Bundle: 7 templates for NGO operations in one download
Browse all Power BI KPI dashboards.