
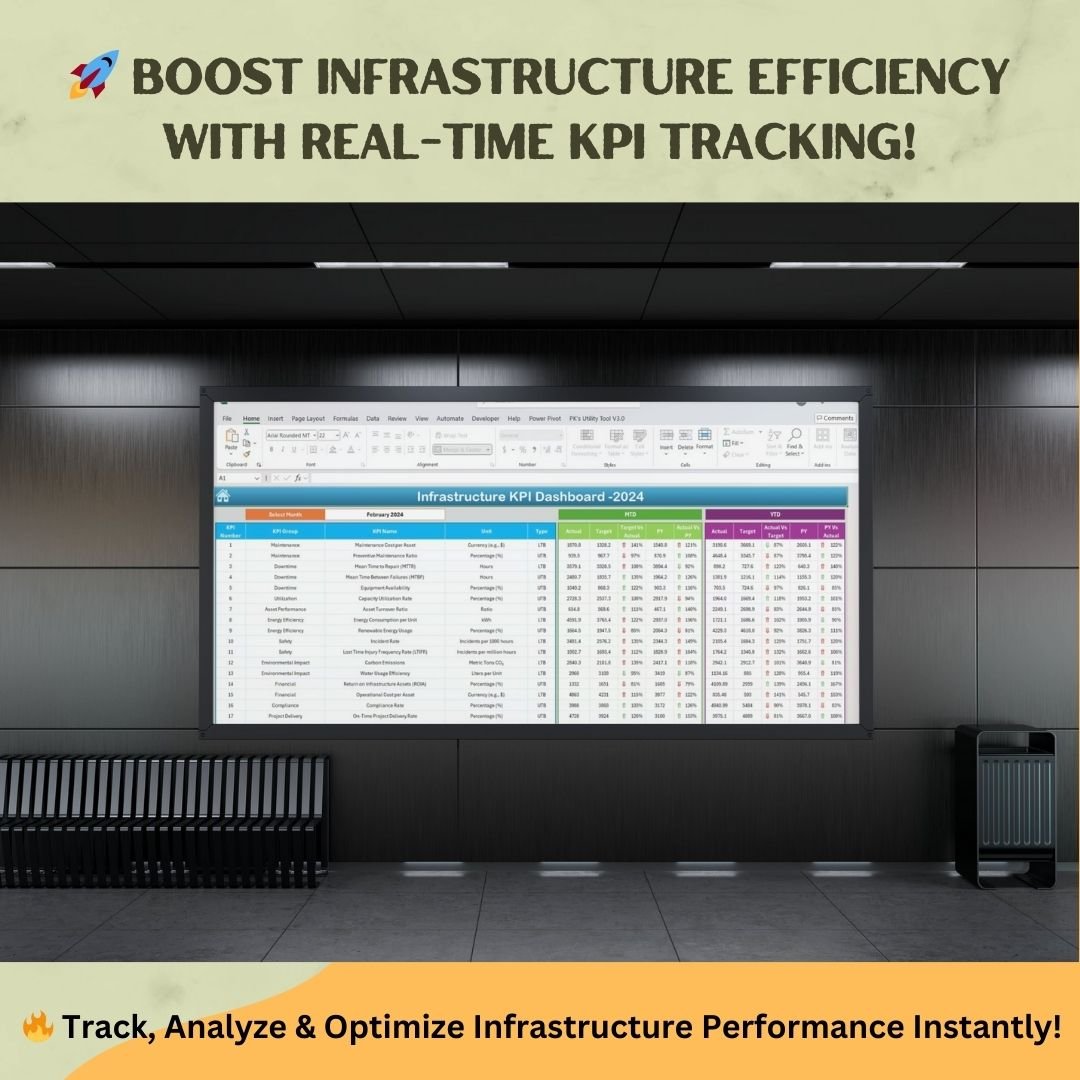


 Track Key Infrastructure Metrics – Monitor maintenance, safety, energy efficiency, and financial KPIs in one place.
 Real-Time Performance Analysis – Get MTD & YTD comparisons with dynamic trend charts.
 Instant Download & Ready to Use – No complex setup required!
Managing infrastructure performance is essential for ensuring operational efficiency, asset utilization, and risk mitigation. The Infrastructure KPI Dashboard in Excel is a comprehensive solution designed to track key performance indicators (KPIs) in various aspects of infrastructure management, including maintenance, energy efficiency, financial performance, safety, and compliance.
This Excel-based Infrastructure KPI Dashboard simplifies data visualization and performance tracking, enabling real-time insights for better decision-making. Whether you’re monitoring maintenance costs, energy usage, or compliance metrics, this tool helps you stay on top of your infrastructure goals effortlessly.
 Key Features of the Infrastructure KPI Dashboard in Excel
This ready-to-use dashboard is organized into seven essential worksheets, each designed for a specific function in tracking, analyzing, and managing KPIs efficiently.
1. Home Sheet – Quick Navigation

The Home Sheet serves as the starting point, offering easy access to all essential sections of the dashboard. Navigation Buttons: Quickly jump to KPI sheets with one click. User-Friendly Interface: Simple layout for seamless access to performance data.
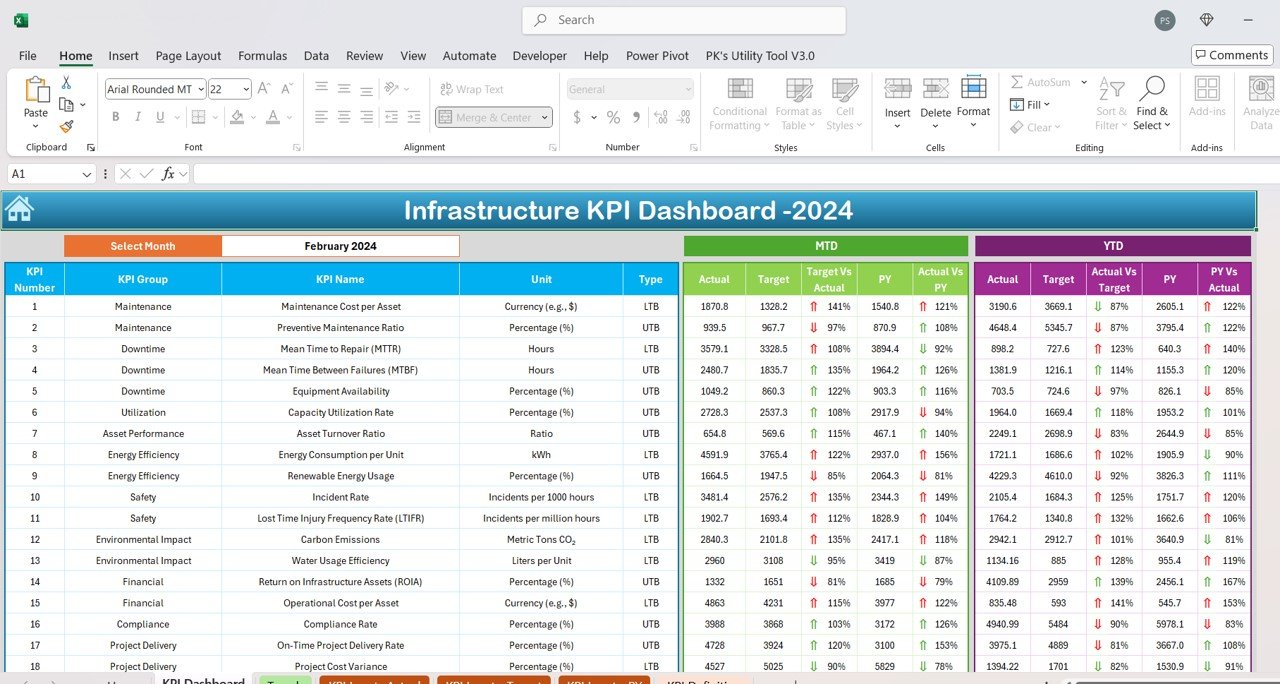
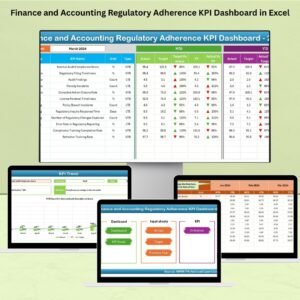
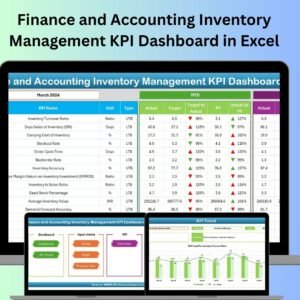
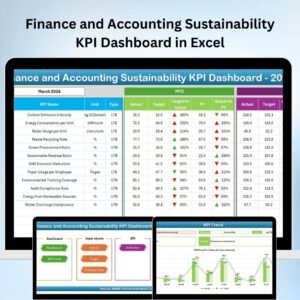
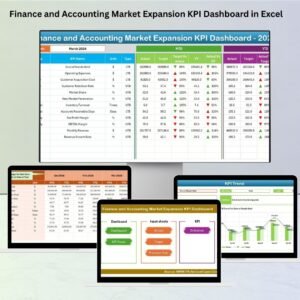
2. Dashboard Sheet – Real-Time KPI Insights
The Dashboard Sheet presents a consolidated view of your infrastructure KPIs, helping you make data-driven decisions. Dynamic Dropdown Selection: Choose a specific month to view performance updates. MTD & YTD Analysis: Track Month-to-Date (MTD) and Year-to-Date (YTD) KPI performance. Comparative Metrics:
- Actual vs. Target analysis to evaluate goal achievements.
- Current vs. Previous Year (PY) comparison to analyze yearly progress. Conditional Formatting: Up/down arrows highlight performance improvements or declines.
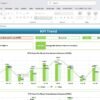
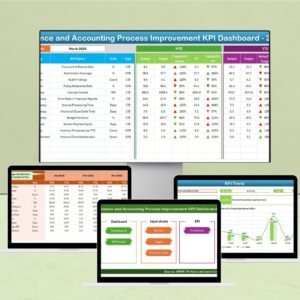
3. KPI Trend Sheet – In-Depth Performance Tracking
The KPI Trend Sheet enables historical trend analysis of each KPI to spot patterns and make proactive decisions. KPI Selection Dropdown: Choose a specific KPI to view trends over time. Detailed KPI Information:
- KPI Group & Type: Categorization for easy reference.
- Unit & Formula: Ensures consistency in KPI calculations.
- Definition: Helps teams understand KPI relevance. Visual Trend Charts:
- MTD and YTD Trends displayed in interactive graphs.
- Performance shifts over time for effective strategy adjustments.
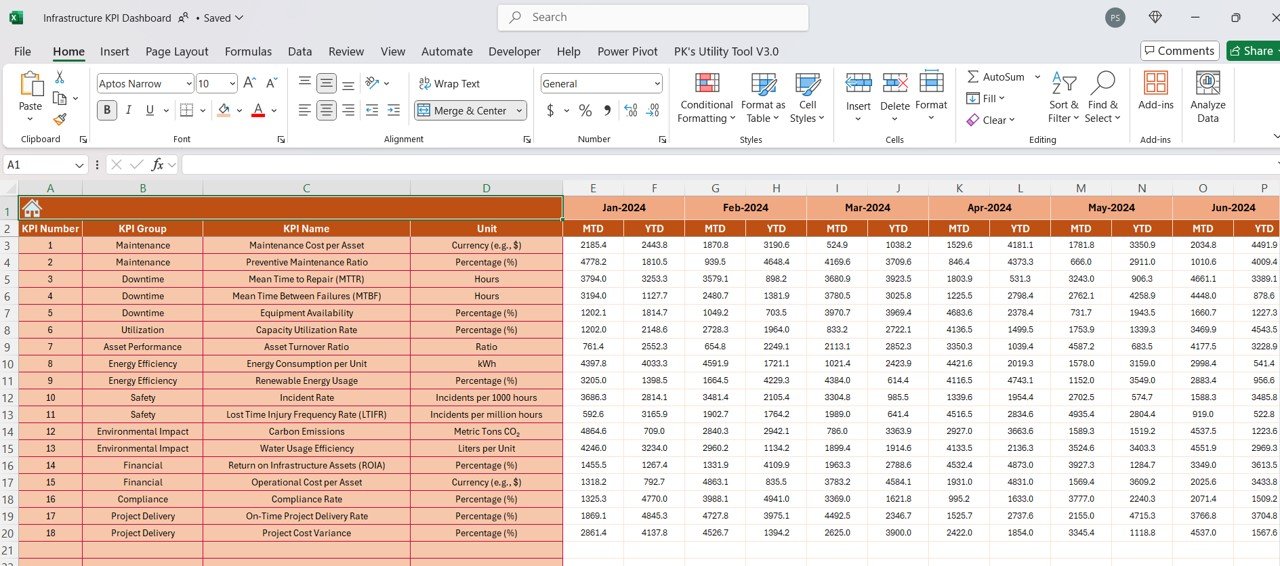
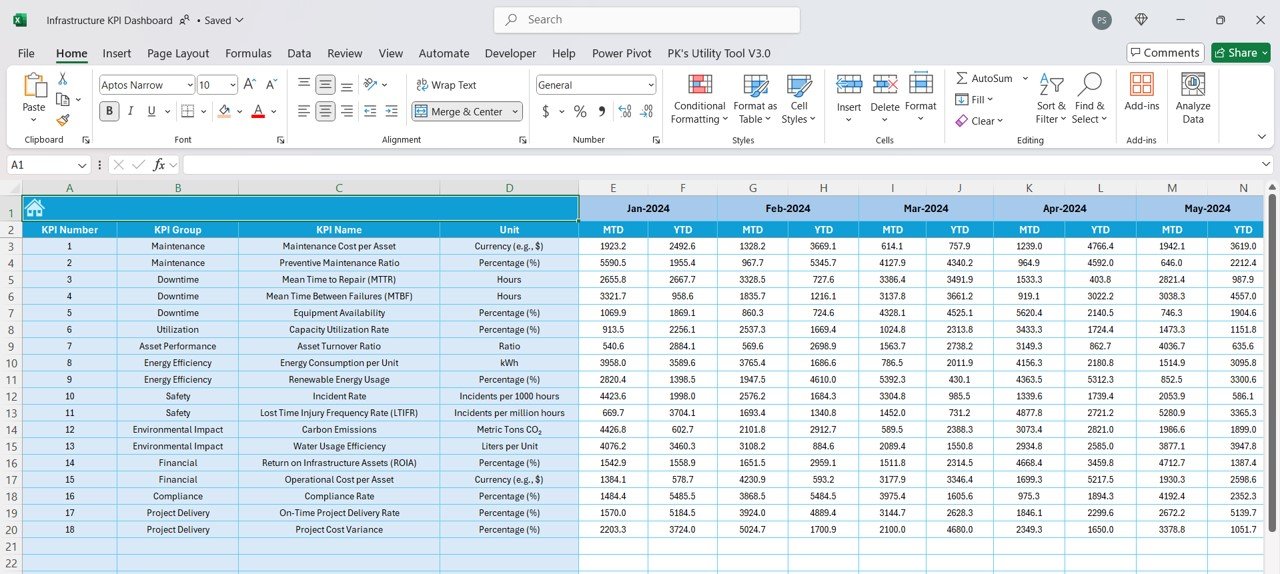
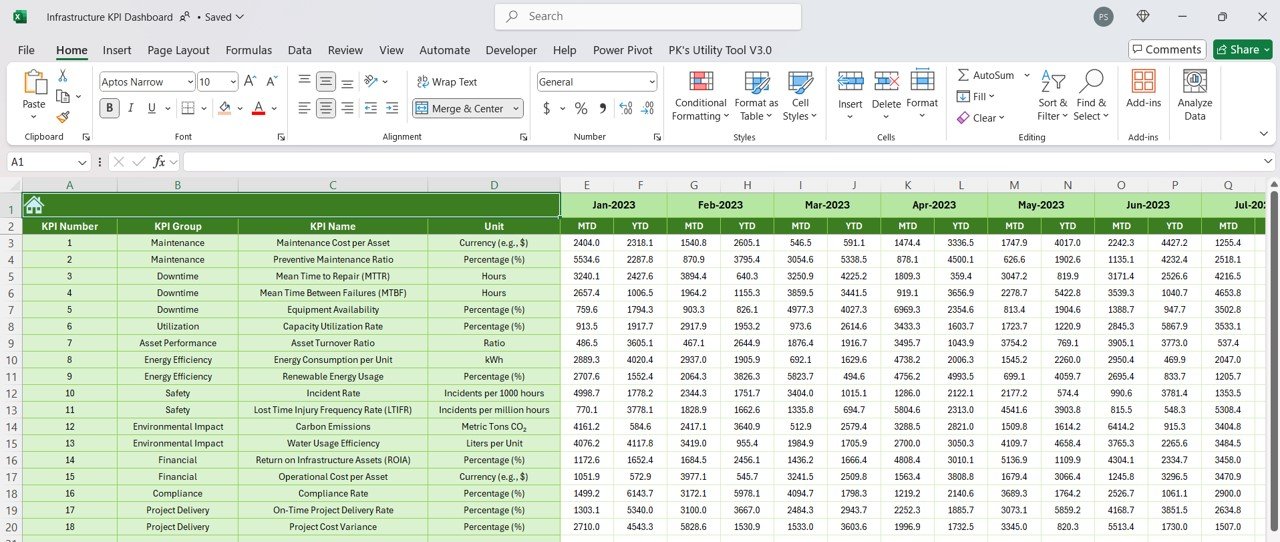
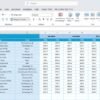
4. Actual Numbers Input Sheet – Accurate Data Entry
To ensure data consistency, the Actual Numbers Input Sheet centralizes KPI updates. User-Friendly Format: Simply enter actual values for each KPI. Auto-Adjusting Calendar: Select the starting month (cell E1) to automatically update KPI data fields. Seamless Dashboard Integration: Entered data instantly updates the main dashboard.
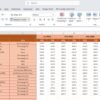
5. Target Sheet – Set & Track Performance Goals
The Target Sheet allows goal setting for each KPI and ensures that performance stays aligned with organizational objectives. MTD & YTD Target Input: Define monthly and yearly goals. Benchmark Performance: Compare actual values against defined targets. Customizable Goals: Easily update targets based on changing business needs.
6. Previous Year Data Sheet – Yearly Benchmarking
The Previous Year Data Sheet enables comparative analysis, ensuring you track growth and efficiency over time. Enter Last Year’s KPI Data: Compare MTD and YTD figures with previous years. Trend Analysis: Identify strengths, weaknesses, and opportunities for improvement.
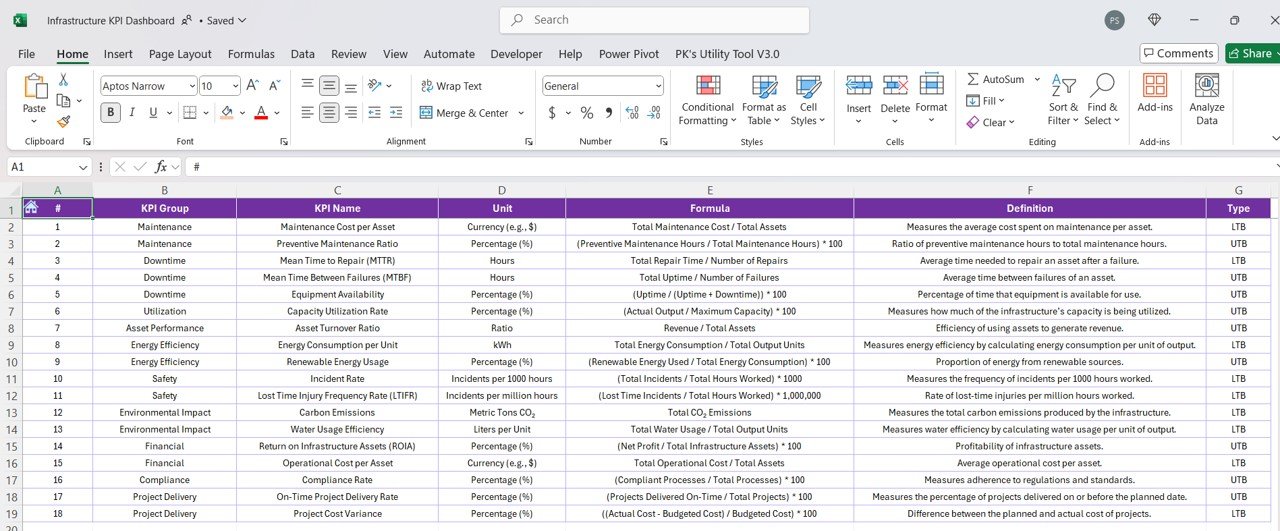
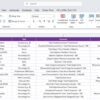
7. KPI Definition Sheet – Standardized Performance Metrics
The KPI Definition Sheet acts as a central reference guide for all tracked metrics. KPI Name & Group: Ensures structured tracking. Measurement Unit & Formula: Maintains consistency in performance calculations. Clear Definitions: Helps all team members understand KPI significance and usage.
 Who Can Benefit from This KPI Dashboard?
This Infrastructure KPI Dashboard is perfect for: Infrastructure Managers & Engineers – Optimize asset utilization and maintenance costs. Facility Management Teams – Track energy efficiency, downtime, and operational performance. Finance & Compliance Officers – Monitor budget performance and regulatory compliance. Project Managers – Measure on-time delivery and cost efficiency.
 Why Choose This Infrastructure KPI Dashboard?
Fully Automated: No manual calculations needed! The dashboard automatically updates KPI trends. Easy to Use: No coding or advanced Excel skills required. Customizable: Modify KPI categories, formulas, and target settings based on your needs. Interactive Visuals: Charts, conditional formatting, and dropdowns provide clear insights. Instant Download & Lifetime Access: Get access immediately and use it forever!
Click hare to read the Detailed blog post
Visit our YouTube channel to learn step-by-step video tutorials


Reviews
There are no reviews yet.