Managing employee performance, workforce distribution, and compensation costs has become one of the most critical responsibilities for modern HR departments. Organizations must continuously monitor employee productivity, salary expenses, bonuses, departmental performance, and regional workforce trends to maintain efficiency and control operational costs.HR Employee Performance Analytics Dashboard in Google Sheets
However, many HR teams still rely on scattered spreadsheets and manual reports to manage workforce analytics. As a result, analyzing employee data becomes time-consuming and inefficient. Important insights related to employee distribution, department productivity, and salary trends often remain hidden in complex datasets.
To solve this challenge, we created the HR Employee Performance Analytics Dashboard in Google Sheets — a powerful and ready-to-use workforce analytics solution designed to help HR professionals transform raw employee data into meaningful business insights.
This interactive Google Sheets dashboard allows organizations to track employee performance, analyze workforce costs, monitor department productivity, and evaluate workforce distribution across different regions. By using clear visual charts, KPI indicators, and dynamic filters, HR teams can instantly analyze large volumes of workforce data.
Because Google Sheets supports real-time collaboration and automated calculations, HR managers can easily update employee data and instantly view updated insights across the dashboard. Instead of reviewing multiple HR reports, organizations can access all important workforce metrics in one centralized analytics platform.
This makes HR reporting faster, smarter, and more efficient.
🚀 Key Feature of HR Employee Performance Analytics Dashboard in Google Sheets
This dashboard is designed to simplify HR analytics and provide actionable workforce insights.
📊 Interactive Workforce Analytics Dashboard
Visual charts and KPI indicators provide instant insights into employee performance, salary costs, and workforce distribution.
👥 Comprehensive Workforce Monitoring
Track important HR metrics such as total employees, salary cost, bonus distribution, and average performance ratings.
🌍 Regional Workforce Analysis
Analyze employee distribution, salary expenses, and HR costs across different global regions.
🏢 Department-Level HR Insights
Evaluate employee count, salary expenses, and bonus distribution across multiple departments.
📈 Employee Nationality & Diversity Insights
Monitor workforce diversity and employee distribution by nationality.
📅 Monthly Workforce Trend Analysis
Track workforce growth, hiring trends, and compensation patterns over time.
🎯 HR KPI Monitoring Cards
Quickly view important HR metrics such as Total Employees, Total Salary Cost, Bonus Distribution, and Average Performance Rating.
🔎 Dynamic HR Filters & Slicers
Filter HR data instantly by gender, country, region, department, job level, employee name, or city.
⚡ Real-Time Collaboration in Google Sheets
Multiple HR managers can update and analyze workforce data simultaneously.
📊 Clear HR Data Visualization
Transform complex HR data into easy-to-understand visual insights.
📊 What’s Inside the HR Employee Performance Analytics Dashboard in Google Sheets
This dashboard includes five powerful analytical pages that help HR teams analyze workforce data from different perspectives.
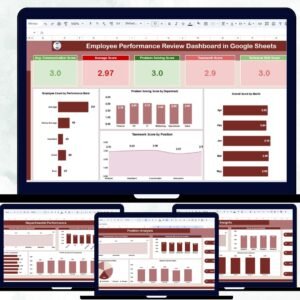
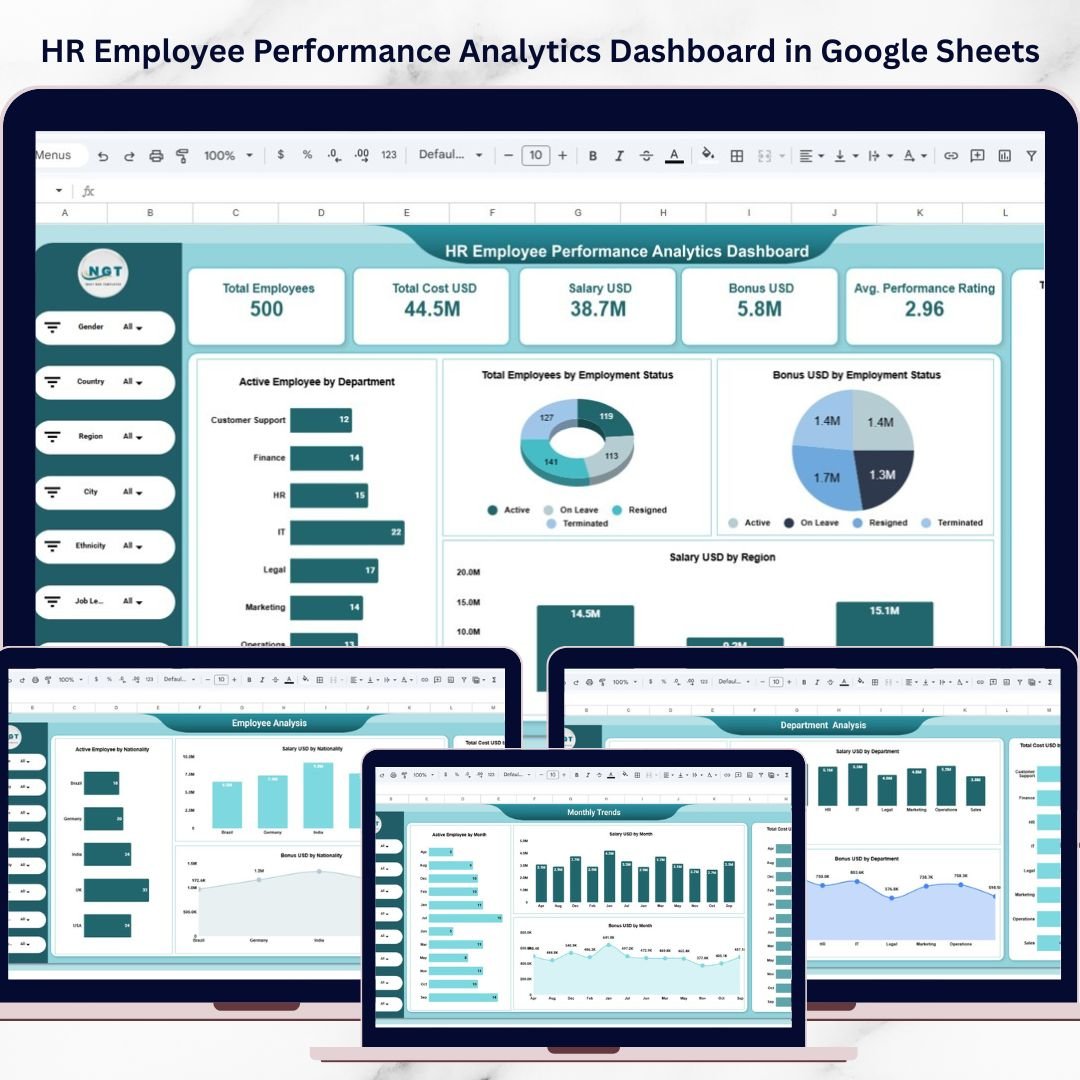
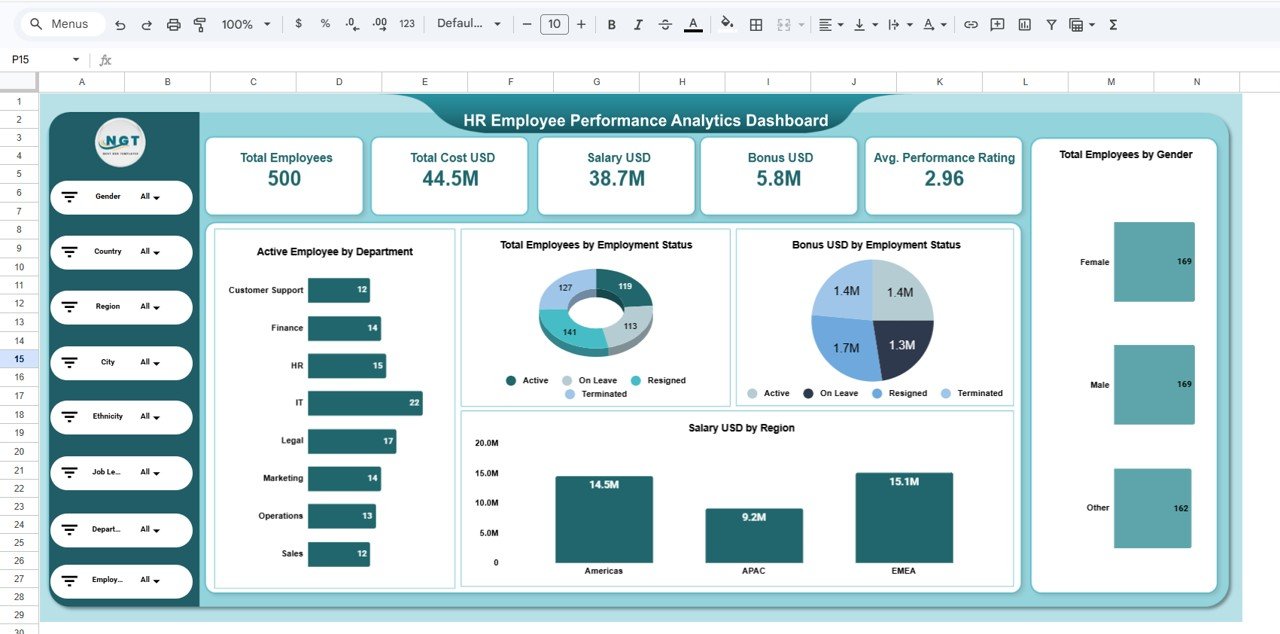
1️⃣ HR Overview Dashboard
The Overview Page provides a complete snapshot of workforce metrics and employee distribution.
Key KPI Cards:
-
Total Employees
-
Total Cost (USD)
-
Total Salary (USD)
-
Total Bonus (USD)
-
Average Performance Rating
Charts included:
-
Active Employees by Department
-
Employee Status Distribution
-
Bonus Distribution by Employment Status
-
Salary by Region
-
Employee Distribution by Gender
This page helps HR leaders quickly understand workforce structure and overall HR performance.
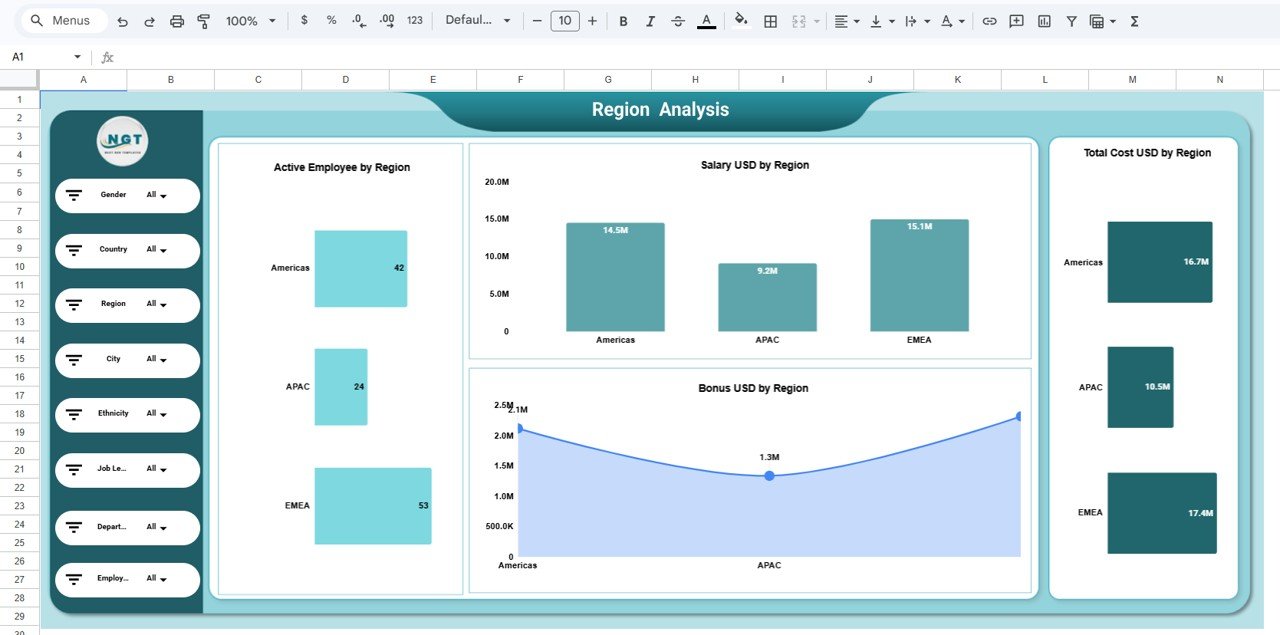
2️⃣ Region Analysis Dashboard
Organizations often operate across multiple global regions. This page evaluates workforce distribution and HR costs across regions.
Charts included:
-
Active Employees by Region
-
Salary Distribution by Region
-
Bonus Distribution by Region
-
Total HR Cost by Region
This analysis helps HR managers identify regions with high workforce costs and salary expenses.
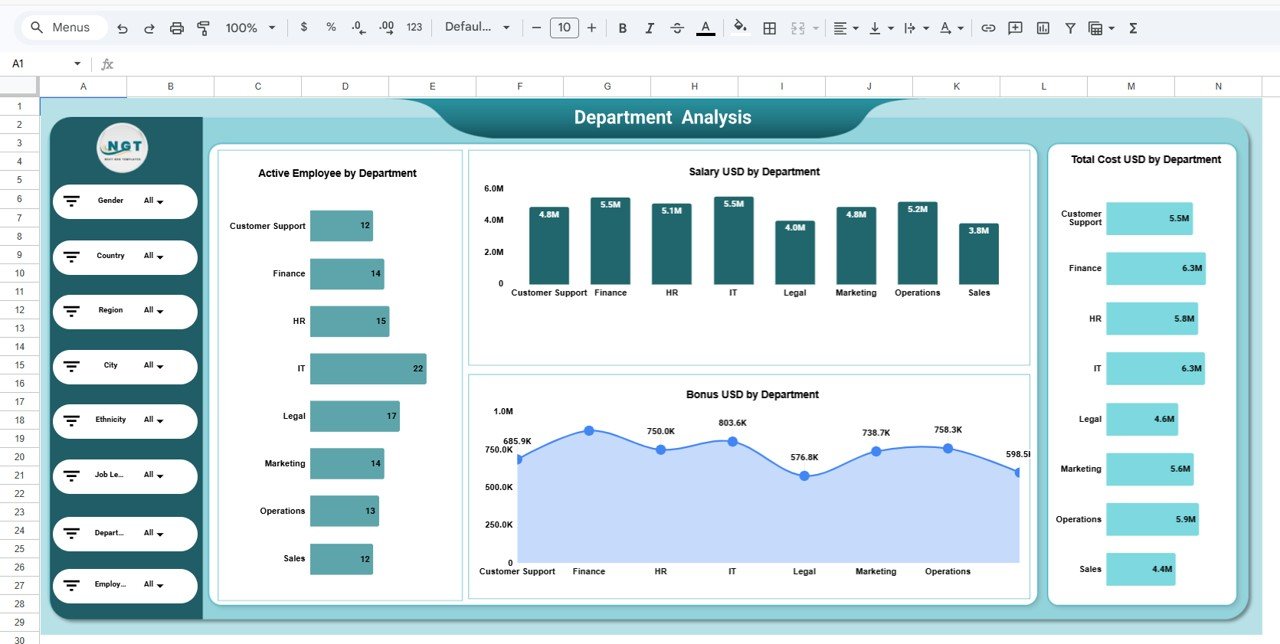
3️⃣ Department Analysis Dashboard
Departments play a critical role in organizational productivity. This page analyzes workforce distribution and compensation across departments.
Charts included:
-
Active Employees by Department
-
Salary Cost by Department
-
Bonus Distribution by Department
-
Total HR Cost by Department
Departments analyzed include Finance, HR, IT, Marketing, Operations, Legal, Customer Support, and Sales.
This helps HR leaders evaluate department productivity and workforce costs.
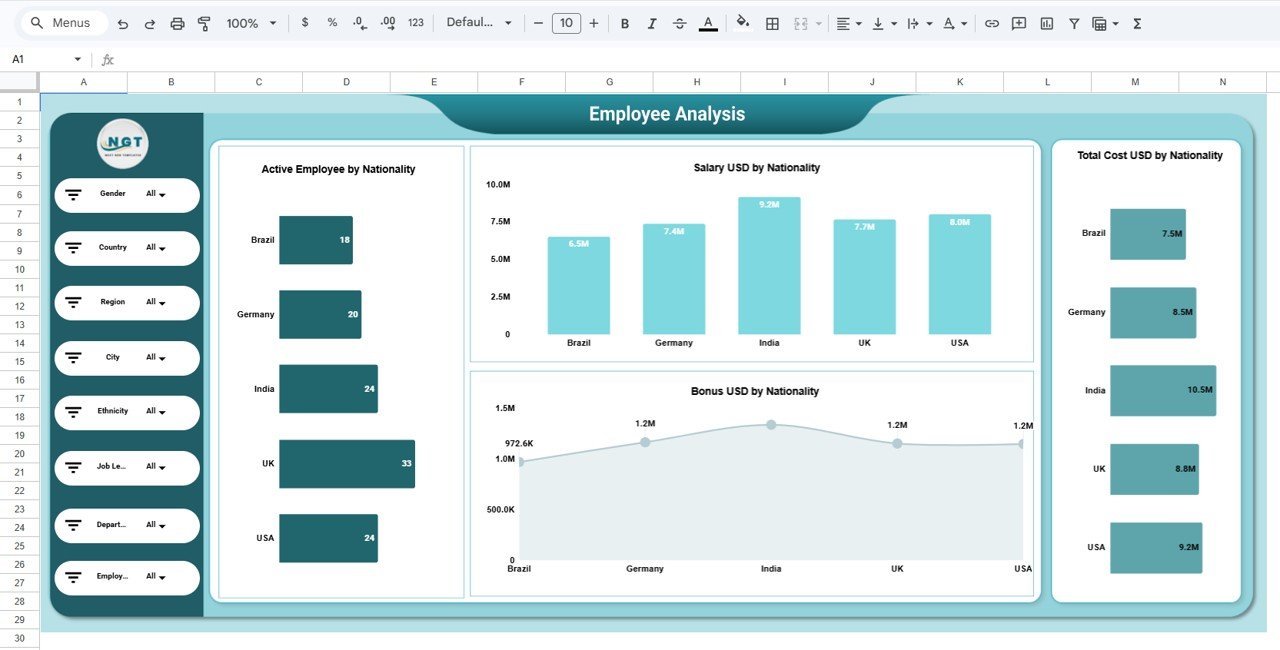
4️⃣ Employee Analysis Dashboard
Organizations with global teams must monitor workforce diversity and employee distribution across different nationalities.
Charts included:
-
Active Employees by Nationality
-
Salary Distribution by Nationality
-
Bonus Distribution by Nationality
-
Total HR Cost by Nationality
This analysis helps organizations better understand workforce diversity and compensation patterns.
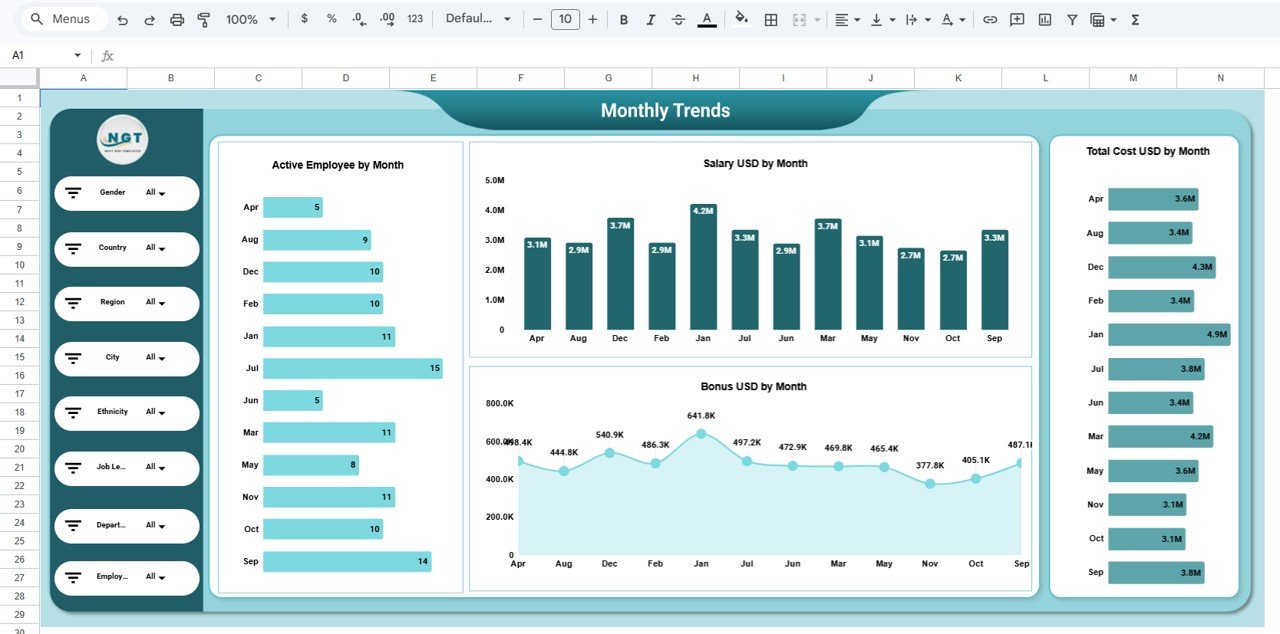
5️⃣ Monthly Trends Dashboard
Workforce size, salary costs, and bonus distribution often change over time. This page tracks HR metrics across months.
Charts included:
-
Active Employees by Month
-
Salary Distribution by Month
-
Bonus Distribution by Month
-
Total HR Cost by Month
This allows HR teams to identify hiring trends and seasonal workforce patterns.
⚙️ How to Use the HR Employee Performance Analytics Dashboard in Google Sheets
Using this dashboard is simple and efficient.
1️⃣ Enter employee data into the Data Sheet.
2️⃣ Update information such as salary, bonus, department, region, and performance ratings.
3️⃣ Use interactive filters to analyze workforce data by department, region, job level, or employee name.
4️⃣ Monitor KPI cards and charts to identify workforce trends.
5️⃣ Use insights to optimize HR planning and workforce management.
Even HR professionals with basic Google Sheets knowledge can easily manage workforce analytics using this dashboard.
👥 Who Can Benefit from This HR Employee Performance Analytics Dashboard
This dashboard is extremely valuable for organizations looking to improve HR analytics and workforce planning.
👨💼 HR Managers – Monitor employee performance, salary costs, and workforce distribution.
📊 HR Analysts – Analyze workforce data and identify HR trends.
🏢 Department Managers – Evaluate team productivity and employee distribution.
💰 Finance Teams – Track salary and bonus expenses.
👔 Executives & Leadership Teams – Make data-driven workforce planning decisions.
Click here to read the Detailed blog post
Watch the step-by-step video tutorial:
Visit our YouTube channel to learn step-by-step video tutorials