Human Resources (HR) is the backbone of every organization. From managing employee performance and training to monitoring attendance and engagement, HR plays a crucial role in ensuring that the workforce remains motivated, productive, and aligned with organizational goals. However, as companies grow, HR teams often struggle to manage scattered reports, manual spreadsheets, and time-consuming analysis.
The solution? A ready-to-use HR Dashboard in Excel.
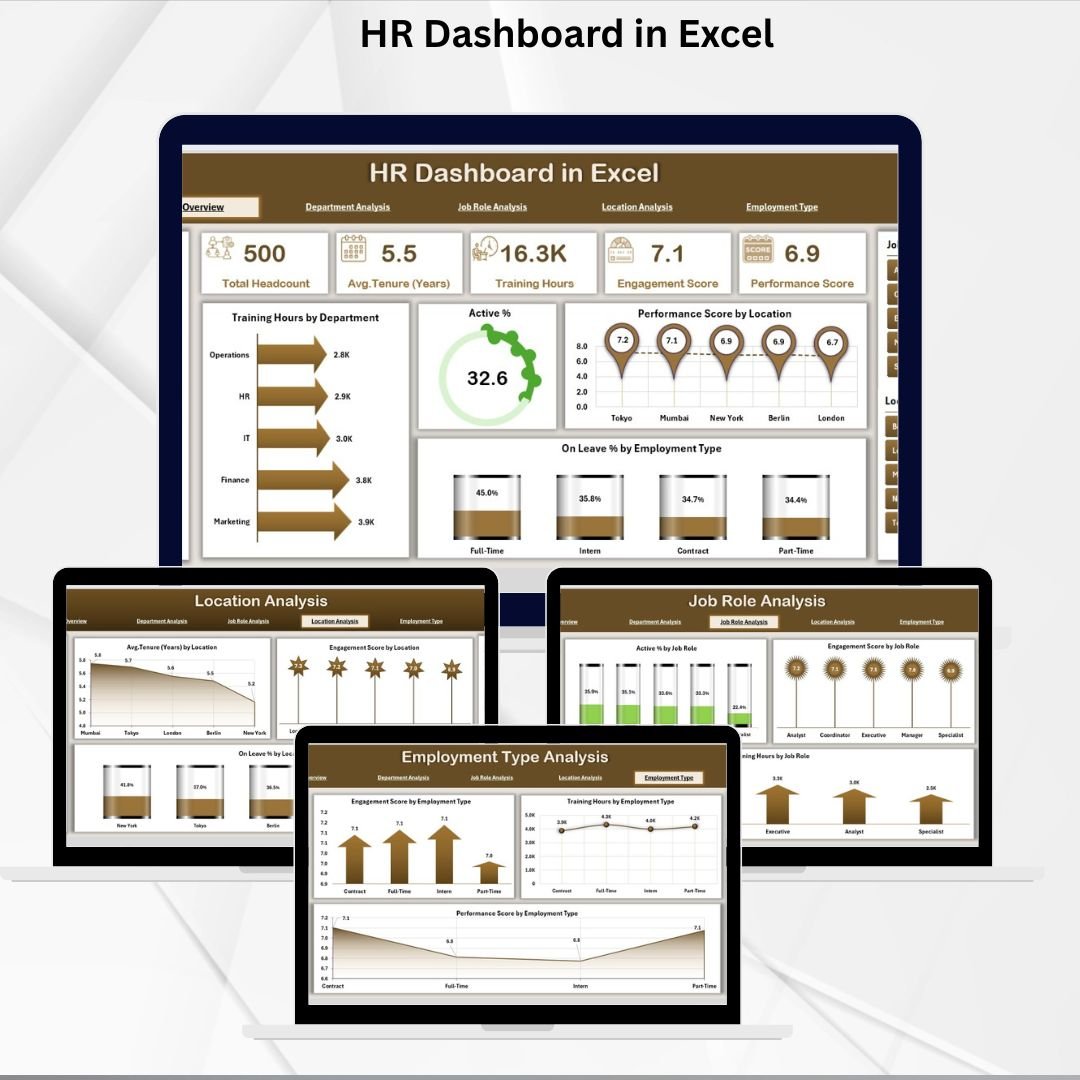
This dashboard template transforms raw employee data into interactive visuals, KPIs, and insights that HR managers and business leaders can use for faster and smarter decision-making. Built entirely in Excel, it is cost-effective, customizable, and easy to use—making it an ideal choice for organizations of all sizes.
🌟 What Is an HR Dashboard in Excel?
An HR Dashboard in Excel consolidates multiple HR metrics into a single, interactive interface. It eliminates the hassle of flipping between reports or files by displaying all key insights in one place. With real-time updates and automated charts, HR professionals can quickly monitor:
-
Training hours across departments
-
Performance and engagement scores
-
Attendance and leave trends
-
Active employees by role, type, or location
-
Workforce distribution and tenure
Instead of relying on assumptions, managers gain data-driven clarity about their teams, enabling proactive decision-making.
📊 Key Features of the HR Dashboard
Page Navigator
-
Located on the left side of the dashboard.
-
Lets users move seamlessly across analytical pages.
-
Saves time and enhances usability.
Five Analytical Pages
-
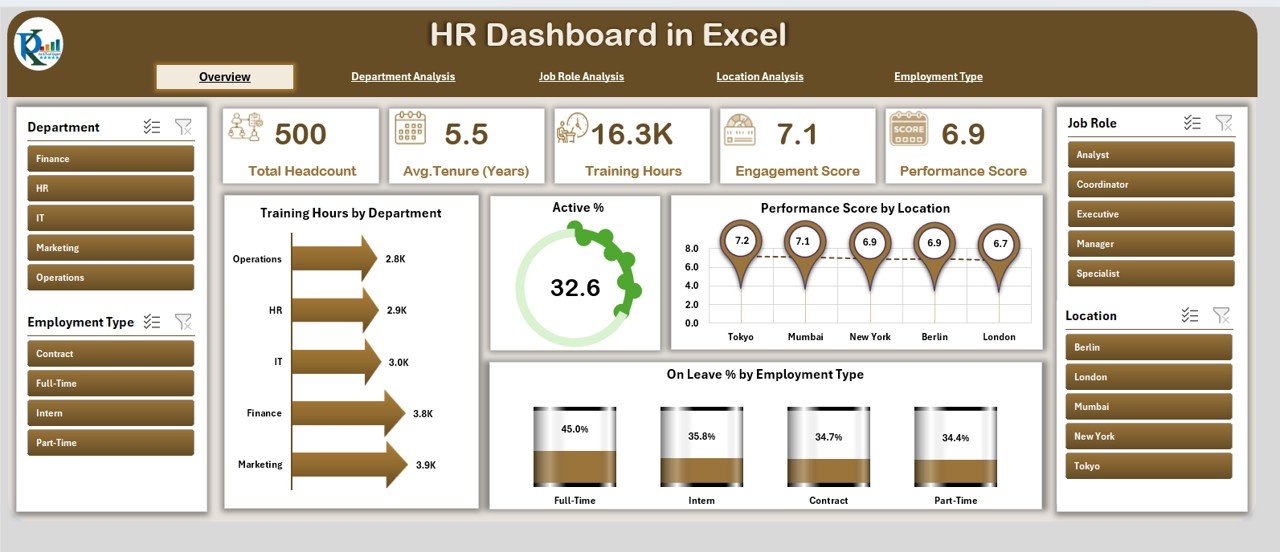
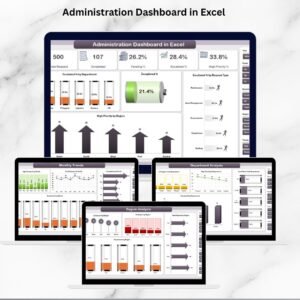
Overview Page
-
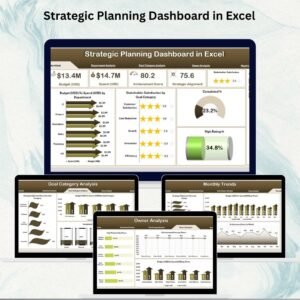
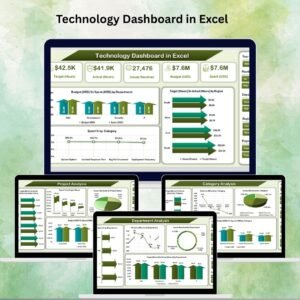
Displays 5 quick KPI cards and 4 charts, including Training Hours by Department, Active % of Employees, Performance Score by Location, and On Leave % by Employee Type.
-
-
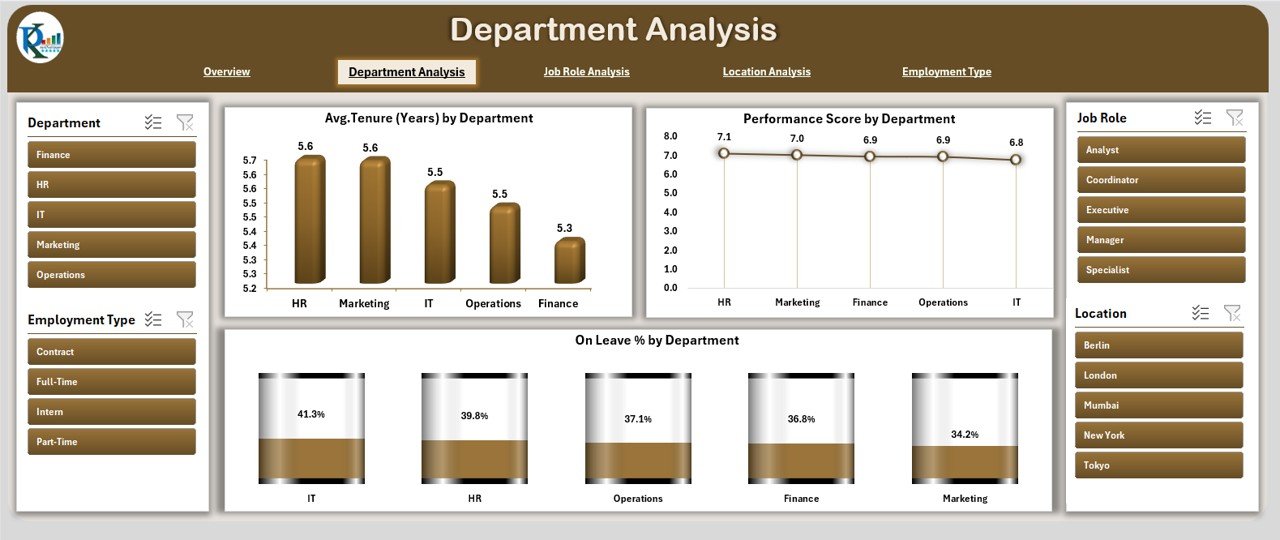
Department Analysis
-
Focuses on workforce trends by department.
-
Charts include Average Tenure, Performance Score, and Leave % by Department.
-
-
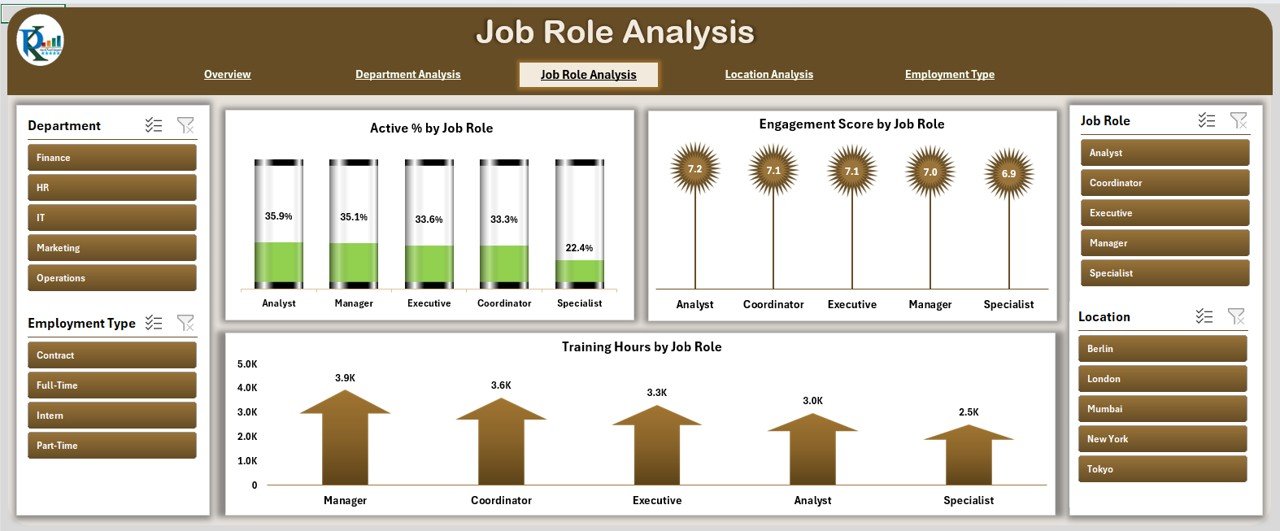
Job Role Analysis
-
Helps understand performance and training at the job role level.
-
Charts include Engagement Score, Active %, and Training Hours by Role.
-
-
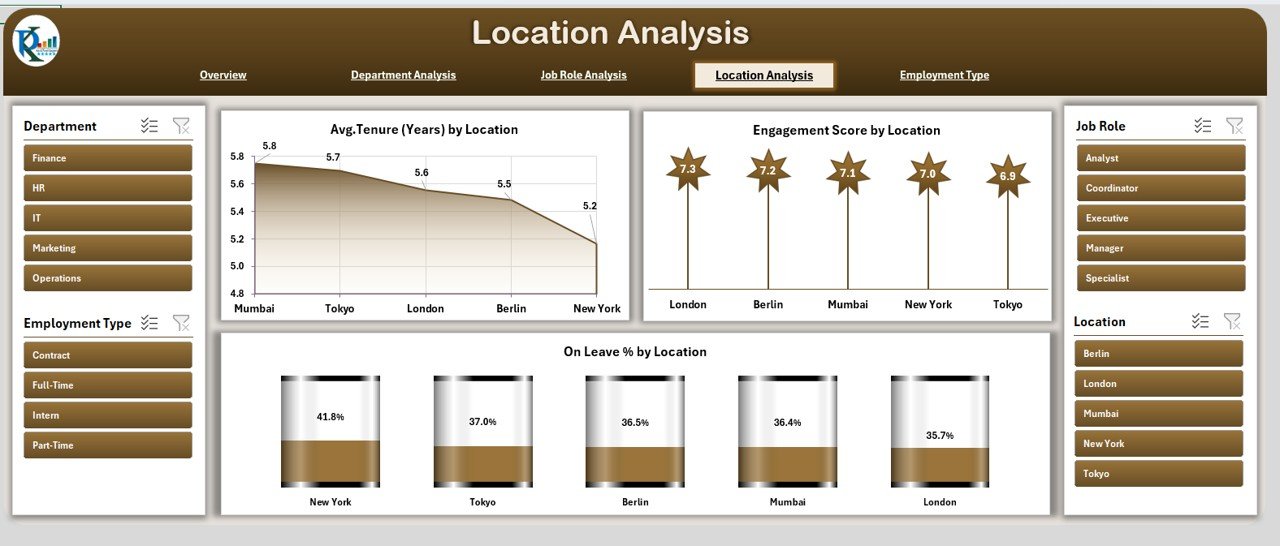
Location Analysis
-
Compares performance across offices or branches.
-
Charts include Tenure, Engagement, and Leave % by Location.
-
-
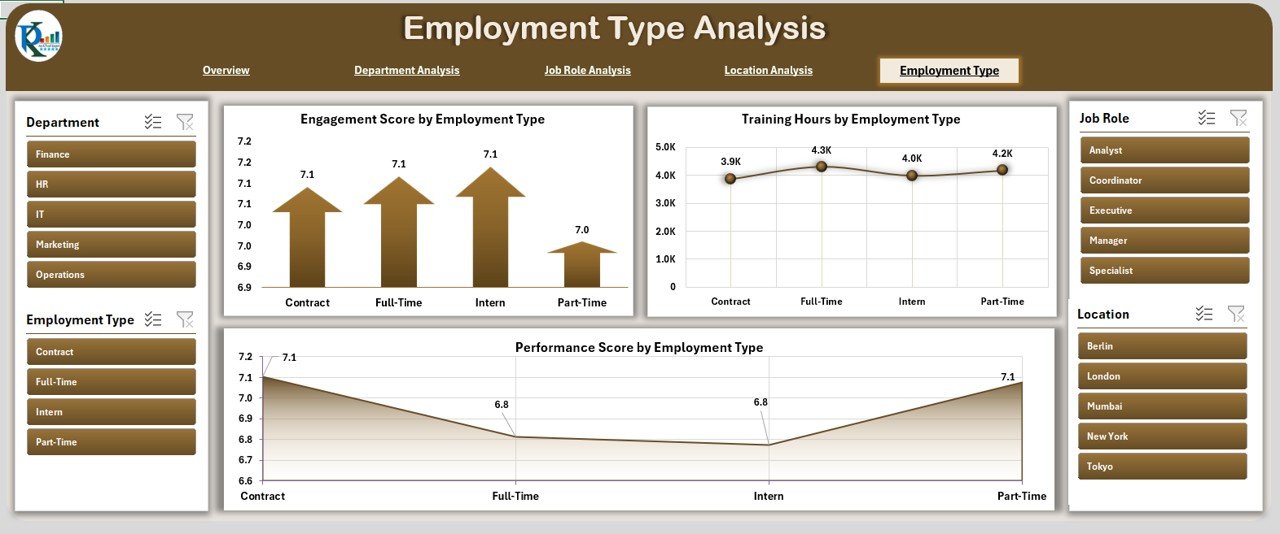
Employment Type Analysis
-
Analyzes workforce by employment type (full-time, part-time, contract).
-
Charts include Performance, Training Hours, and Engagement Score by Type.
-
Support Sheet
-
Stores backend data.
-
Keeps visuals dynamic and accurate.
-
Updates automatically with new data entries.
💡 Why Should Organizations Use It?
An HR Dashboard in Excel provides clarity, cost-efficiency, and flexibility.
-
Cost-Effective: No need for expensive HR software.
-
Customizable: Adapt charts, KPIs, and structure to fit your HR strategy.
-
Real-Time Analysis: Update data instantly with new employee records.
-
Faster Decisions: Spot trends and act quickly.
-
User-Friendly: Anyone familiar with Excel can use it.
✅ Advantages of the HR Dashboard in Excel
-
Centralized Workforce Insights – All data in one place.
-
Faster Analysis – Automated visuals replace manual reporting.
-
Performance Monitoring – Compare KPIs across roles, departments, and locations.
-
Problem Identification – Spot absenteeism, low engagement, or turnover risks early.
-
Custom Reporting – Filter by department, location, or employee type.
-
Budget-Friendly – Works with Excel already available in most organizations.
-
Scalable – Expand KPIs as your workforce grows.
🔧 Best Practices for Using the Dashboard
-
Keep it simple—focus on essential KPIs.
-
Use consistent color coding for better readability.
-
Refresh data weekly or monthly for accuracy.
-
Add slicers/dropdowns for interactivity.
-
Align KPIs with business goals.
-
Train HR staff on usage and interpretation.
-
Secure sensitive employee data with passwords.
🚀 Opportunities for Improvement
-
Automate imports from HRMS/Payroll software.
-
Host in the cloud (OneDrive/SharePoint) for collaboration.
-
Develop mobile-friendly versions for on-the-go access.
-
Integrate AI for predictive analytics (e.g., turnover forecasting).
-
Build employee self-service portals for simplified access.
📌 Conclusion
The HR Dashboard in Excel is more than a spreadsheet—it is a workforce intelligence tool. By combining employee performance, engagement, training, and attendance into one central dashboard, HR professionals can move away from guesswork and adopt a data-driven HR strategy.
Visit our YouTube channel to learn step-by-step video tutorials
🔗 Click here to read the Detailed blog post


Reviews
There are no reviews yet.