Running a hospitality business comes with constant challenges—managing bookings, tracking revenue, improving guest experience, and optimizing services. That’s where our Hospitality Dashboard in Power BI steps in. This ready-to-use, visually dynamic, and insight-driven dashboard empowers hotel owners, property managers, and operational teams to make informed, real-time decisions based on live data.
Built using Microsoft Power BI and powered by your Excel dataset, this dashboard delivers actionable insights into room performance, guest ratings, service utilization, and revenue streams—all in one centralized place.
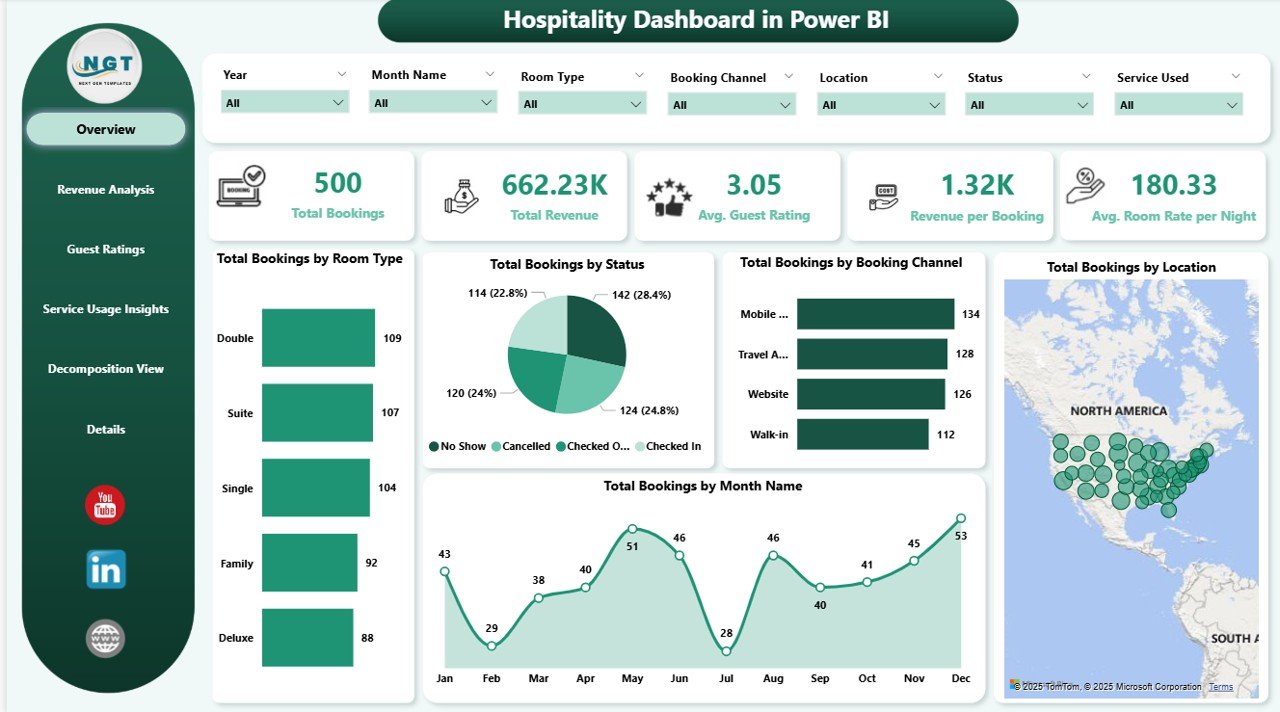
✨ Key Features of the Hospitality Dashboard in Power BI
📊 Multiple Pages of Visual Insights
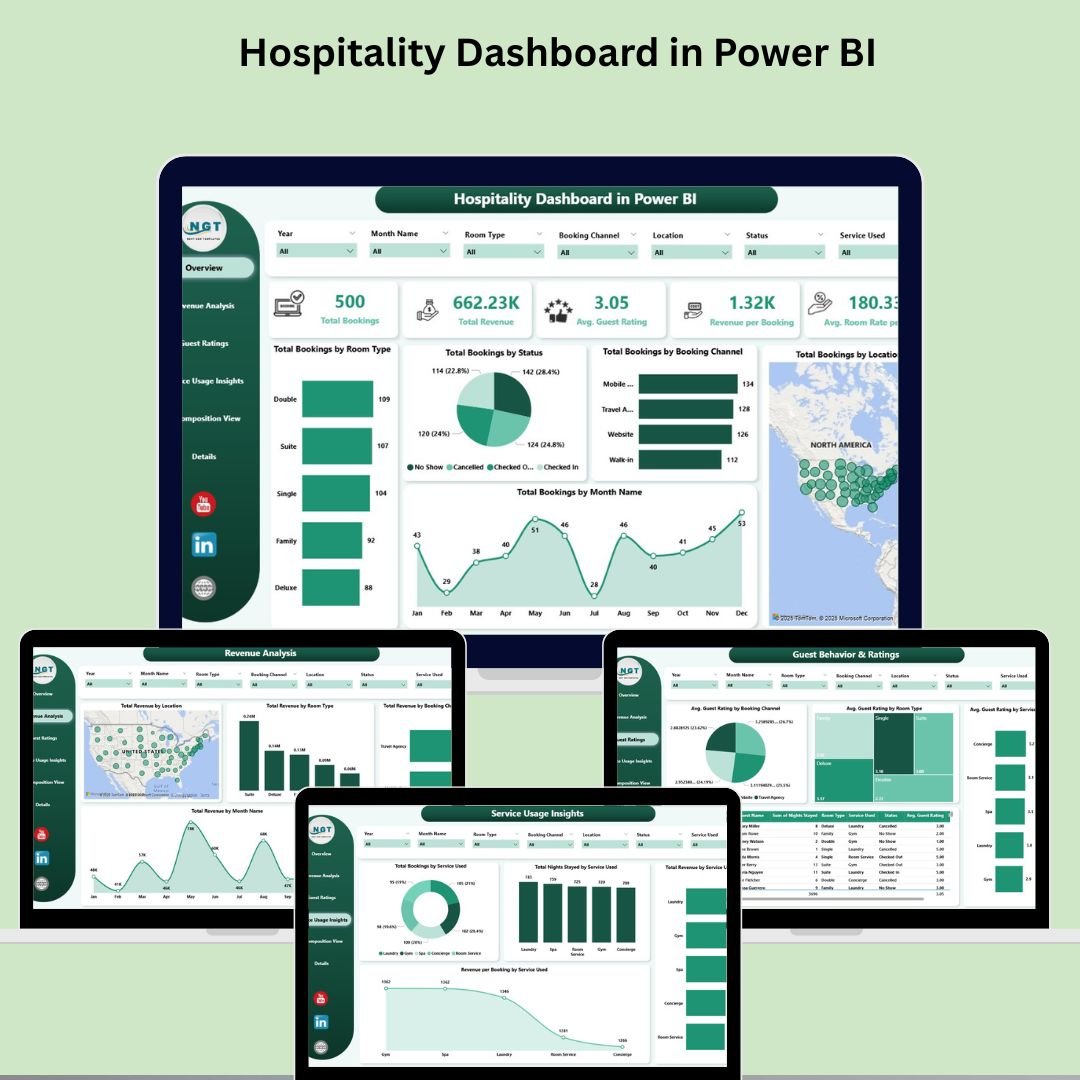
This dashboard includes six fully interactive pages:
-
Overview Page: Total Booking, Total Revenue, Avg. Guest Rating, Revenue/Booking, and Avg. Room Rate/Night.
-
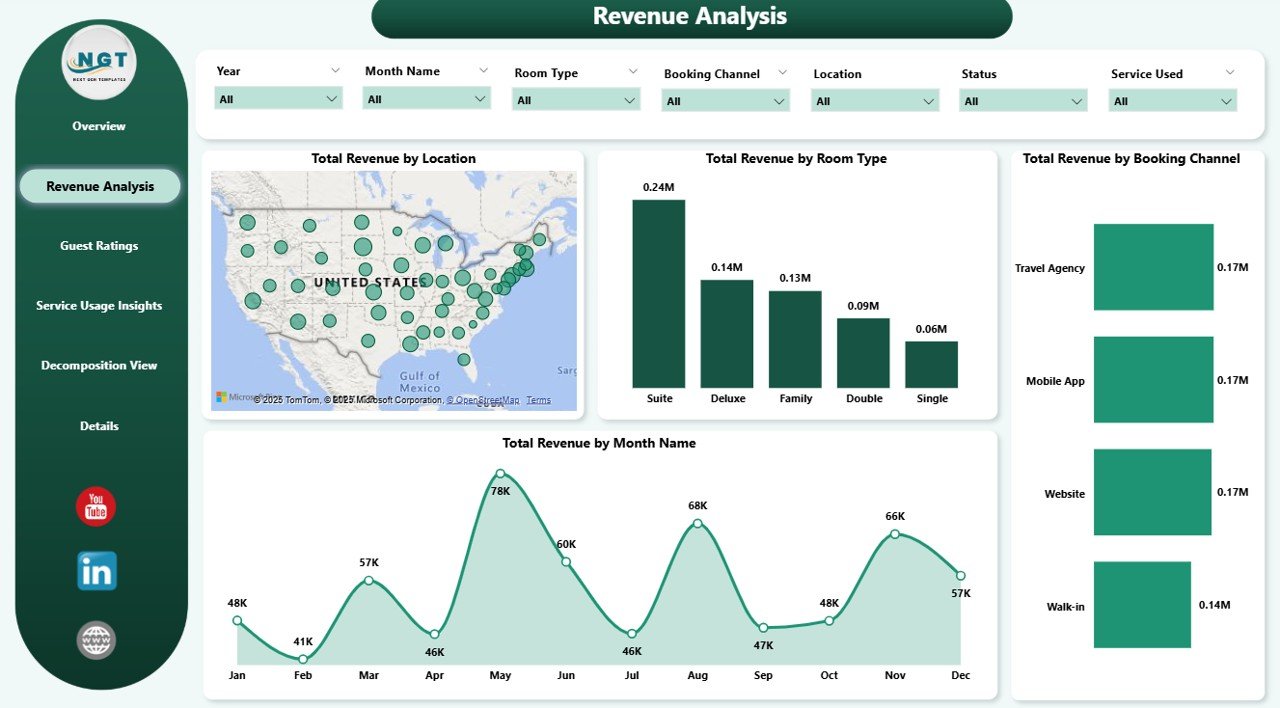
Revenue Analysis Page: Break down of revenue by room type, channel, month, and location.
-
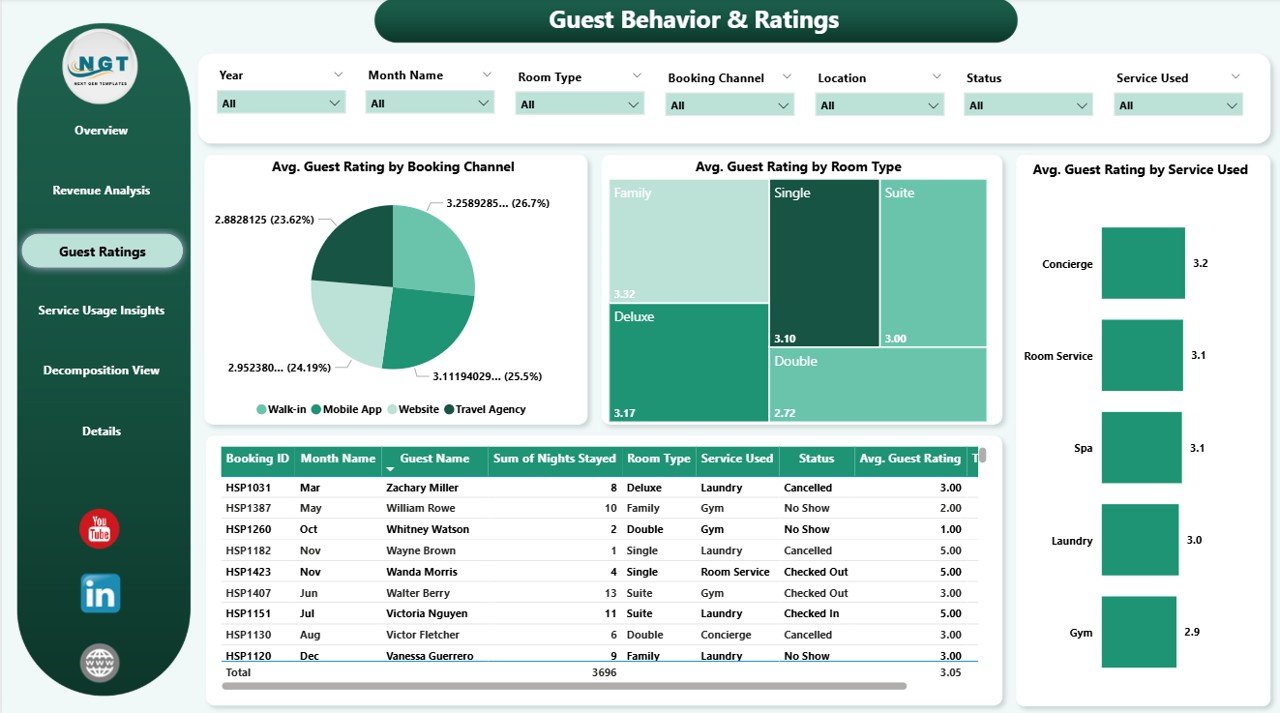
Guest Behavior & Ratings: Track how customers rate their experience by room type, service used, and channel.
-
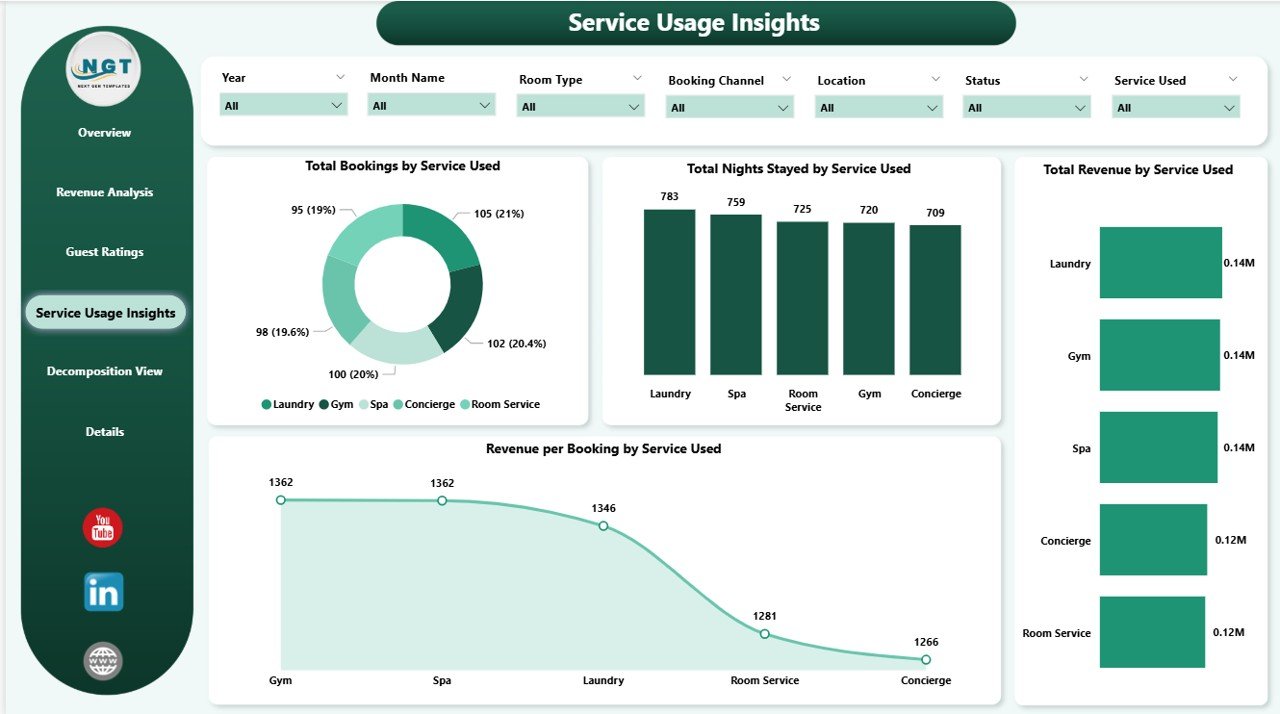
Service Usage Insights: Discover which services (spa, gym, concierge, etc.) are driving nights stayed and revenue.
-
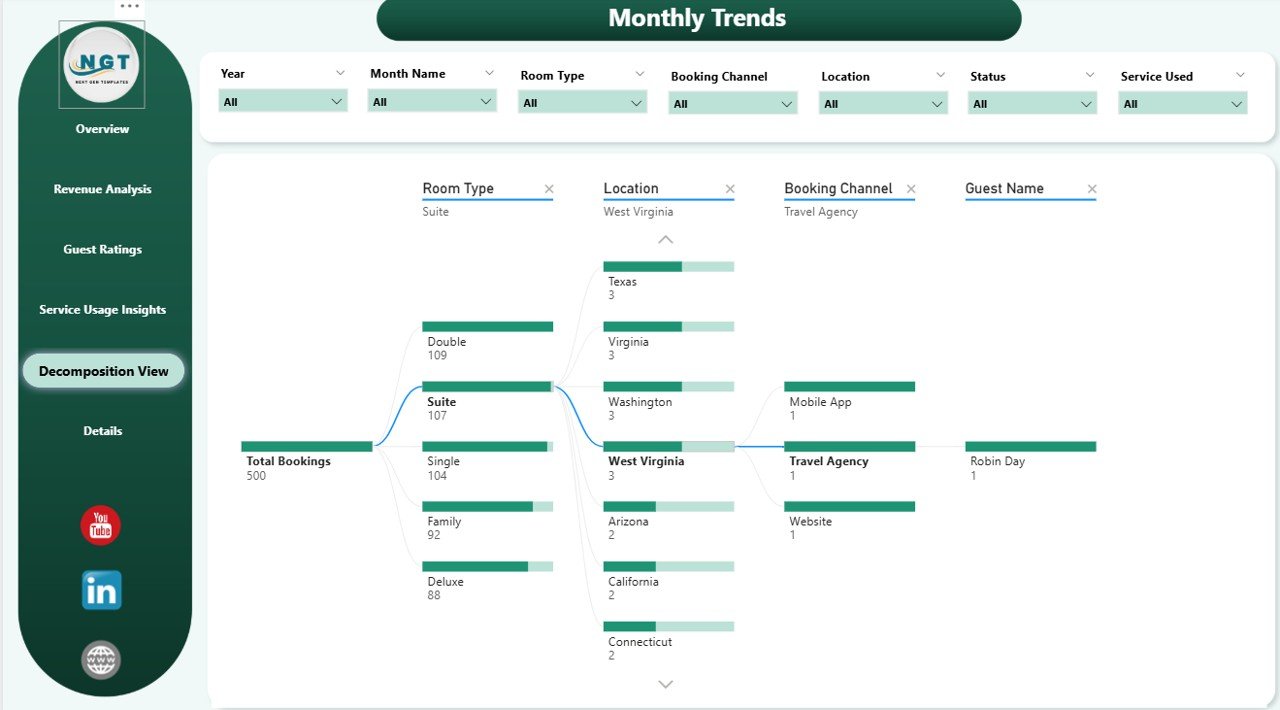
Decomposition View: Drill down into root causes behind revenue shifts and booking changes.
-
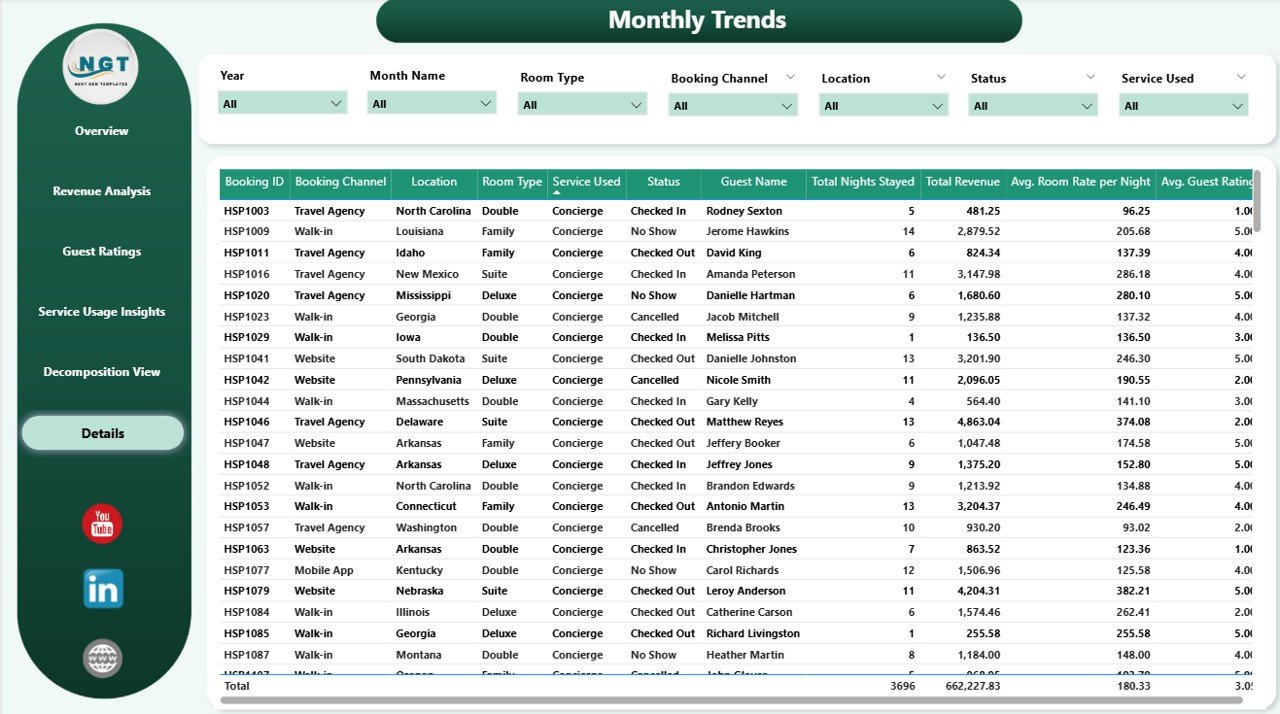
Details Page: Raw data for in-depth filtering, export, or Power BI modeling.
📦 What’s Inside the Hospitality Dashboard?
-
🧾 5 KPI Cards: Instantly see your most critical hospitality metrics.
-
📈 20+ Pivot-based Charts: Slicers by Room Type, Location, Channel, Month, and Status.
-
🗂️ Fully connected Data Model: All pages auto-update from Excel data.
-
🔎 Decomposition Tree: Deep-dive capability to analyze trends & gaps.
-
🧩 Custom Filters/Slicers: Analyze results by booking channel, month, room type, and more.
-
📤 Ready for Sharing: Exportable to Power BI Service for browser-based access or embedding.
🧠 How to Use the Hospitality Dashboard
-
📥 Load your Excel data into the Power BI file.
-
🔁 Use the filters to select months, room types, channels, or locations.
-
📊 View bookings, revenue, and rating analytics across pages.
-
🔍 Use the Decomposition View for detailed analysis and business diagnosis.
-
📈 Present the insights to stakeholders or use them to guide strategic decisions.
👥 Who Can Benefit from This Dashboard?
-
🏨 Hotel Owners & General Managers
Stay in control of overall property performance. -
🧑💼 Operations Managers
Monitor daily bookings, cancellations, and revenue metrics. -
🧾 Revenue Managers
Optimize pricing strategies with insights into revenue/booking and seasonal trends. -
🧑🤝🧑 Front Office & Guest Relations
Improve guest satisfaction using real-time rating insights. -
📊 Data Analysts or BI Teams
Use the raw data & decompositions for reporting and forecasting.











Reviews
There are no reviews yet.