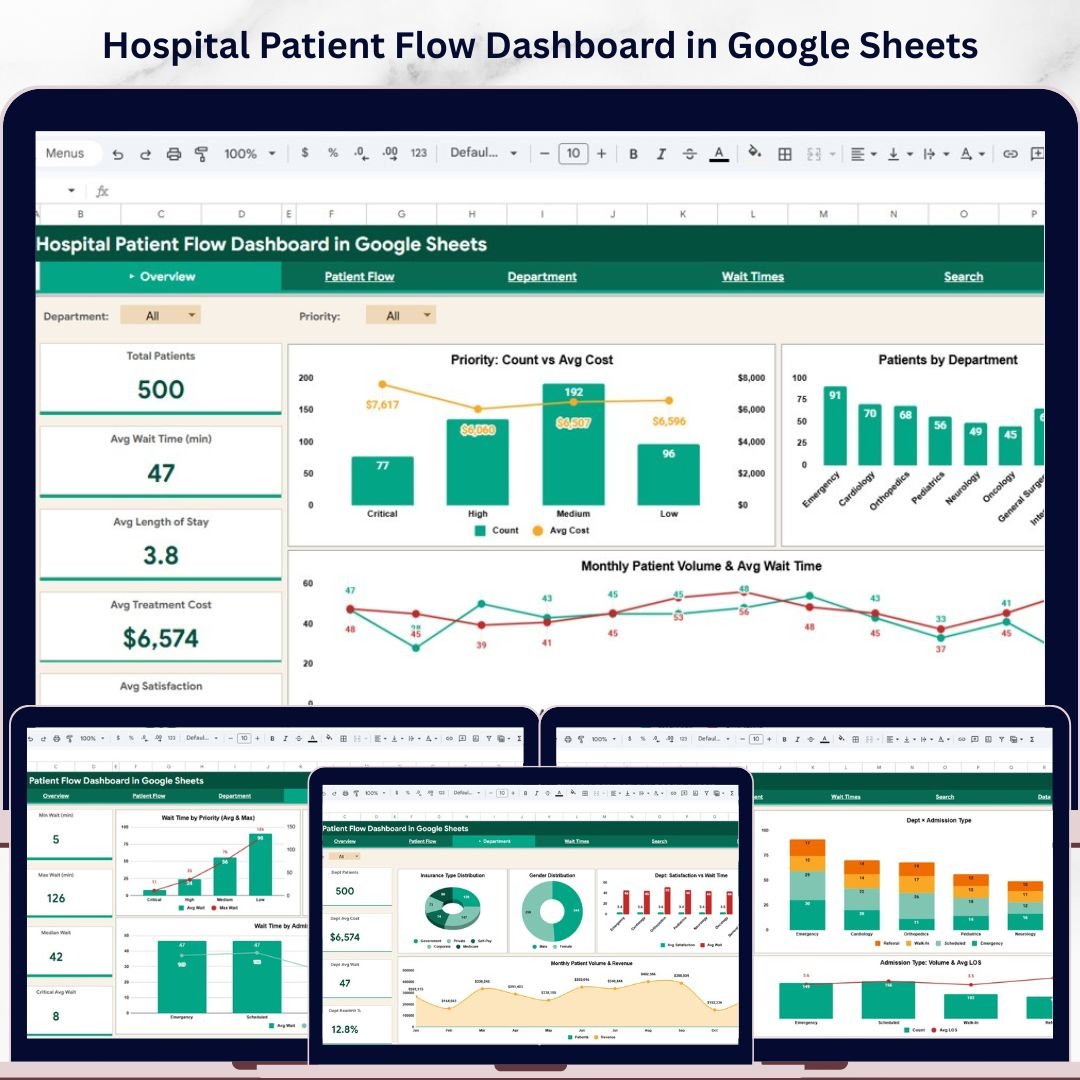

Hospital Patient Flow Dashboard in Google Sheets is a professionally designed, interactive analytics dashboard built for hospital administrators, healthcare analysts, clinical quality teams, and operations managers who need complete visibility into patient flow, department performance, wait times, treatment costs, and patient satisfaction — all inside Google Sheets. This dashboard includes 6 interactive sheet tabs covering every angle of hospital patient management from high-level overviews to granular wait time breakdowns and patient-level search.Hospital Patient Flow Dashboard in Google Sheets
Whether you manage a small community hospital or a large multi-department medical center, this Google Sheets dashboard template delivers interactive, formula-driven analytics to help you make smarter clinical and operational decisions every day.
🔑 Key Features of Hospital Patient Flow Dashboard in Google Sheets
📊 6 Interactive Dashboard Pages — Overview, Patient Flow, Department, Wait Times, Search, and Data Sheet provide a 360-degree view of your hospital’s patient operations and performance metrics.
📈 Dynamic Formula-Powered Visuals — All charts and KPI cards are powered by Google Sheets formulas, ensuring accurate and automatic calculations across every sheet tab.
🔍 Slicer Filters for Instant Analysis — Use built-in slicers to filter data by department, admission type, priority, status, gender, insurance type, and more for quick, targeted insights.
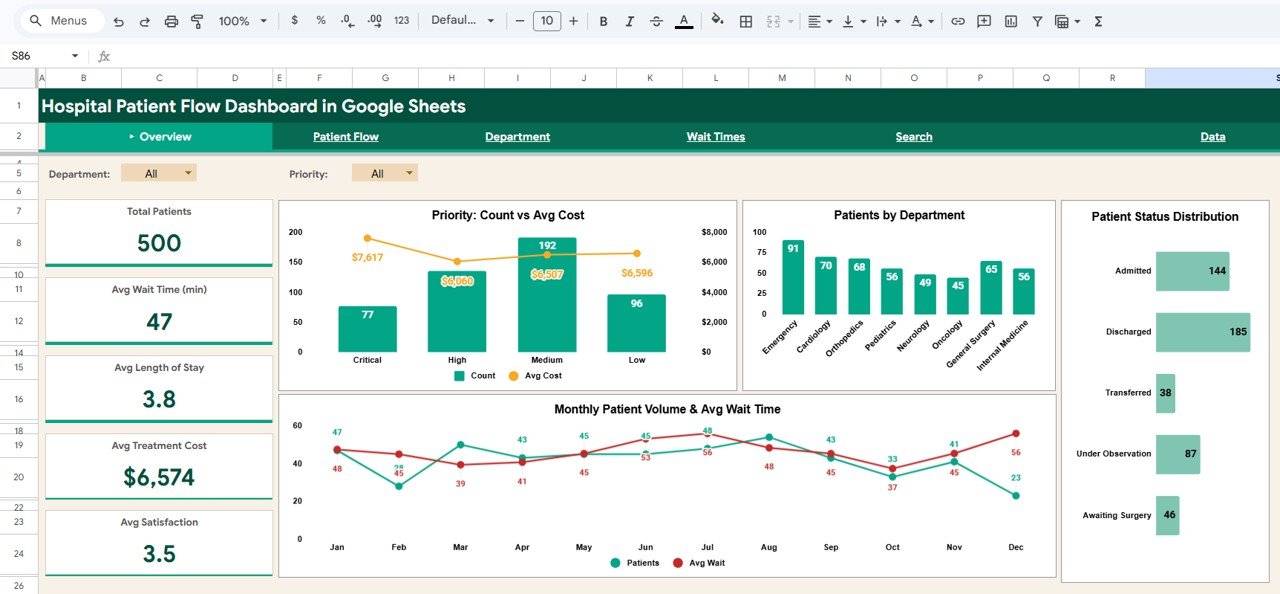
💡 5 KPI Summary Cards — Track Total Patients, Avg Wait Time (min), Avg Length of Stay, Avg Treatment Cost, and Avg Satisfaction at a glance on the Overview page.
🏥 Patient Flow & Readmission Analytics — Analyze emergency vs scheduled admits, readmission rates, bed type occupancy, and admission volume trends to optimize patient throughput.
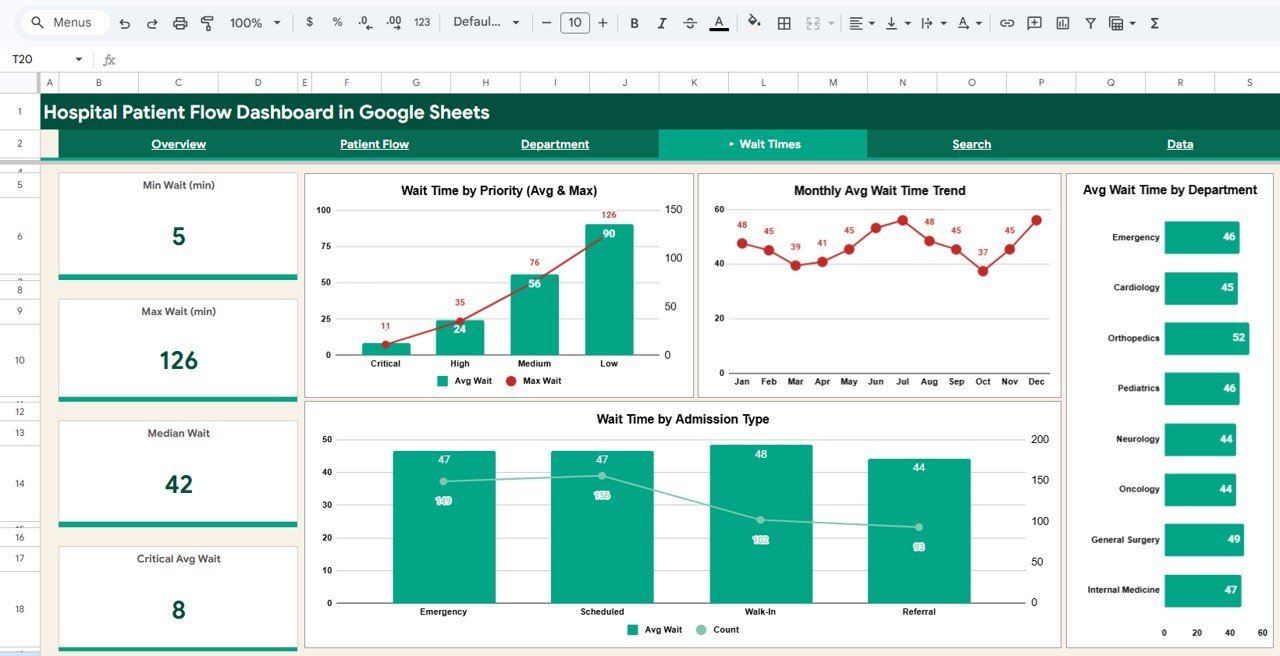
⏱️ Wait Time Intelligence — Drill into min, max, median, and critical average wait times segmented by priority, department, and admission type to reduce bottlenecks.
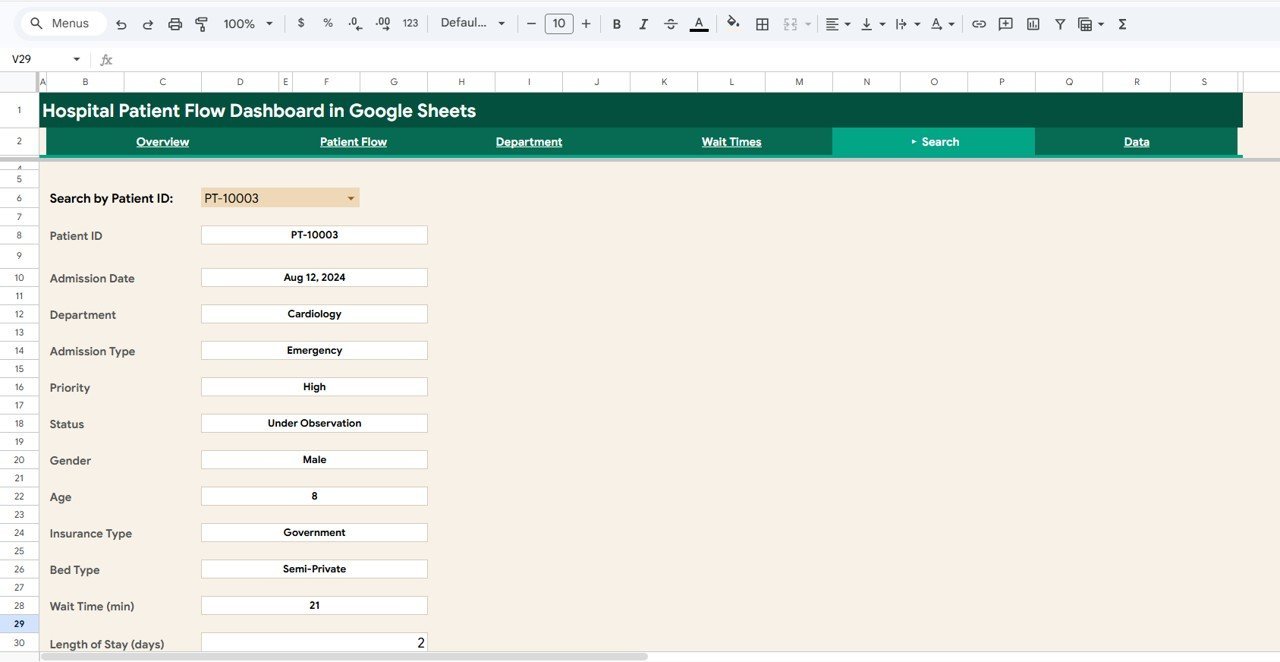
🔎 Patient Search — Look up any patient by ID and instantly see admission date, department, priority, status, insurance, bed type, wait time, length of stay, and more.
☁️ Cloud-Based & Collaborative — Works entirely in Google Sheets with real-time multi-user access from any device — no software installation needed.
📦 What’s Inside the Hospital Patient Flow Dashboard in Google Sheets
This dashboard includes 6 dedicated sheet tabs designed for comprehensive hospital analytics. The Overview page displays 5 KPI cards (Total Patients, Avg Wait Time, Avg Length of Stay, Avg Treatment Cost, Avg Satisfaction) and interactive charts including Priority Count vs Avg Cost, Patients by Department, Patient Status Distribution, and Monthly Patient Volume & Avg Wait Time. Multiple slicers let you filter the entire dashboard instantly.
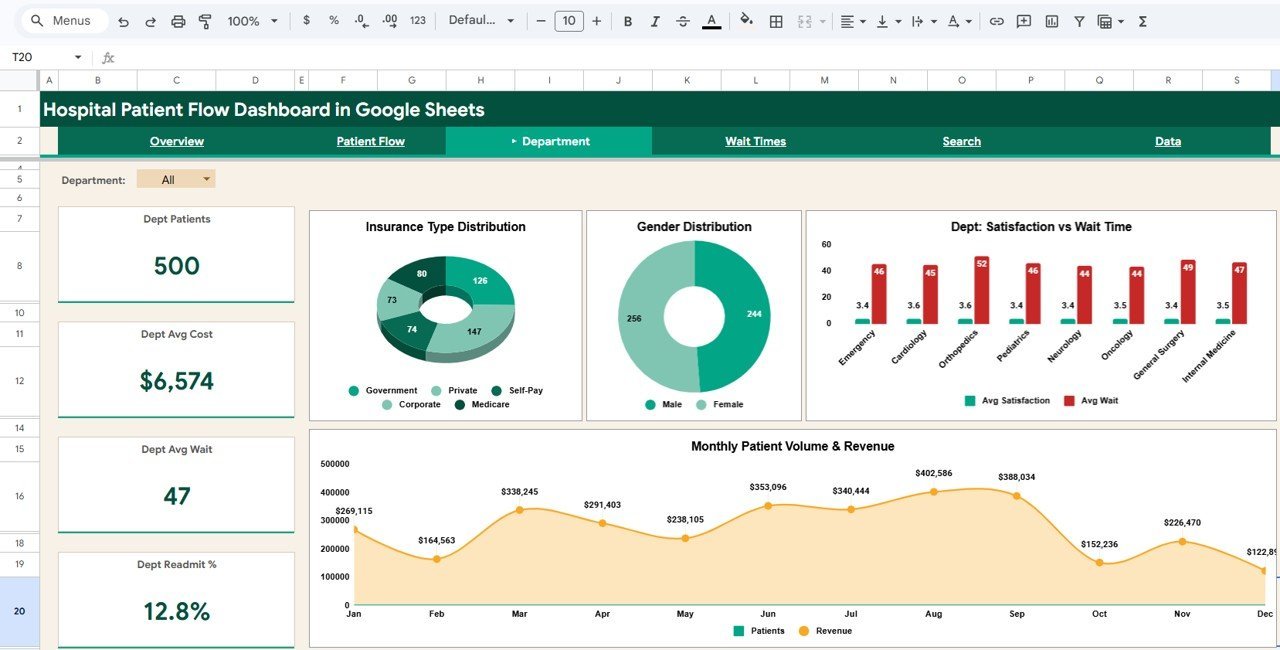
The Patient Flow tab tracks Emergency Admits, Scheduled Admits, Readmission Rate, and Avg Satisfaction alongside charts for Patient Outcome Distribution, Dept x Admission Type, Bed Type Occupancy & Avg Cost, and Admission Type Volume & Avg LOS. The Department tab compares Dept Patients, Dept Avg Cost, Dept Avg Wait, and Dept Readmit % with charts for Insurance Type Distribution, Gender Distribution, Dept Satisfaction vs Wait Time, and Monthly Patient Volume & Revenue.
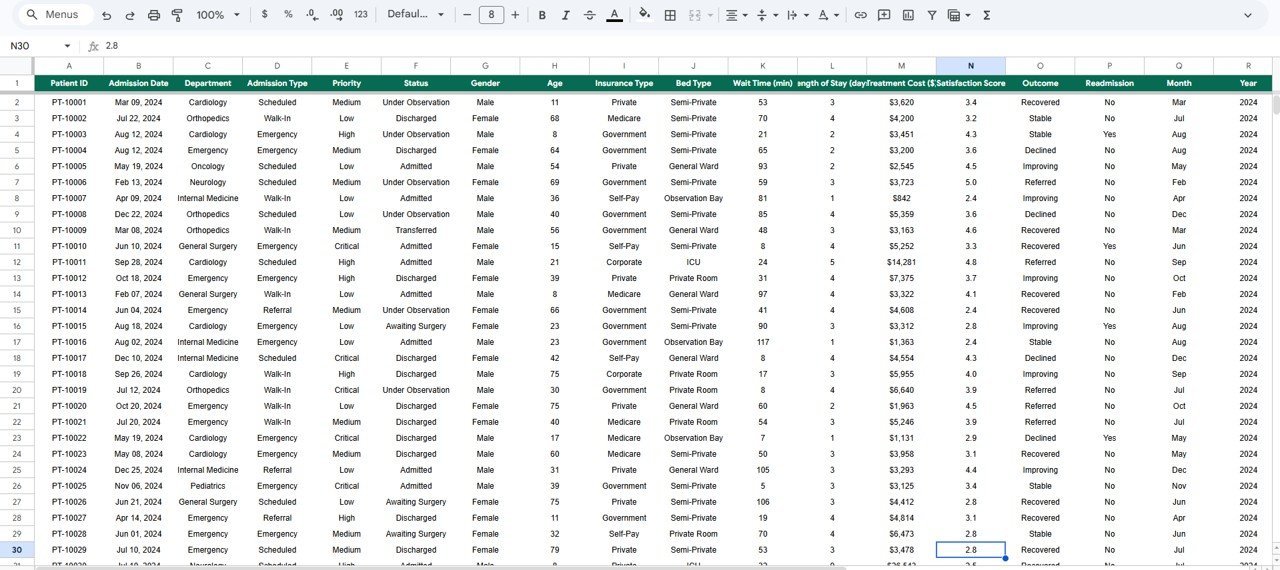
The Wait Times tab analyzes Min Wait, Max Wait, Median Wait, and Critical Avg Wait with detailed charts covering Wait Time by Priority (Avg & Max), Monthly Avg Wait Time Trend, Avg Wait Time by Department, and Wait Time by Admission Type. The Search page lets you look up any Patient ID and instantly view 12 detail fields including Admission Date, Department, Priority, Status, Gender, Age, Insurance Type, Bed Type, Wait Time, and Length of Stay. The Data Sheet stores all hospital records in a structured format — simply replace the sample data with your own and the dashboard auto-updates.
For hospital analytics in other platforms, explore the Hospital Patient Flow Dashboard in Power BI, the Hospital Patient Flow Dashboard in Excel, or the Hospital Patient Flow Dashboard in HTML.
⚙️ How to Use the Hospital Patient Flow Dashboard in Google Sheets
1️⃣ Open the PDF guide included in your download and click the Google Sheets copy link to create your own editable copy in Google Drive.
2️⃣ Navigate to the Data Sheet tab and replace the 500 sample records with your hospital’s actual patient data in the same column format.
3️⃣ Return to the Overview page and use the slicer filters to explore your hospital’s KPIs, patient volumes, and department metrics instantly.
4️⃣ Drill into the Patient Flow, Department, and Wait Times tabs for focused analysis on admissions, departmental performance, and wait time bottlenecks.
5️⃣ Use the Search page to look up individual patient records by Patient ID for quick reference during rounds or administrative reviews.
👥 Who Can Benefit from This Hospital Patient Flow Dashboard in Google Sheets
🏥 Hospital administrators tracking patient volumes, costs, and satisfaction across departments.
📋 Clinical quality managers monitoring readmission rates and patient outcomes.
⏱️ Operations analysts identifying wait time bottlenecks and optimizing patient throughput.
💰 Healthcare financial controllers analyzing treatment costs and insurance distributions.
👩⚕️ Department heads benchmarking performance against other clinical units.
📊 Healthcare consultants delivering patient flow insights to hospital clients.
❓ Frequently Asked Questions
What KPIs does the Hospital Patient Flow Dashboard in Google Sheets track?
The Hospital Patient Flow Dashboard in Google Sheets tracks 5 key performance indicators including Total Patients, Average Wait Time, Average Length of Stay, Average Treatment Cost, and Average Satisfaction Score. It also provides detailed analysis across 6 interactive sheet tabs covering patient flow, department metrics, wait time breakdowns, and individual patient search.
Do I need any special software to use this Google Sheets dashboard?
No special software or installation is required. Simply open the Google Sheets copy link from the included PDF guide and the dashboard opens in your browser via Google Drive. It works on any device with internet access.
Can I filter the dashboard by department or admission type?
Yes. The dashboard includes multiple interactive slicers on the Overview page that let you filter all charts and KPIs by department, admission type, priority, status, gender, insurance type, and more. All visualizations update instantly when you apply a filter.
Can I search for individual patient records in this dashboard?
Yes. The dedicated Search page lets you select any Patient ID to instantly view 12 detail fields including Admission Date, Department, Admission Type, Priority, Status, Gender, Age, Insurance Type, Bed Type, Wait Time, and Length of Stay.
Is this dashboard available in Excel or Power BI?
Yes. NextGen Templates offers the Hospital Patient Flow Dashboard in Excel with pivot tables and slicers, the Hospital Patient Flow Dashboard in Power BI with interactive Power BI visuals, and the Hospital Patient Flow Dashboard in HTML for browser-based analytics.
How many records can this dashboard handle?
The template comes with 500 sample records and can scale to handle thousands of records in Google Sheets. Simply add your data rows in the Data Sheet tab and the entire dashboard recalculates and updates automatically across all 6 pages.
🔗 Explore Related Templates
Hospital Patient Flow Dashboard in Excel — Pivot-driven Excel version with 7 sheet tabs, slicers, and KPI cards for spreadsheet-based hospital analytics.
Hospital Operations KPI Scorecard in Google Sheets — Track hospital KPIs with monthly targets, YTD trends, and visual performance indicators.
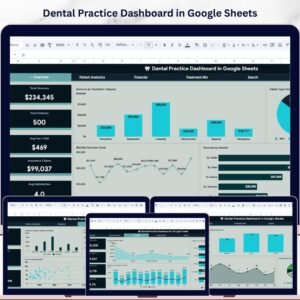
Dental Practice Dashboard in Google Sheets — Comprehensive dental clinic analytics covering revenue, patient demographics, and treatment analysis.
📖 Click here to read the Detailed Blog Post
Watch the step-by-step video tutorial:


Reviews
There are no reviews yet.