

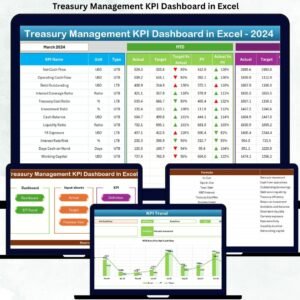
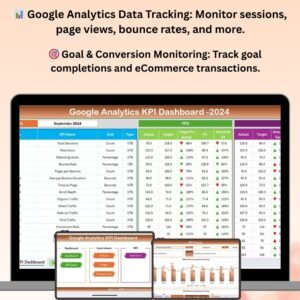
The Google Analytics KPI Dashboard in Excel is a comprehensive and user-friendly tool designed to help digital marketers, web analysts, and business owners monitor, track, and analyze the key performance indicators (KPIs) of their website or online business. This Excel-based dashboard pulls in essential Google Analytics data, allowing you to track and visualize traffic sources, user behavior, and overall website performance in a streamlined, easy-to-understand format.
With this dashboard, you can track essential KPIs such as sessions, page views, bounce rates, conversions, and user demographics. The visual representation of data through charts and graphs allows for quick insights, helping you optimize your digital marketing strategies and improve user experience.
Key Features of the Google Analytics KPI Dashboard in Excel
📊 Google Analytics Data Integration
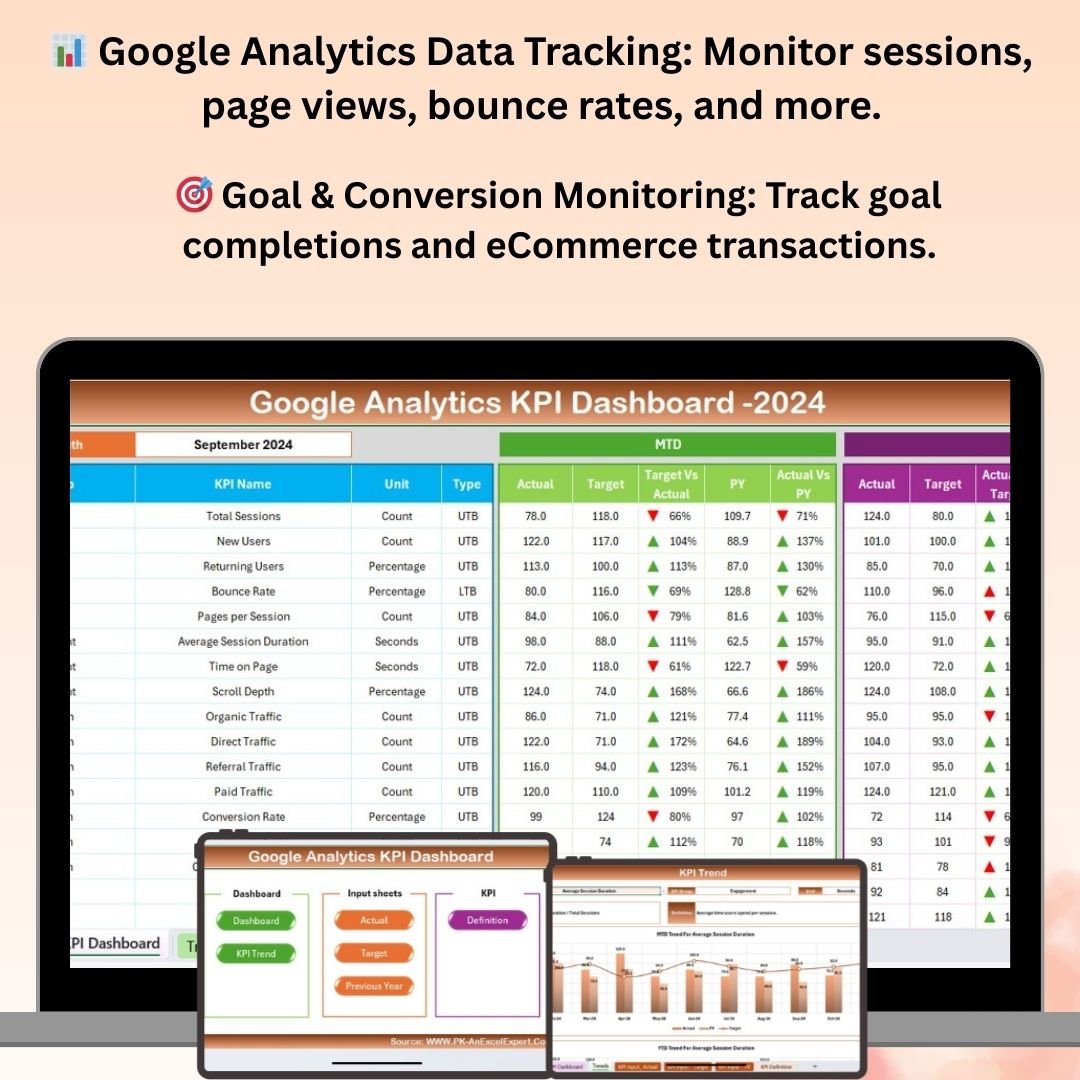
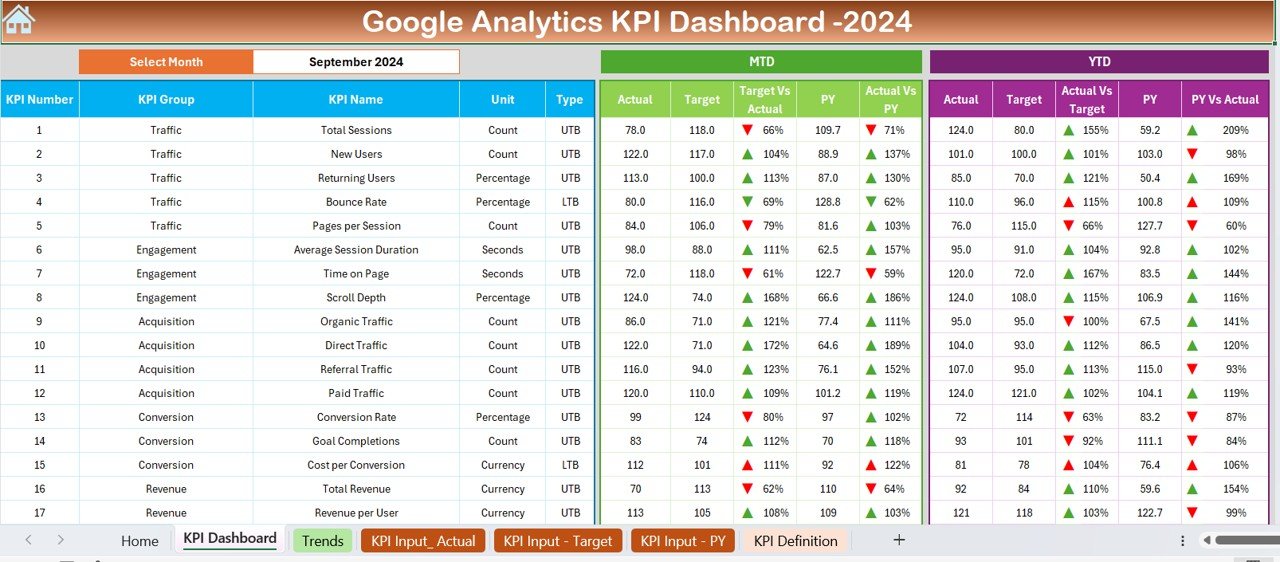
Import and visualize your Google Analytics data directly within Excel. Monitor key metrics such as sessions, page views, bounce rate, and goal completions for in-depth website performance analysis.
📈 Comprehensive Traffic Overview
Track overall website traffic and user behavior, including organic, direct, referral, and social traffic sources. Understand where visitors are coming from and how they interact with your site.
🎯 Conversion Tracking
Monitor conversions and goal completions, including eCommerce transactions, lead form submissions, and other important actions. Track how well your website meets your business objectives.
📅 Time-Based Performance Tracking
Monitor website performance over specific time periods. Track daily, weekly, or monthly traffic trends to identify peak times, seasonal changes, and ongoing performance patterns.
⚙️ Customizable KPIs & Metrics
Tailor the dashboard to your specific Google Analytics setup by adding custom KPIs, adjusting data ranges, and incorporating additional metrics relevant to your business needs.
📊 Interactive Visual Reporting
Visualize key website metrics and trends with easy-to-understand charts and graphs. Quickly analyze performance changes and identify areas for improvement or optimization.
Why You’ll Love the Google Analytics KPI Dashboard in Excel
✅ Streamline Google Analytics Data
Simplify the process of tracking and visualizing Google Analytics data. All your key website performance metrics are in one place, easily accessible and ready for analysis.
✅ Improve Website Performance
By tracking and analyzing the right KPIs, you can make data-driven decisions to improve user experience, drive traffic, and increase conversions.
✅ Customizable for Your Needs
Customize the dashboard to track the metrics that are most important for your website or business. Whether you’re focused on SEO, user engagement, or eCommerce sales, the dashboard can be tailored for you.
✅ Real-Time Data Visualization
Track website performance in real time with charts and graphs that dynamically update as new data comes in. Stay on top of trends and act quickly to optimize performance.
✅ Data-Driven Decisions
Make smarter decisions for your marketing campaigns, website design, and overall business strategy based on the clear insights provided by the dashboard.
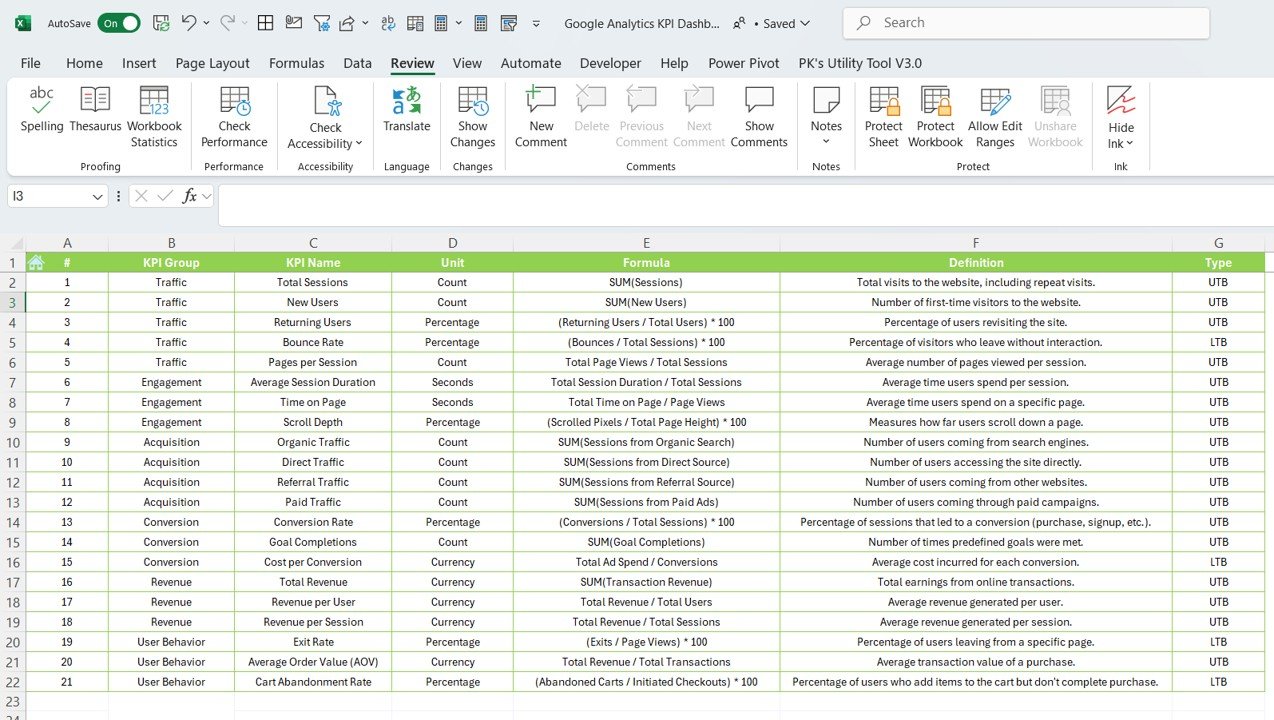
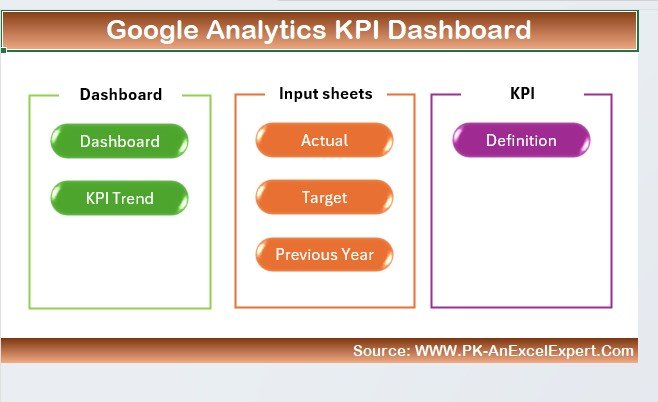
What’s Inside the Google Analytics KPI Dashboard in Excel?
- Google Analytics Integration: Import key website performance metrics such as sessions, page views, bounce rate, and more.
- Traffic Source Analysis: Track organic, direct, referral, and social traffic to understand where your visitors come from.
- Goal & Conversion Tracking: Monitor goal completions, eCommerce transactions, and other conversions.
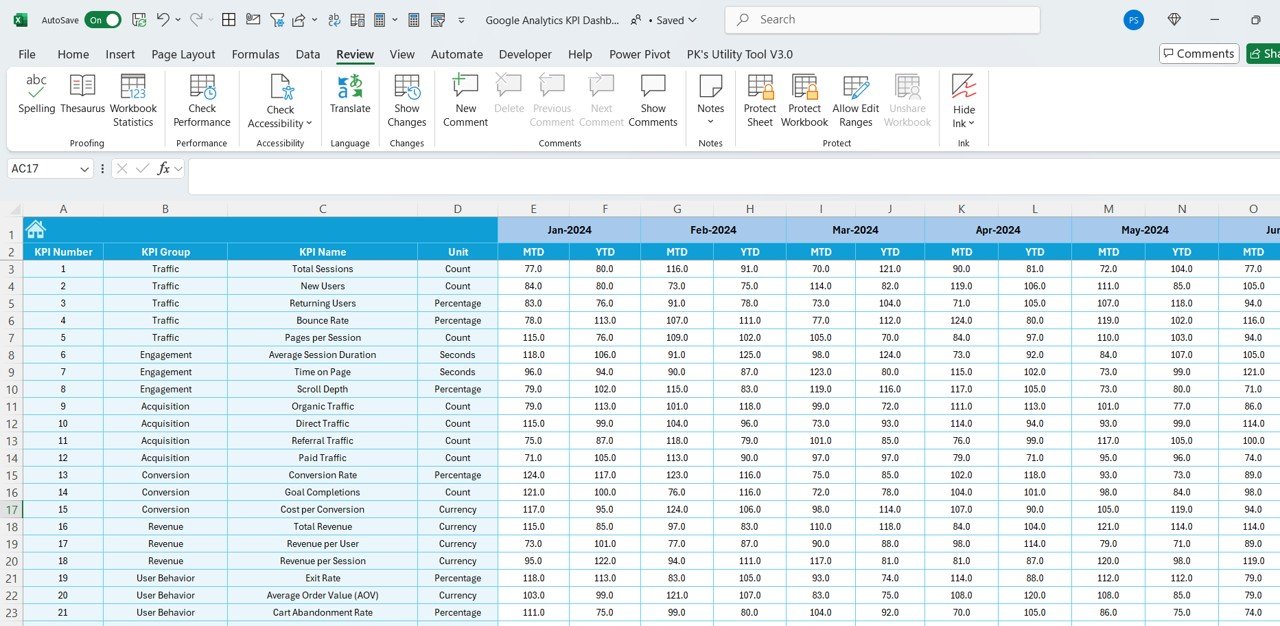
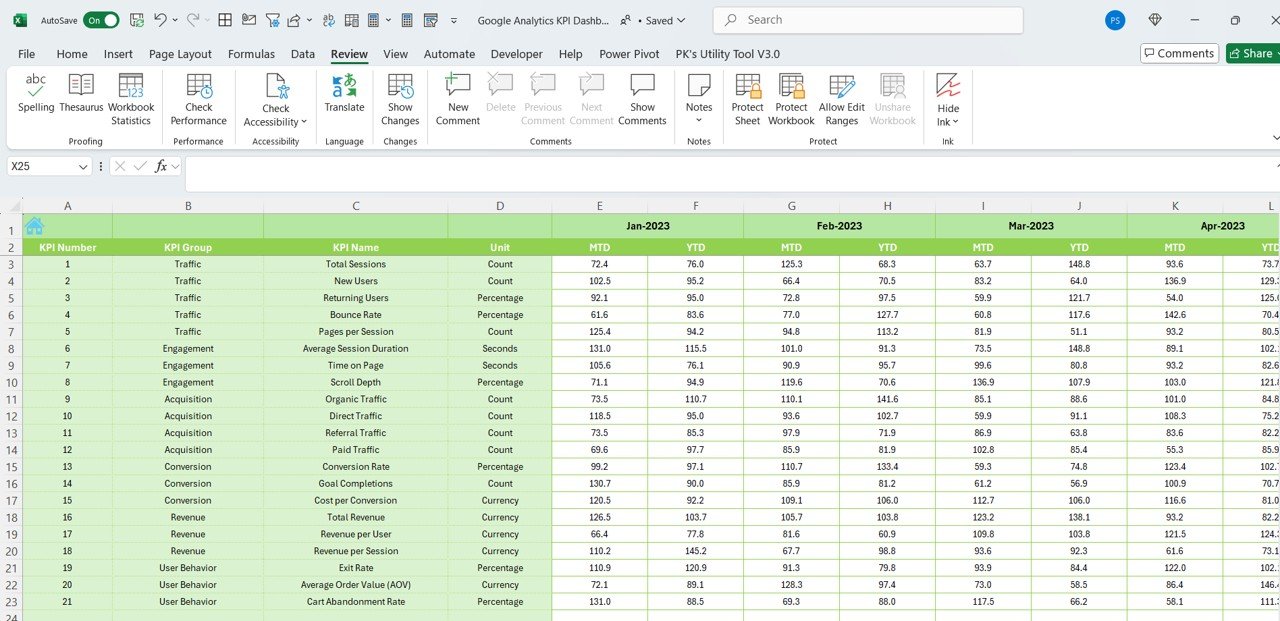
- Time-Based Performance: Analyze trends over specific time periods, such as daily, weekly, or monthly.
- Customizable KPIs: Modify the dashboard to track custom KPIs, metrics, and data ranges specific to your needs.
- Data Visualizations: Use interactive charts and graphs to analyze and visualize website performance trends.
How to Use the Google Analytics KPI Dashboard in Excel
1️⃣ Download the Template: Get immediate access to the Google Analytics KPI Dashboard in Excel.
2️⃣ Connect to Google Analytics: Import your Google Analytics data into the dashboard.
3️⃣ Set Up Your KPIs & Metrics: Customize the dashboard by adding the KPIs that are most relevant to your website or business.
4️⃣ Monitor Website Performance: Track and analyze traffic, conversions, bounce rates, and other key metrics.
5️⃣ Visualize & Analyze Data: Use visual reports and charts to identify trends and make data-driven decisions to optimize website performance.
Who Can Benefit from the Google Analytics KPI Dashboard in Excel?
🔹 Digital Marketers & Marketing Managers
🔹 Web Analysts & SEO Specialists
🔹 eCommerce Business Owners
🔹 Content Marketers & Social Media Managers
🔹 Small & Medium Enterprises (SMEs)
🔹 Large Corporations & Enterprises
Take control of your website performance and make data-driven decisions to enhance your digital marketing efforts with the Google Analytics KPI Dashboard in Excel. Track KPIs, monitor traffic sources, and visualize conversion rates to optimize your site and achieve better business outcomes.
Click here to read the Detailed blog post
Visit our YouTube channel to learn step-by-step video tutorials
Youtube.com/@PKAnExcelExpert


Reviews
There are no reviews yet.