The footwear and accessories retail industry grows fast—new trends emerge, customer demand shifts, and competition increases every season 👟👜. To stay ahead, retailers need clear, real-time insights. But when performance data stays scattered across sheets, stores, regions, and categories, it becomes difficult to track results, forecast demand, and take profitable decisions.
The Footwear & Accessories Dashboard in Power BI solves these challenges by giving retailers a clean, interactive, and powerful view of their entire business. Whether you manage multiple stores, monitor hundreds of SKUs, or oversee region-wide sales operations, this dashboard helps you understand what’s working, what needs improvement, and how to grow faster.
Built with smart visuals, slicers, filters, KPI cards, and trend charts, the dashboard reads data from Excel or any database and transforms it into meaningful insights instantly. From sales performance to customer ratings, from return rates to monthly trends—everything is organized in one user-friendly tool that updates with a single refresh.
🔥 Key Features of the Footwear & Accessories Dashboard in Power BI
-
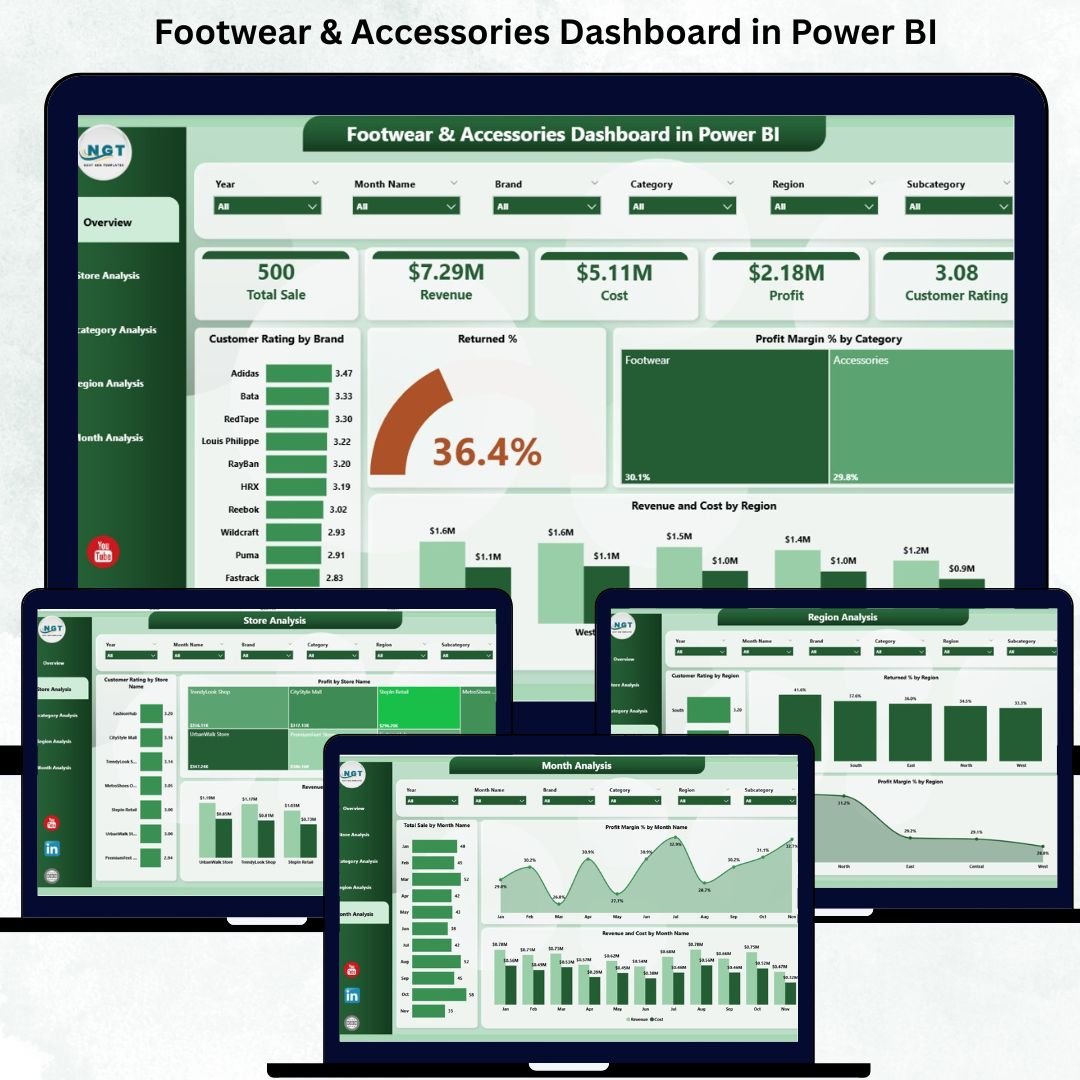
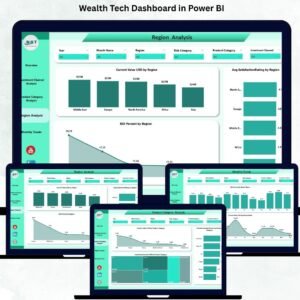
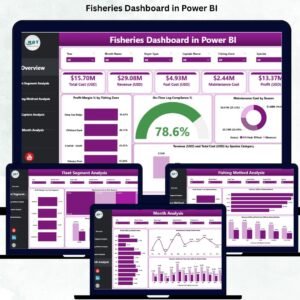
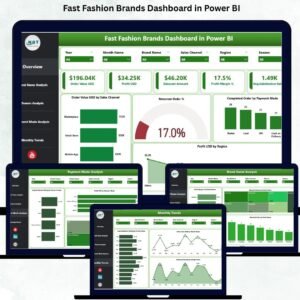
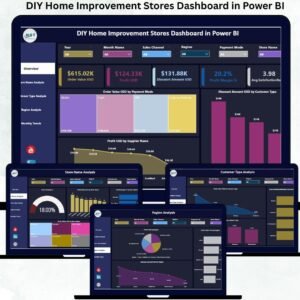
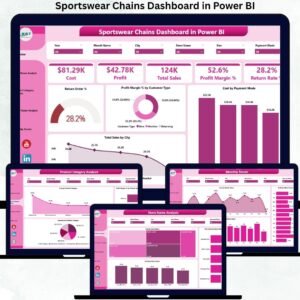
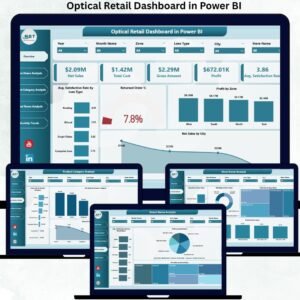
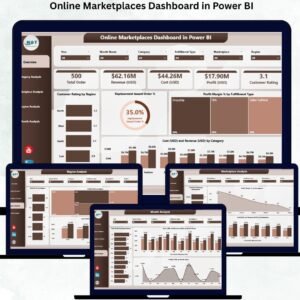
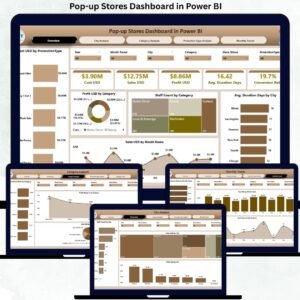
📊 Overview Page – Track total sales, revenue, profit, ratings, return %, profit margin %, and regional cost insights.
-
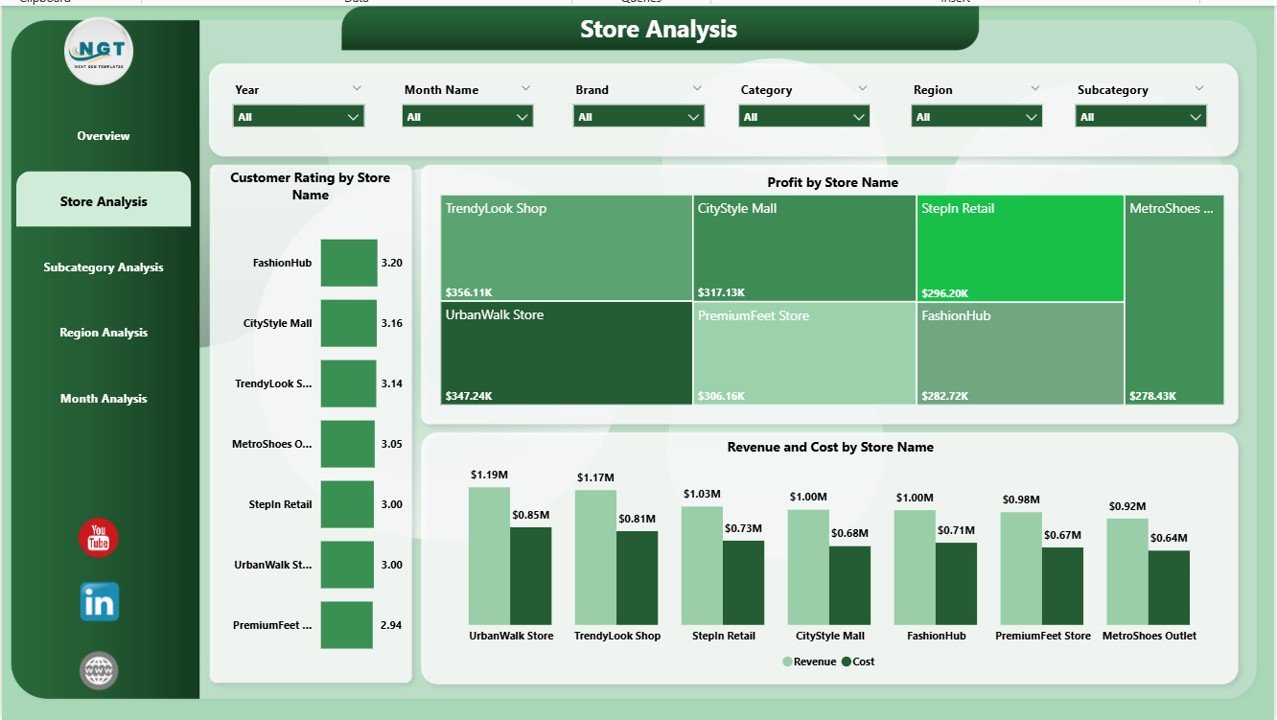
🏬 Store Analysis Page – Compare customer ratings, revenue, profit, and cost across each store for better operational decisions.
-
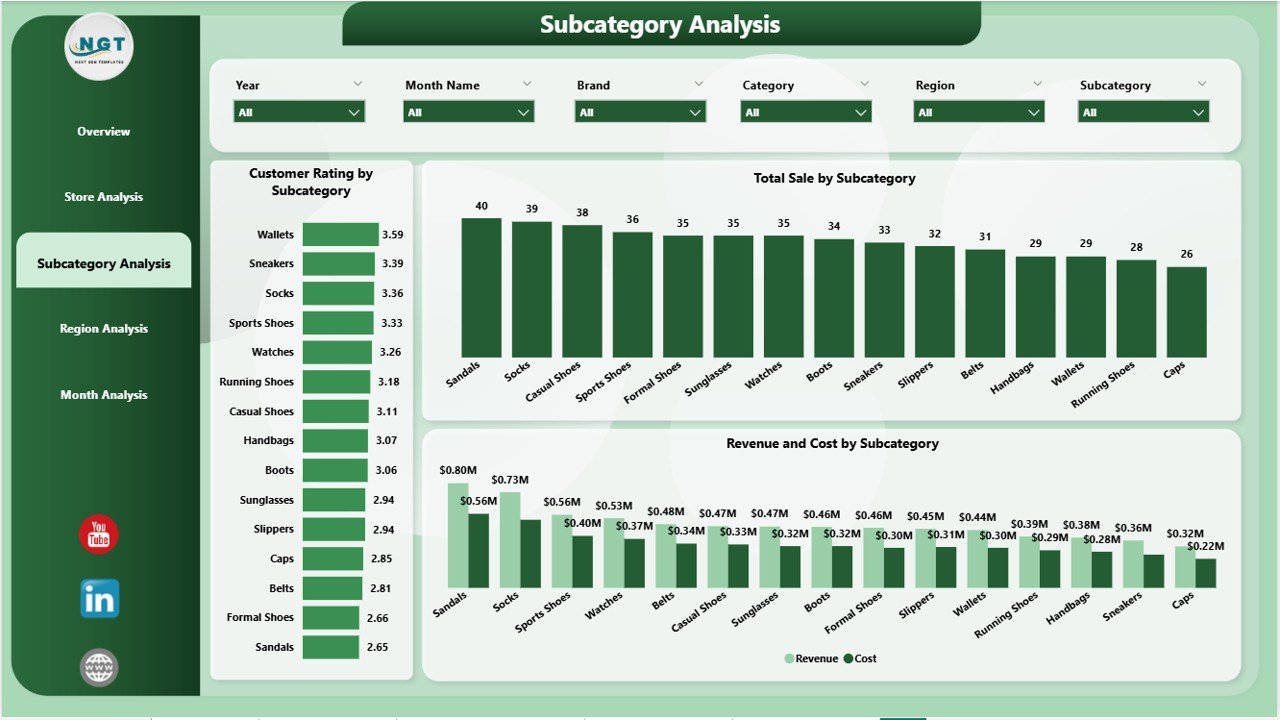
👜 Subcategory Analysis Page – Analyze deep performance for shoes, belts, bags, wallets, sandals, boots, backpacks, and more.
-
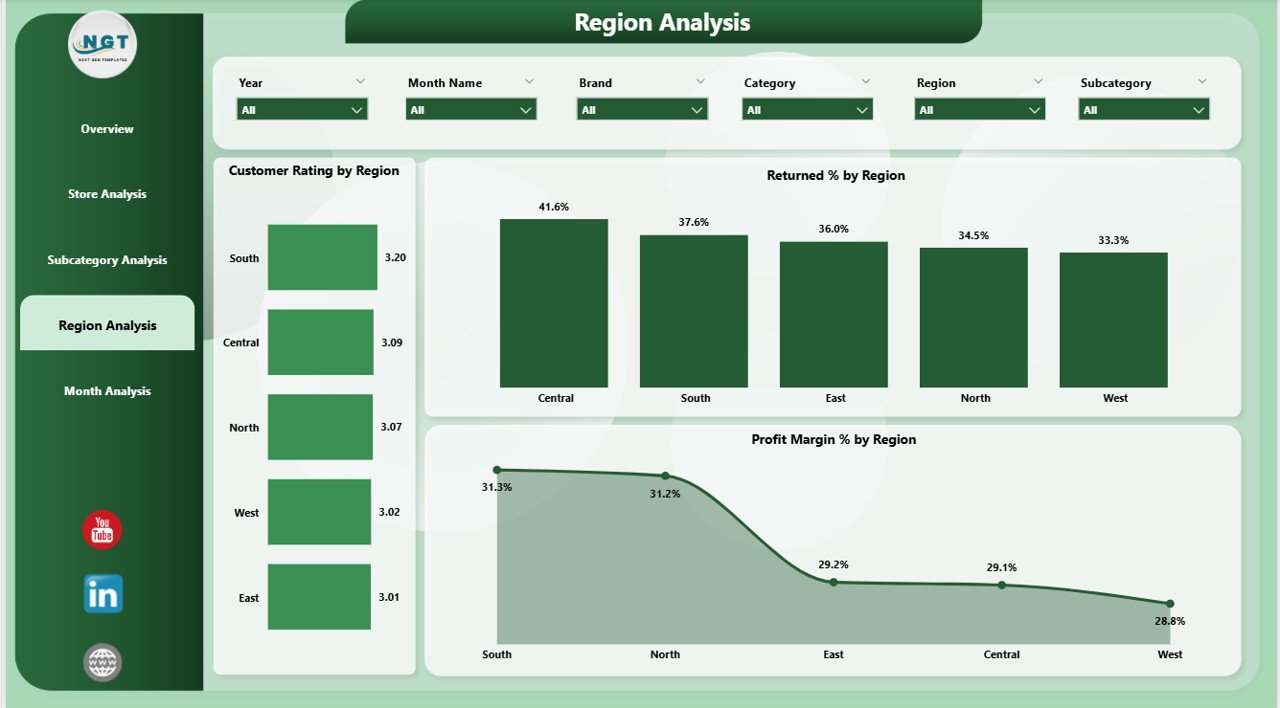
🌍 Region Analysis Page – Monitor regional sales, ratings, return %, and profit margins to plan store and stock strategies.
-
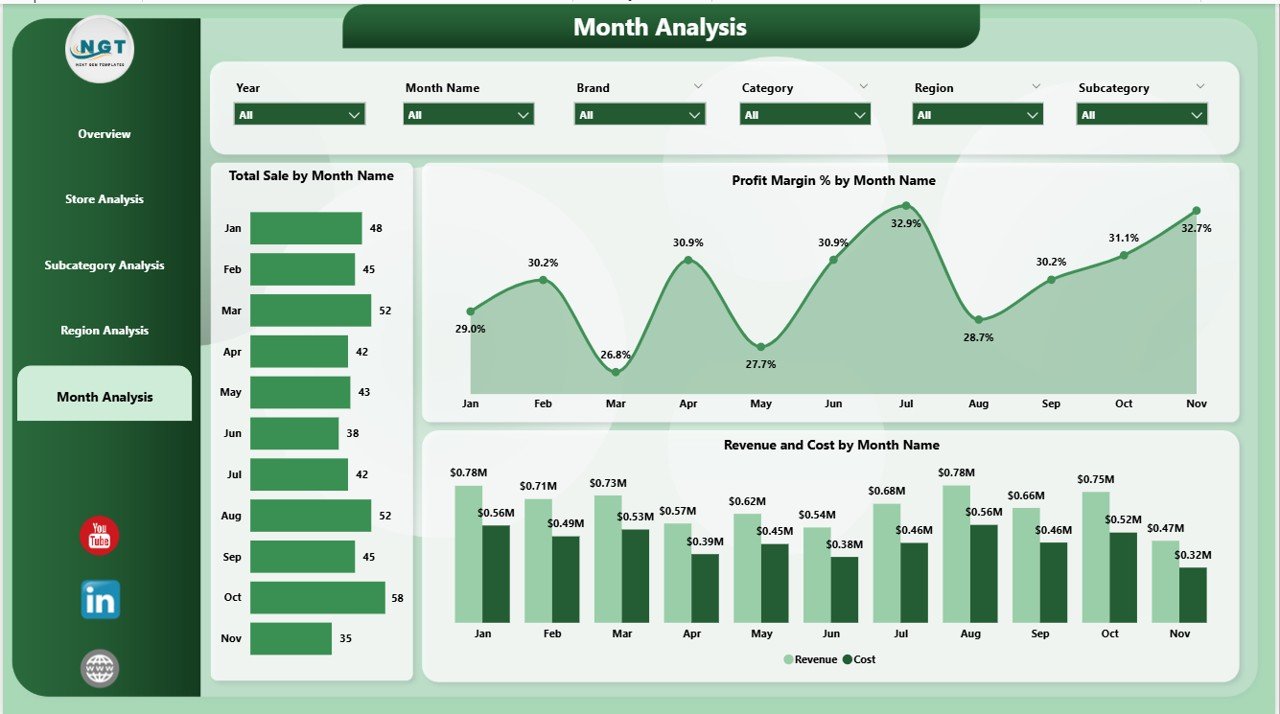
📅 Monthly Trends Page – Track seasonal demand, revenue trends, sales spikes, profit margins, and monthly cost changes.
-
🎯 Smart Slicers – Filter results by brand, store, region, category, subcategory, or month instantly.
-
⚡ Real-Time Insights – Refresh the data source and get updated performance instantly.
-
💼 Perfect for Reporting – Clean visuals ideal for management reviews, strategy discussions, and team presentations.
📂 What’s Inside the Footwear & Accessories Dashboard
1. Overview Page – Your Complete Business Snapshot
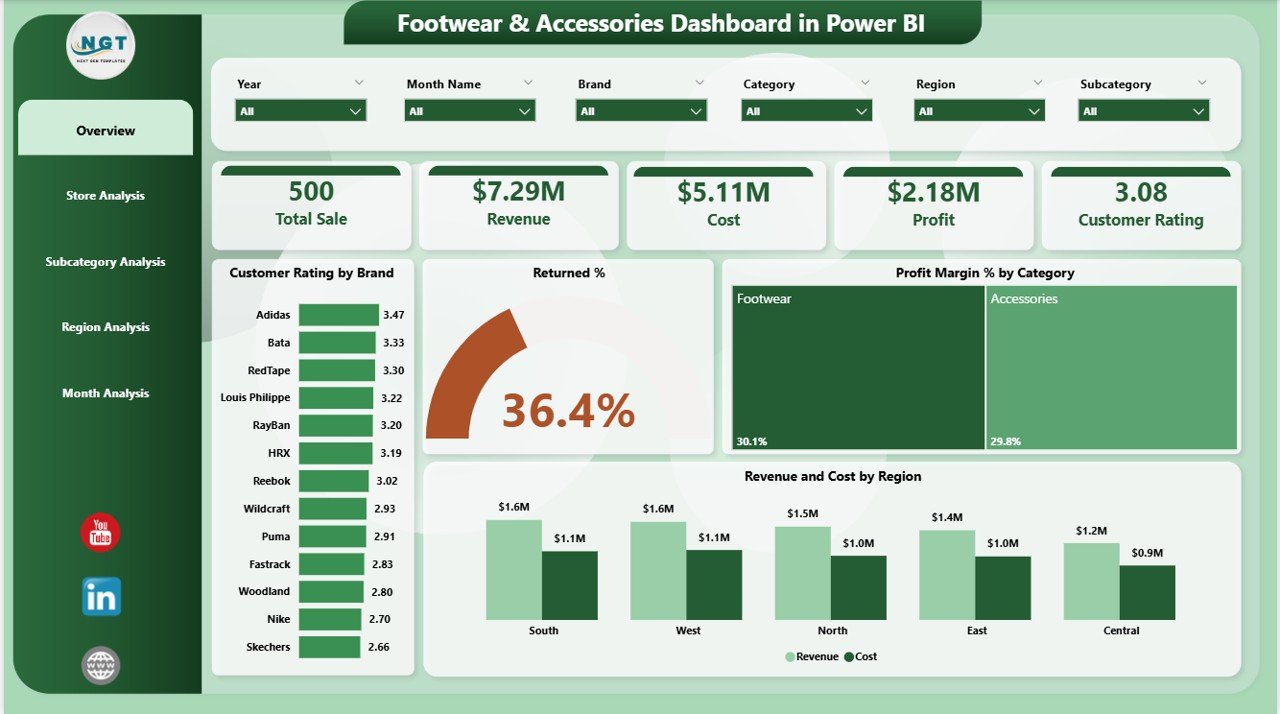
This page provides:
-
Four KPI cards (Sales, Revenue, Profit, Ratings)
-
Customer rating by brand
-
Return % by category
-
Profit margin % by category
-
Revenue vs cost by region
This gives retailers a full understanding of business health at a glance.
2. Store Analysis Page – Identify Top & Bottom Performing Stores
With visuals for ratings, profit, revenue, and costs by store, this page helps you:
-
Compare store efficiency
-
Identify stores needing training/support
-
Optimize stock and cost planning
3. Subcategory Analysis Page – Track Product-Level Success
Deep insights into:
-
Sales by subcategory
-
Customer rating by subcategory
-
Revenue vs cost for each product group
Perfect for inventory planning and product portfolio decisions.
4. Region Analysis Page – Understand Where You Perform Best
This page shows:
-
Customer ratings across regions
-
Return % by region
-
Profit margin % by region
Retailers use this to manage regional pricing, marketing, and product mixes.
5. Monthly Trends Page – Analyze Seasonality & Growth Patterns
Charts include:
-
Total sales by month
-
Profit margin % by month
-
Monthly revenue vs cost
Ideal for planning seasonal stock, promotions, and demand forecasting.
🛠️ How Retailers Use This Dashboard
-
Identify high-return product categories
-
Improve customer satisfaction using rating insights
-
Track store-wise performance for operational efficiency
-
Forecast demand based on seasonal trends
-
Compare brands, categories, and regions instantly
-
Reduce costs by analyzing revenue-to-cost ratios
-
Take action based on real-time data rather than assumptions
🌟 Who Should Use This Dashboard
-
Retail store managers
-
Footwear & accessory brand owners
-
Business analysts
-
Category managers
-
Regional managers
-
Inventory planners
-
E-commerce teams
-
Finance & leadership teams
### Click here to read the Detailed blog post
Visit our YouTube channel to learn step-by-step video tutorials


Reviews
There are no reviews yet.