


The Food Service KPI Dashboard in Power BI is an essential tool for managers, operators, and business owners in the food service industry. It provides real-time insights into key performance indicators (KPIs) such as sales, customer satisfaction, inventory, labor costs, and more. With this interactive and customizable dashboard, you can efficiently track the performance of your food service business, identify trends, and make data-driven decisions to optimize operations and improve profitability.
Whether you run a restaurant, a catering service, or any other food service operation, this Food Service KPI Dashboard in Power BI enables you to stay on top of critical metrics that drive business success. By leveraging real-time data, this tool helps you identify areas for improvement, streamline operations, and ensure a high level of customer satisfaction while maintaining cost efficiency.
Key Features of the Food Service KPI Dashboard in Power BI
🍽️ Sales & Revenue Tracking
Track daily, weekly, and monthly sales performance. Analyze revenue trends, identify top-selling menu items, and gain insights into sales fluctuations.
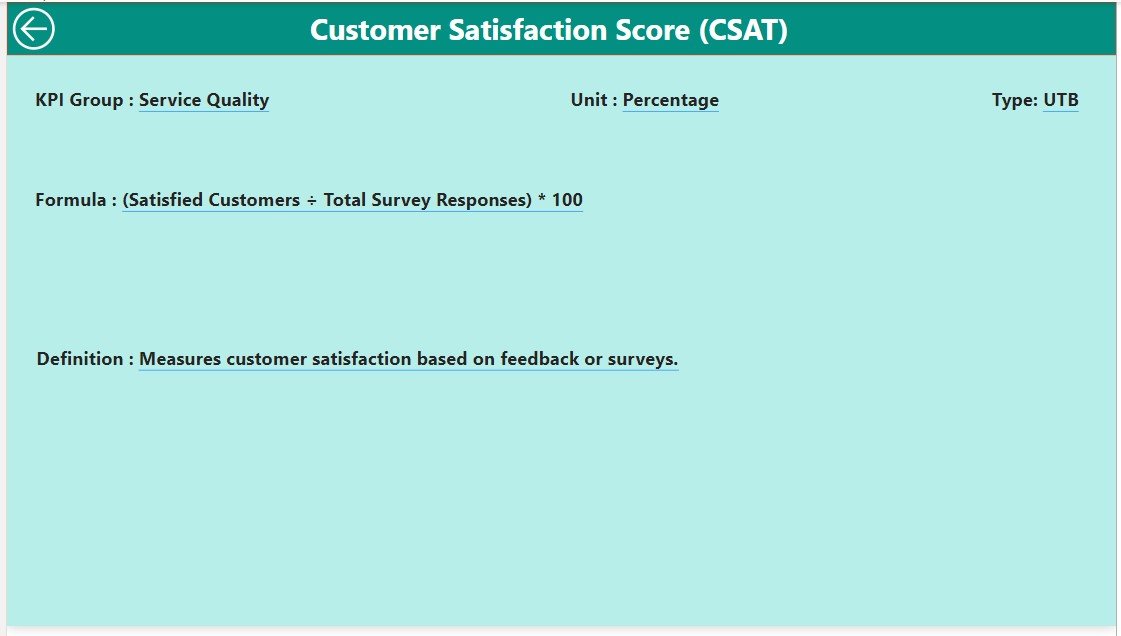
⚡ Customer Satisfaction Monitoring
Monitor customer feedback, reviews, and satisfaction scores to ensure that your customers are happy with their dining experience. Use this data to make improvements and increase loyalty.
📈 Inventory & Waste Management
Track inventory levels, monitor stock usage, and reduce waste. Ensure that you maintain an optimal inventory to avoid stockouts or overstocking, which can impact profitability.
💼 Labor Cost Management
Monitor labor costs and workforce efficiency. Track employee hours, shifts, and productivity to ensure that staffing levels align with sales and operational needs.
🖥️ Interactive & Real-Time Insights
Access real-time data on sales, customer satisfaction, inventory, and more. The dashboard provides interactive charts, filters, and slicers to dive deep into specific data points and gain valuable insights.
Why You’ll Love the Food Service KPI Dashboard in Power BI

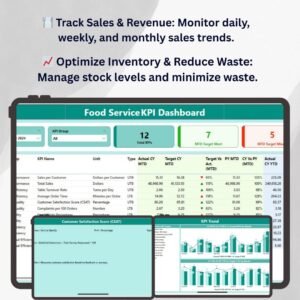
✅ Track Sales & Revenue Trends
Monitor sales performance in real-time and identify top-performing menu items, promotions, or events. Use this data to improve pricing strategies and boost overall revenue.
✅ Improve Customer Satisfaction
Stay on top of customer feedback, satisfaction ratings, and reviews. Ensure that your customers are happy and make informed decisions on how to improve service quality.
✅ Optimize Inventory & Reduce Waste
Track inventory in real-time, optimize stock levels, and reduce waste by identifying slow-moving items. Keep your food service operation cost-effective and efficient.
✅ Monitor Labor Costs & Efficiency
Track labor costs in relation to sales to ensure optimal staffing. Make adjustments to labor schedules based on peak hours and slow periods to maximize profit.
✅ Data-Driven Decision Making
Make smarter, data-driven decisions by leveraging real-time insights into every aspect of your food service operation, from sales and inventory to customer satisfaction and labor costs.
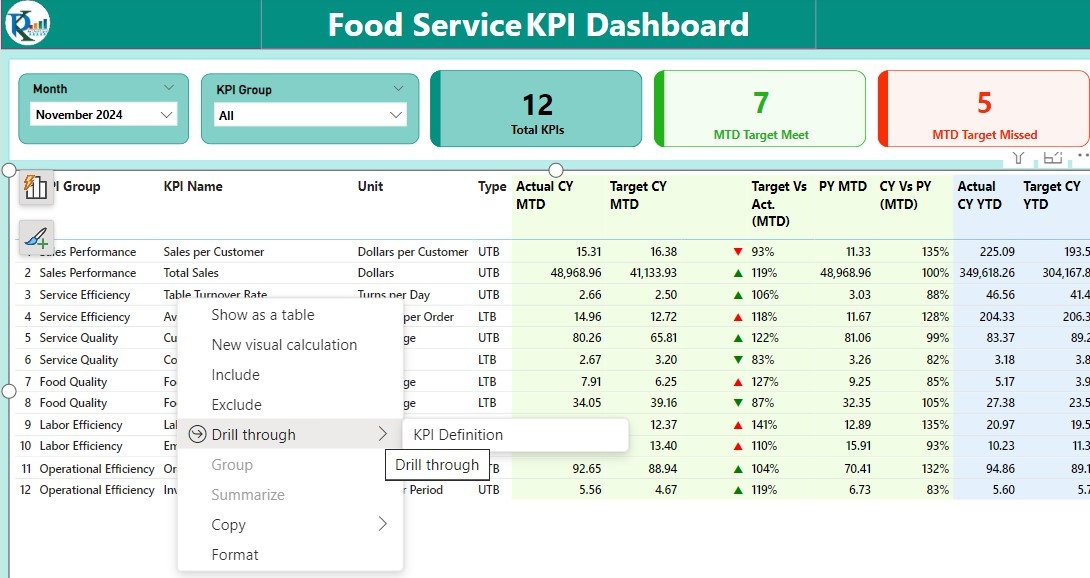
What’s Inside the Food Service KPI Dashboard Template?
- Sales & Revenue Tracking: Monitor daily, weekly, and monthly sales performance.
- Customer Satisfaction: Track customer feedback, satisfaction ratings, and reviews.
- Inventory & Waste Management: Track stock levels, monitor usage, and reduce waste.
- Labor Cost Monitoring: Track employee hours, wages, and labor cost efficiency.
- Real-Time Data Insights: Gain real-time insights into key metrics for improved decision-making.
- Interactive Features: Explore data with filters, slicers, and dynamic visualizations.
How to Use the Food Service KPI Dashboard in Power BI
1️⃣ Download the Template: Get instant access to your Food Service KPI Dashboard in Power BI.
2️⃣ Input Your Data: Enter your sales, customer satisfaction, inventory, and labor data into the dashboard.
3️⃣ Track & Monitor KPIs: Use the dashboard to monitor your food service business performance in real time.
4️⃣ Analyze & Optimize: Use insights to improve sales strategies, inventory management, customer service, and labor efficiency.
Who Can Benefit from the Food Service KPI Dashboard in Power BI?
🔹 Restaurant Owners & Managers
🔹 Catering Service Providers
🔹 Food Truck Operators
🔹 Hospitality & Food Service Industry Professionals
🔹 Operations Managers & Analysts in Food Service
🔹 Anyone Looking to Optimize Food Service Business Performance
Track, analyze, and optimize every aspect of your food service business with the Food Service KPI Dashboard in Power BI. Gain valuable insights into sales, customer satisfaction, inventory, and labor costs to enhance your operations and improve profitability.
Click here to read the Detailed blog post
Visit our YouTube channel to learn step-by-step video tutorials
Youtube.com/@PKAnExcelExpert


Reviews
There are no reviews yet.