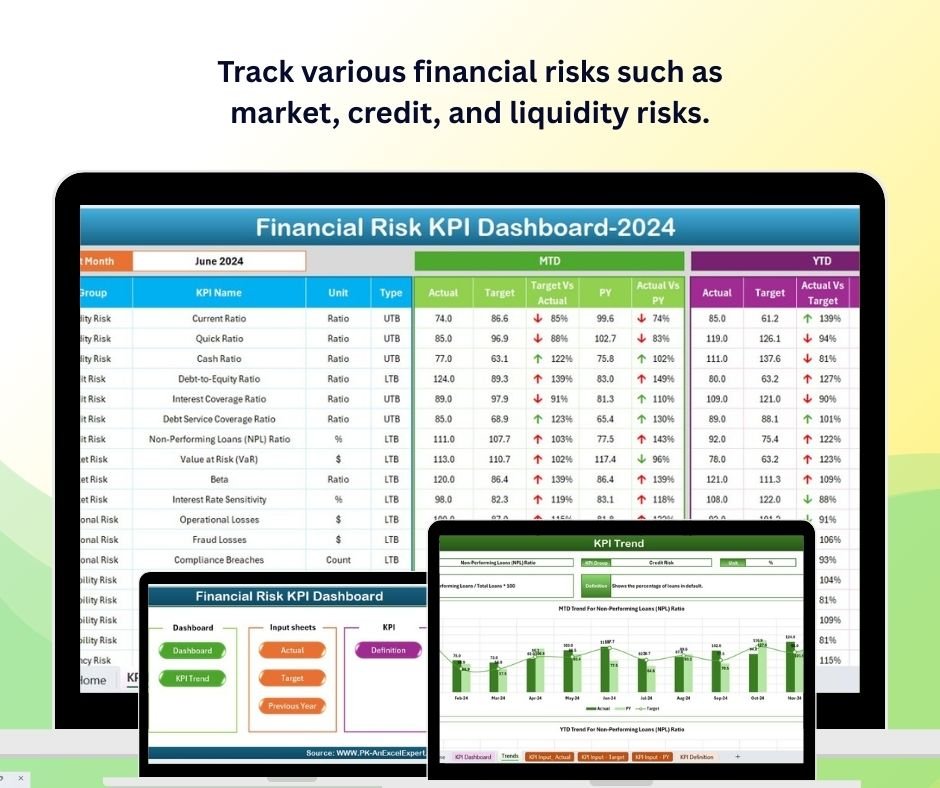
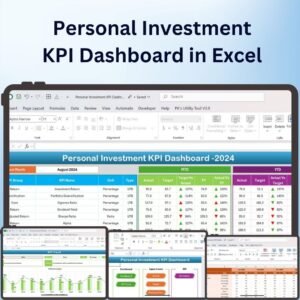
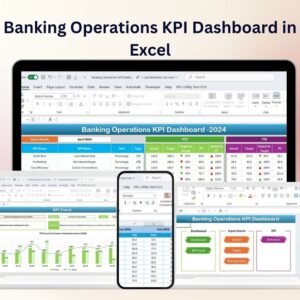
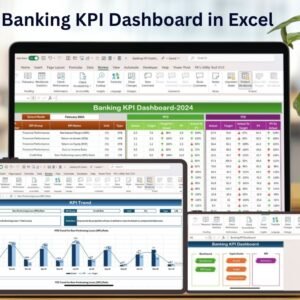
The Financial Risk KPI Dashboard in Excel is an essential tool for finance teams, risk managers, and business leaders to identify, track, and manage key financial risks within an organization. This Excel-based dashboard allows you to monitor financial performance, assess risk factors, and track the effectiveness of risk mitigation strategies, ensuring that your company remains financially stable and protected against potential threats.
With real-time data tracking, customizable charts, and a user-friendly interface, this dashboard helps you make informed decisions about risk management, spot trends, and optimize your financial risk strategies.
Key Features of the Financial Risk KPI Dashboard in Excel:
📊 Financial Risk Identification
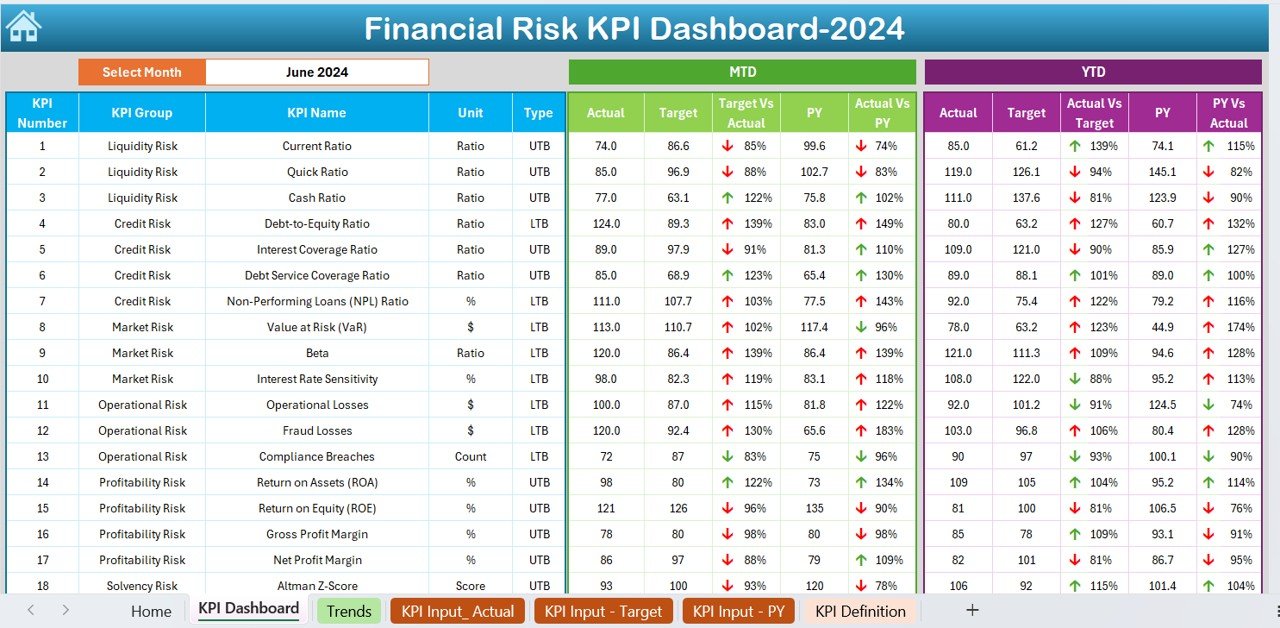
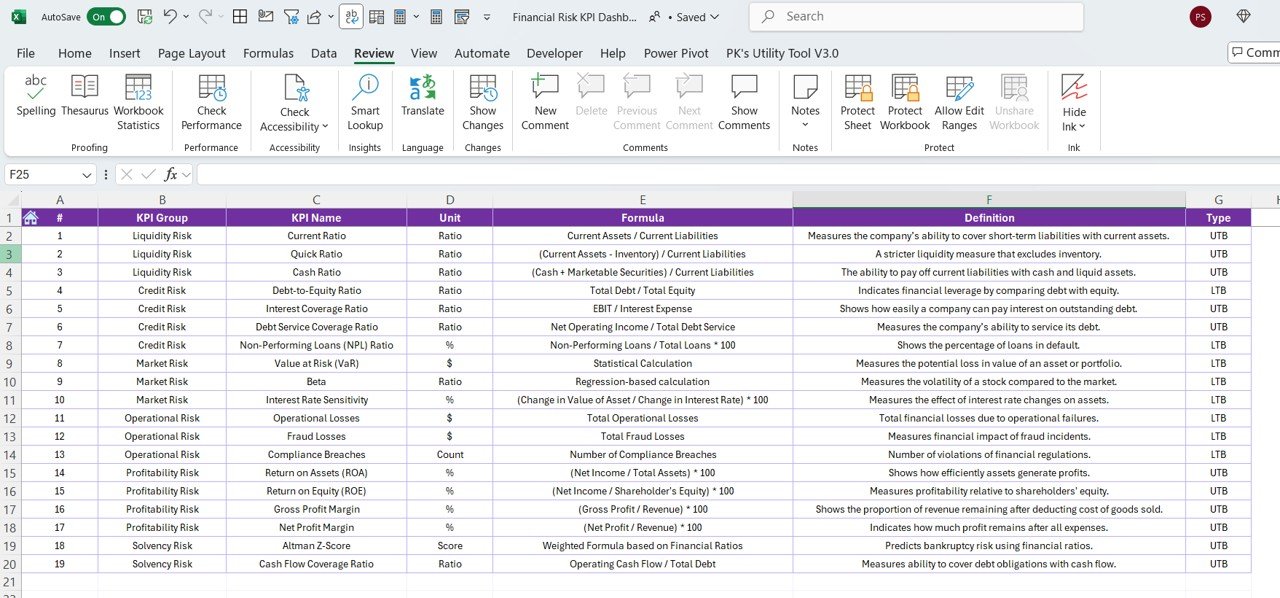
Track and categorize financial risks, including market volatility, credit risk, liquidity risk, and operational risk, to identify areas of concern and take proactive measures.
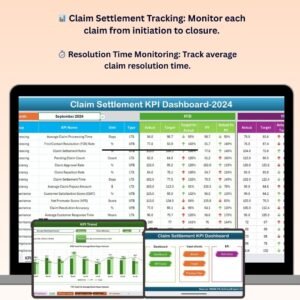
📈 Risk Mitigation Tracking
Monitor the effectiveness of your risk mitigation strategies, including hedging, insurance, and contingency planning, ensuring that your organization is well-protected.
📅 Risk Assessment Scores
Evaluate risk factors based on key metrics, such as risk likelihood and impact, and assign scores to prioritize mitigation efforts.
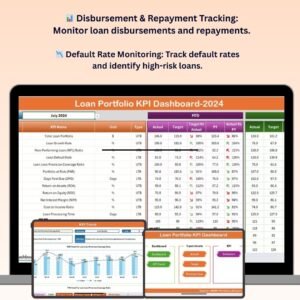
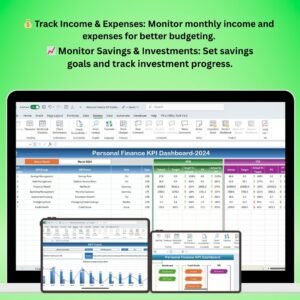
💸 Cash Flow and Liquidity Monitoring
Track cash flow, liquidity ratios, and debt levels to ensure that your company can meet its financial obligations and avoid liquidity crises.
📉 Market and Credit Risk Analysis
Analyze market fluctuations, interest rates, and credit risks, allowing you to manage exposure to external financial factors and minimize losses.
🚀 Why You’ll Love the Financial Risk KPI Dashboard in Excel:
✅ Identify Key Financial Risks – Easily identify and track financial risks, including market, credit, and liquidity risks, to ensure your organization stays ahead of potential threats.
✅ Track Risk Mitigation – Monitor the effectiveness of your risk mitigation strategies, ensuring that they are successful in reducing financial exposure.
✅ Data-Driven Decision Making – Make informed financial decisions by tracking key risk metrics and evaluating the effectiveness of your risk management strategies.
✅ Improve Cash Flow Management – Monitor cash flow and liquidity levels to prevent cash shortages and optimize your company’s financial stability.
✅ Customizable and Easy-to-Use – This dashboard is fully customizable to meet your organization’s specific financial risk management needs, with an intuitive and easy-to-navigate interface.
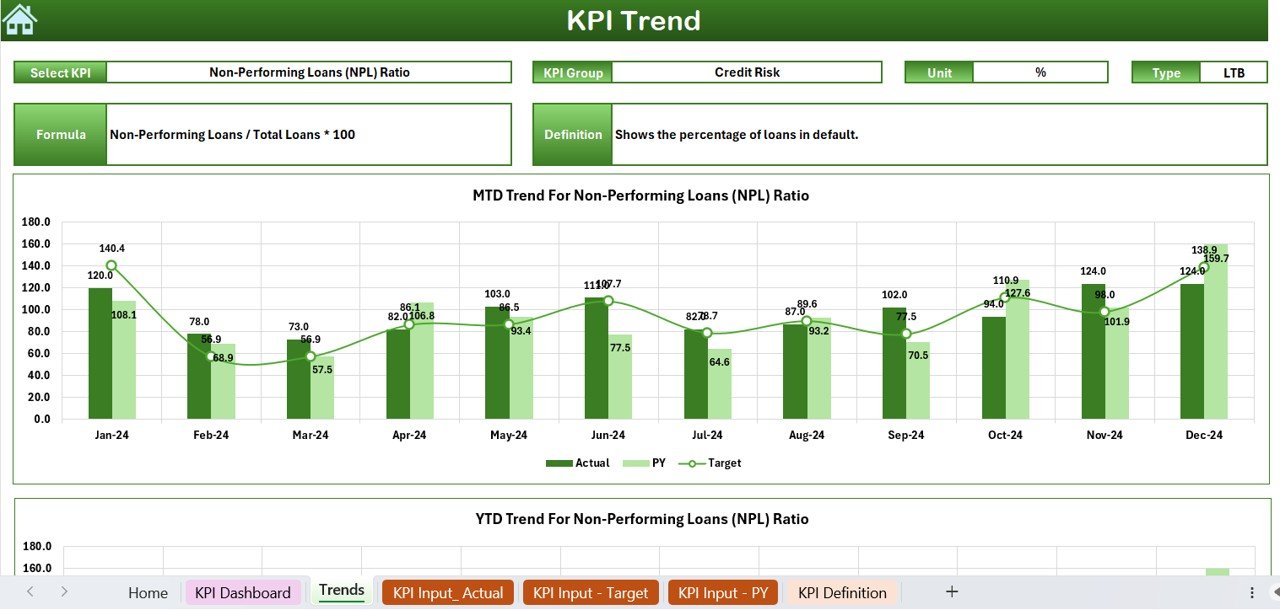
✅ Optimize Financial Strategies – Use the dashboard to identify trends and patterns in financial risk data, allowing you to adjust and optimize your financial strategies for better outcomes.
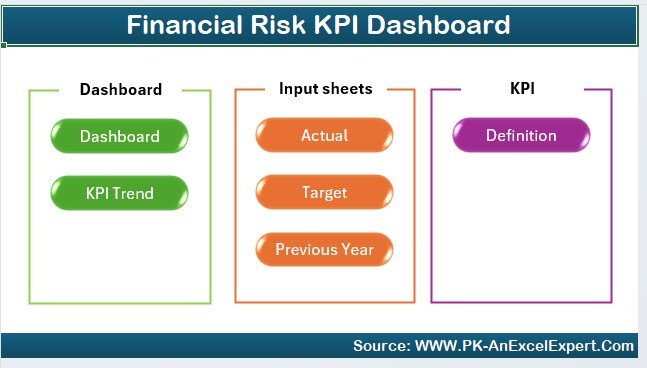
What’s Inside the Financial Risk KPI Dashboard in Excel:
-
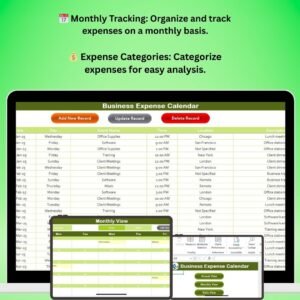
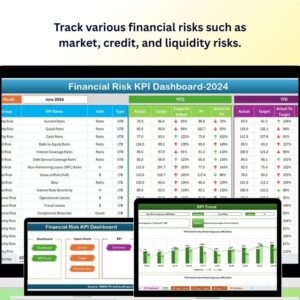
Risk Identification and Tracking: Track various types of financial risks such as market risk, credit risk, and liquidity risk, helping you stay ahead of potential financial threats.
-
Risk Mitigation and Strategy Monitoring: Monitor and track the effectiveness of risk mitigation strategies, such as insurance policies, hedging, and contingency planning.
-
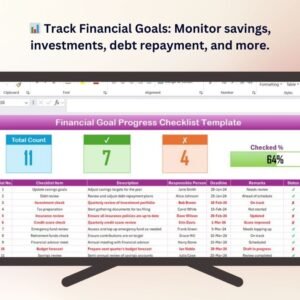
Risk Assessment Scores: Assign risk likelihood and impact scores to different risk factors, helping prioritize mitigation efforts and allocate resources efficiently.
-
Liquidity and Cash Flow Management: Track liquidity ratios, cash flow trends, and debt levels to ensure your organization can meet financial obligations and avoid liquidity issues.
-
Market and Credit Risk Analysis: Analyze market fluctuations, interest rate risks, and credit exposure to minimize financial losses and reduce risk.
-
Custom Reports: Generate tailored reports that summarize financial risk KPIs, helping finance teams and management make data-driven decisions.
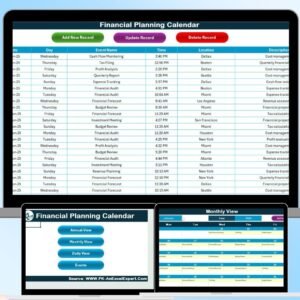
How to Use the Financial Risk KPI Dashboard in Excel:
1️⃣ Download the Template – Instantly access your Excel file upon purchase.
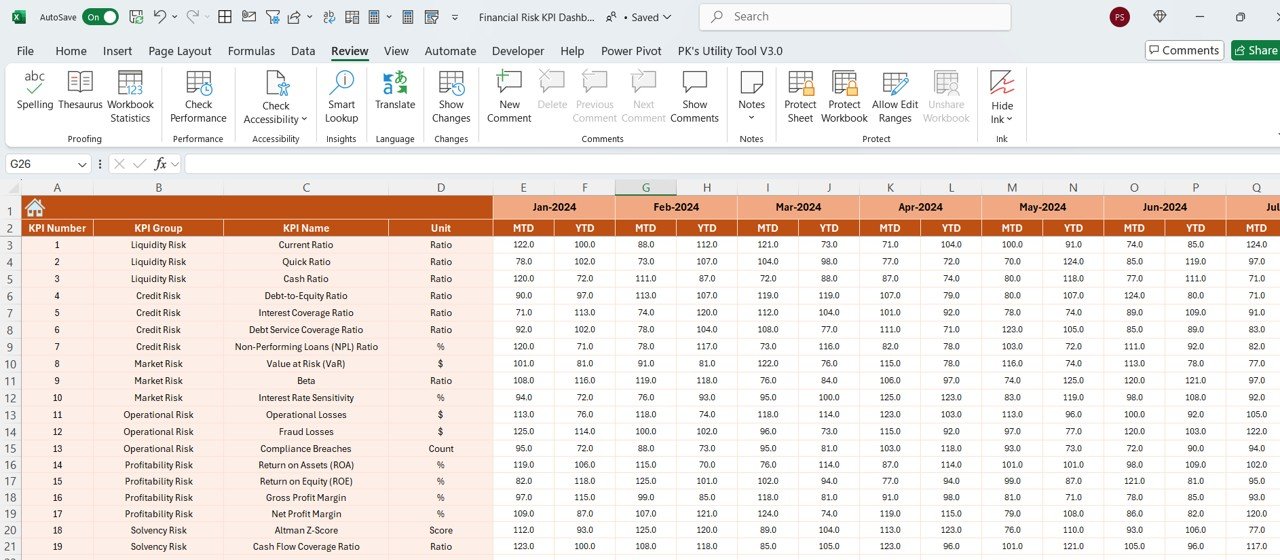
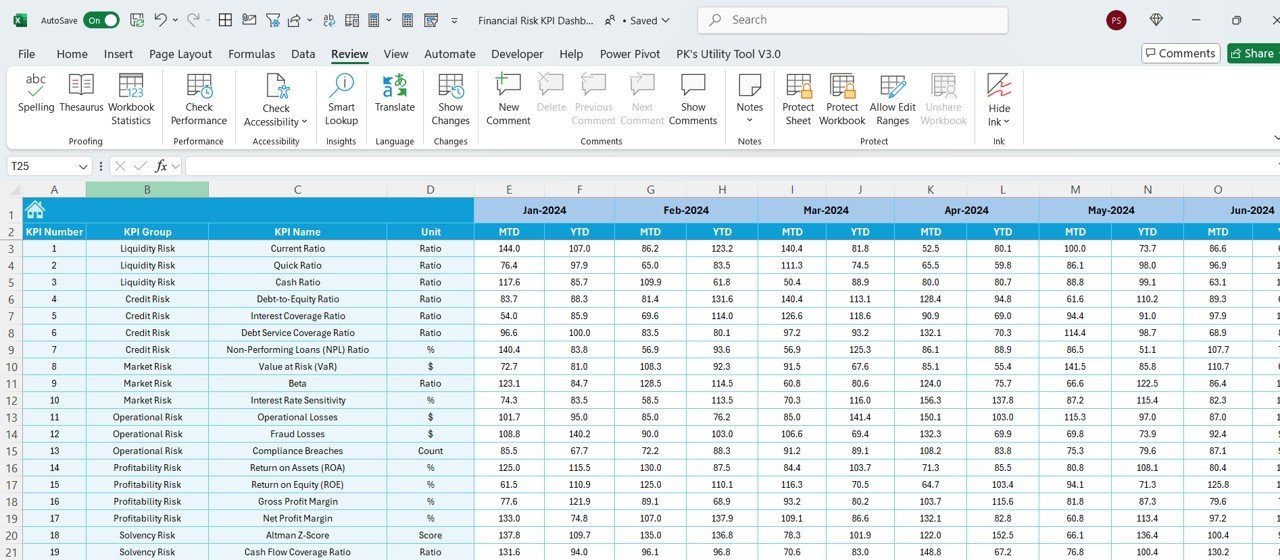
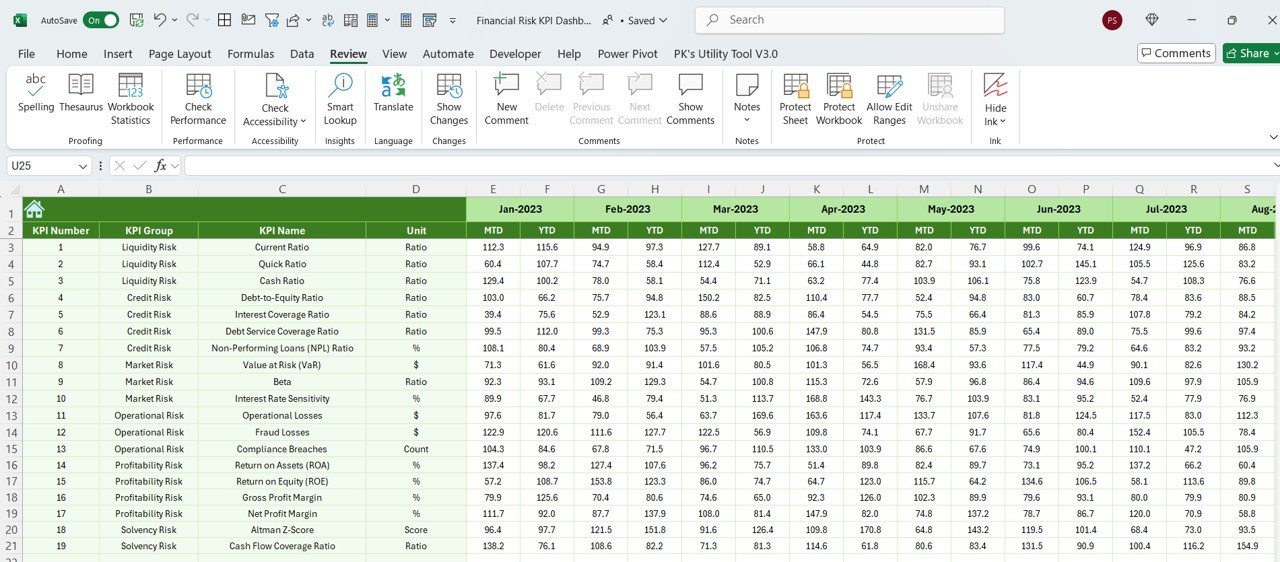
2️⃣ Input Financial Data – Add your financial data, including cash flow, liquidity ratios, debt levels, and market risk factors.
3️⃣ Track Risks and Mitigation – Monitor financial risks and track the effectiveness of mitigation strategies, ensuring that your company stays protected.
4️⃣ Evaluate Risk Assessment Scores – Assign likelihood and impact scores to each risk to prioritize mitigation and allocate resources effectively.
5️⃣ Generate Reports – Create customized reports that summarize your financial risk management performance, helping you make strategic decisions.
Who Can Benefit from the Financial Risk KPI Dashboard in Excel:
-
Finance Managers
-
Risk Management Teams
-
Chief Financial Officers (CFOs)
-
Business Executives
-
Financial Analysts
-
Small and Medium-Sized Businesses (SMBs)
-
Large Enterprises with Complex Financial Risk Management Needs
The Financial Risk KPI Dashboard in Excel is an indispensable tool for organizations looking to effectively manage financial risks and make informed, data-driven decisions. Whether you are managing liquidity, credit risk, or market fluctuations, this dashboard provides the insights you need to protect your company and optimize your financial strategies.
Click here to read the Detailed blog post
https://www.pk-anexcelexpert.com/financial-risk-kpi-dashboard-in-excel/
Visit our YouTube channel to learn step-by-step video tutorials
Youtube.com/@PKAnExcelExpert


Reviews
There are no reviews yet.