
The Finance KPI Dashboard in Google Sheets is a comprehensive tool designed to help finance professionals track, monitor, and optimize key performance indicators (KPIs) that are essential to financial success. Whether you’re managing financial planning, budgeting, cash flow, or investment performance, this dashboard provides a clear, real-time view of critical metrics that directly impact financial health.
This Google Sheets dashboard empowers CFOs, financial analysts, and business owners to make data-driven decisions, streamline financial reporting, and improve financial management. With visual charts, dynamic graphs, and customizable fields, this tool is ideal for any organization looking to enhance financial performance and ensure long-term profitability.
Key Features of the Finance KPI Dashboard in Google Sheets:
📊 Comprehensive KPI Tracking
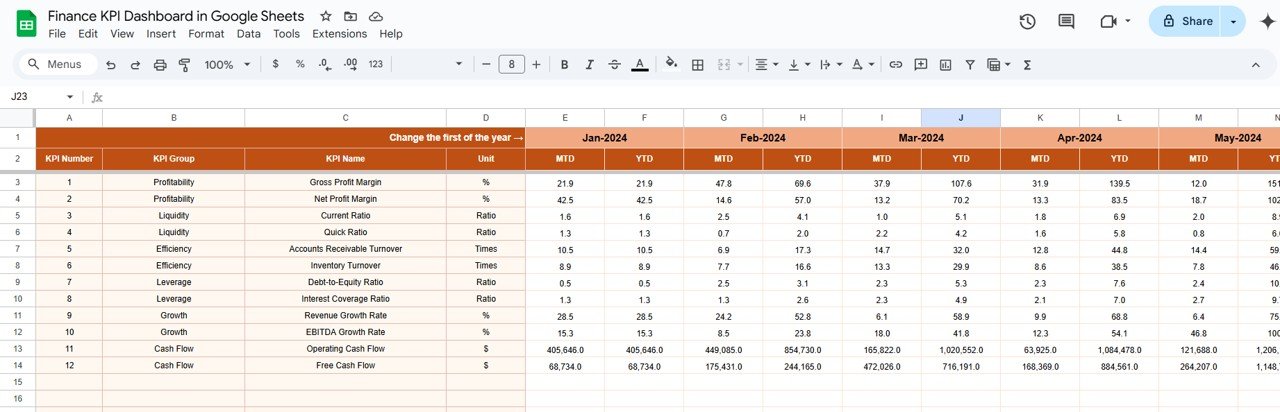
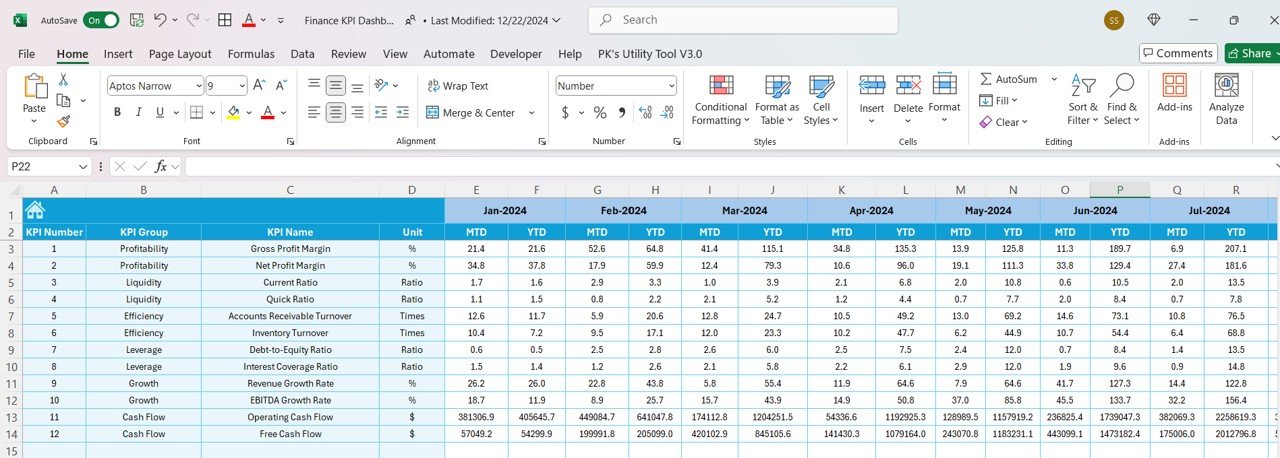
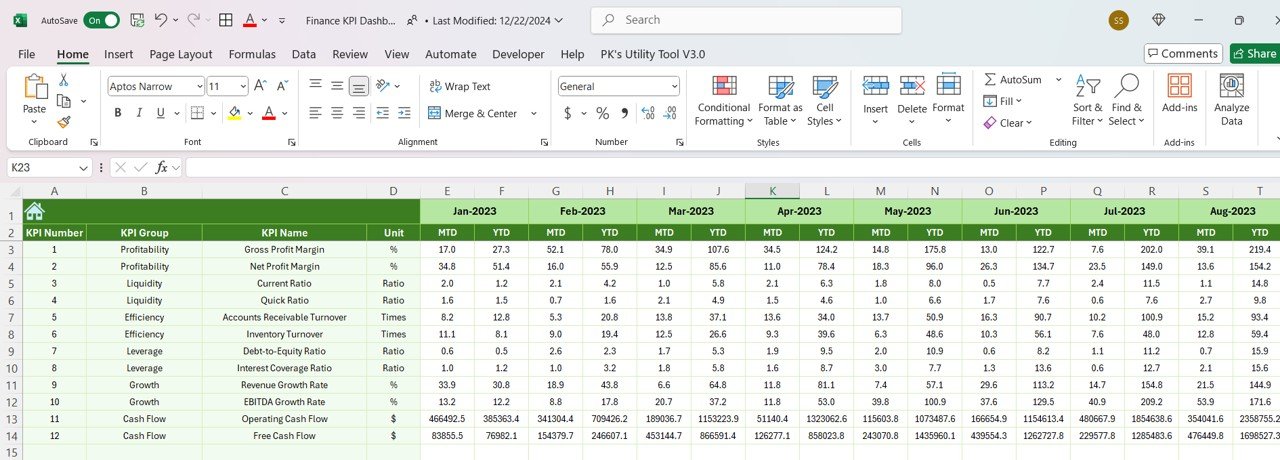
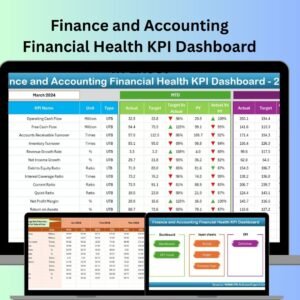
Track essential finance KPIs, including revenue, expenses, profit margins, cash flow, return on investment (ROI), and debt-to-equity ratios—all in one dashboard.
📈 Real-Time Financial Monitoring
Monitor your financial performance in real-time with up-to-date data on income, expenses, cash flow, and overall profitability.
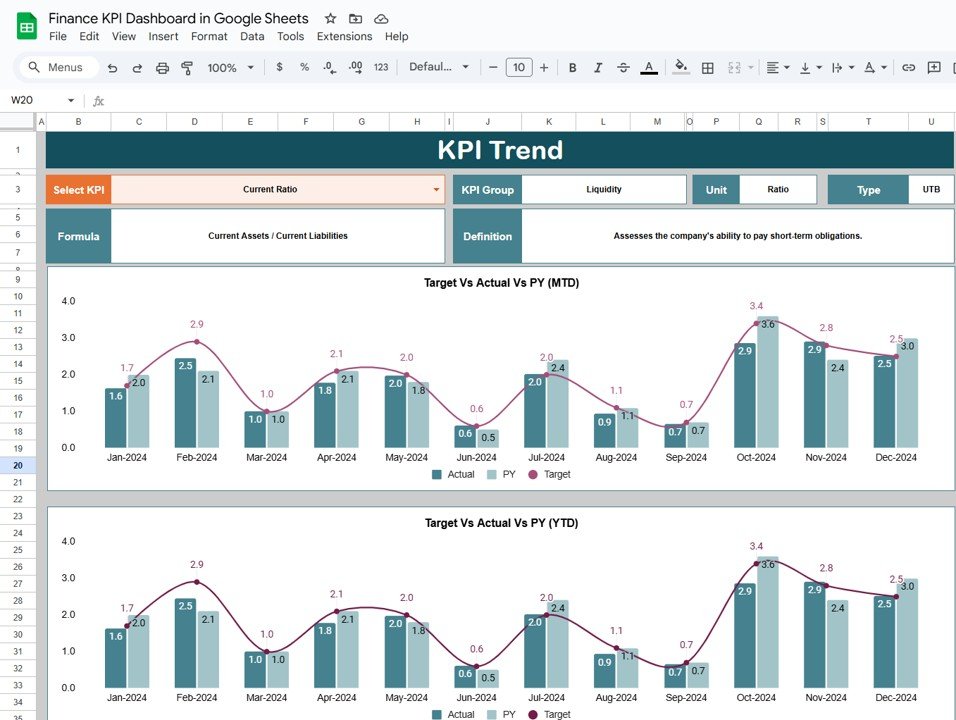
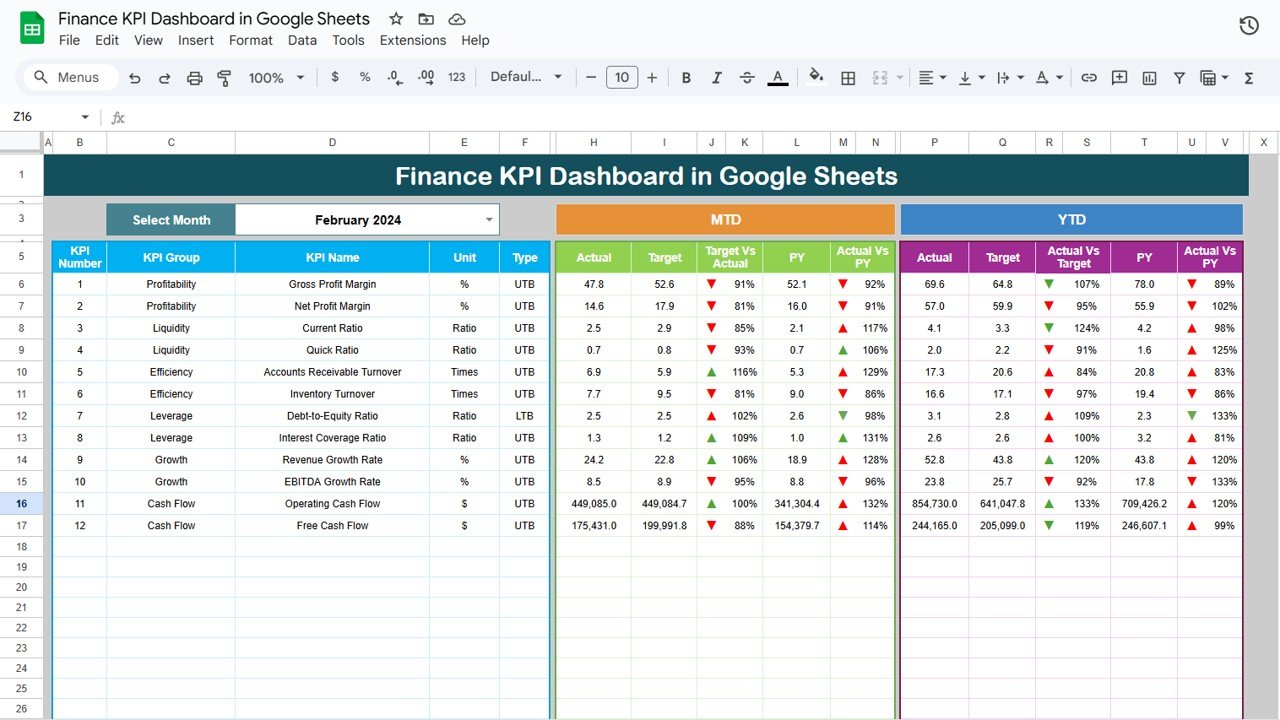
📅 Month-to-Date (MTD) and Year-to-Date (YTD) Performance
Compare your performance on a monthly and yearly basis to analyze trends, track growth, and measure progress against financial goals.
🎯 Goal Setting and Comparison
Set specific financial goals for each KPI and compare them with actual performance to ensure your organization stays on track to meet its targets.
🛠 Customizable Inputs
Easily input your financial data such as revenue, expenses, and cash flow, and adjust the dashboard to fit your unique financial reporting needs.
🔔 Conditional Formatting Alerts
Receive real-time alerts for underperforming KPIs, such as revenue shortfalls or high expenses, using color-coded indicators to quickly spot areas requiring attention.
💡 Investment and Cash Flow Insights
Track the health of your business’s investments, cash flow, and profitability with dynamic graphs and charts that help you optimize financial strategies.
🚀 Why You’ll Love the Finance KPI Dashboard in Google Sheets:
✅ Monitor Financial Performance – Track your business’s revenue, expenses, and profitability in real time to ensure healthy financial performance.
✅ Optimize Cash Flow – Stay on top of cash flow by monitoring inflows and outflows, helping you avoid liquidity issues.
✅ Improve Financial Planning – Set and track financial goals, ensuring that your business is aligned with its overall financial strategy.
✅ User-Friendly Interface – The dashboard is designed for easy use, even for non-financial professionals, enabling quick data input and understanding.
✅ Fully Customizable – Tailor the dashboard to meet your unique business needs, whether you are tracking corporate finances, investments, or personal finance metrics.
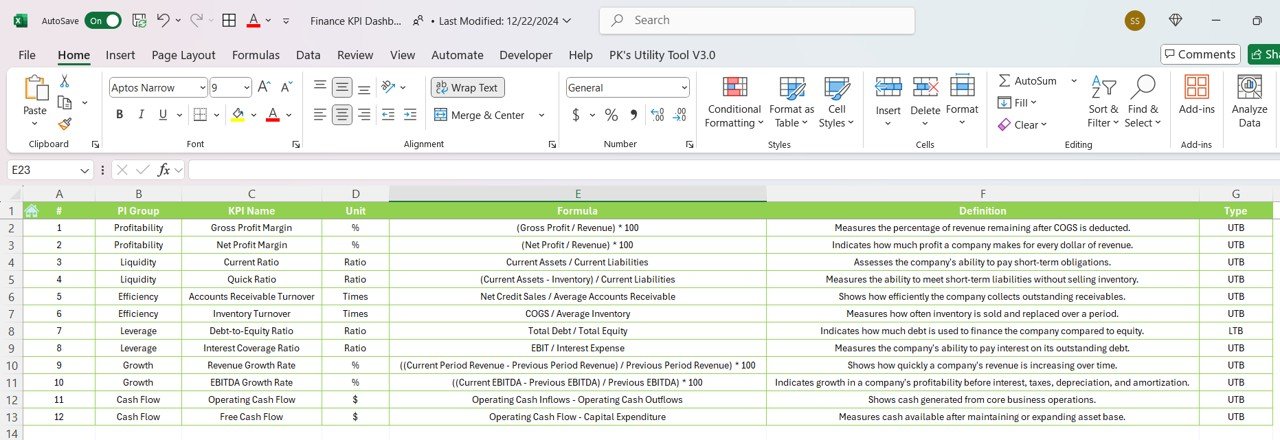
What’s Inside the Finance KPI Dashboard in Google Sheets:
- Revenue KPI: Track total revenue, revenue growth, and sales by product or service category.
- Profit Margin KPI: Measure profit margins by analyzing revenue and cost of goods sold (COGS).
- Cash Flow KPI: Monitor cash inflows and outflows, ensuring positive cash flow for your business.
- Return on Investment (ROI) KPI: Calculate ROI on investments, helping to assess the profitability of business investments.
- Expense Management KPI: Track business expenses, including operational costs, marketing, and overhead.
- Debt-to-Equity Ratio KPI: Monitor your company’s financial leverage by tracking its debt-to-equity ratio.
How to Use the Finance KPI Dashboard in Google Sheets:
1️⃣ Download the Template – Instantly access your Google Sheets dashboard upon purchase.
2️⃣ Input Your Financial Data – Enter your financial data such as revenue, expenses, and cash flow into the pre-designed fields.
3️⃣ Set Financial Targets – Define specific financial targets for revenue, profit margins, and cash flow to guide your decision-making.
4️⃣ Track Performance – Monitor your performance in real time and identify any financial gaps that need immediate attention.
5️⃣ Generate Reports – Use the dashboard to generate comprehensive financial reports for meetings, stakeholder presentations, or analysis.
Who Can Benefit from the Finance KPI Dashboard in Google Sheets:
- CFOs
- Financial Analysts
- Business Owners
- Accountants
- Finance Managers
- Investment Managers
- Entrepreneurs
- Operations Managers
The Finance KPI Dashboard in Google Sheets is an essential tool for any business or individual looking to optimize financial performance, track expenses, improve profitability, and make better financial decisions.
Click here to read the Detailed blog post
https://neotechnavigators.com/finance-kpi-dashboard-in-google-sheets/
Visit our YouTube channel to learn step-by-step video tutorials
Youtube.com/@PKAnExcelExpert


Reviews
There are no reviews yet.