In today’s digital-first sports and entertainment landscape, fan engagement is everything. It’s not just about filling seats — it’s about building strong, long-term relationships with your audience. But without reliable performance tracking, it’s extremely difficult to understand whether your engagement strategies are truly making an impact.
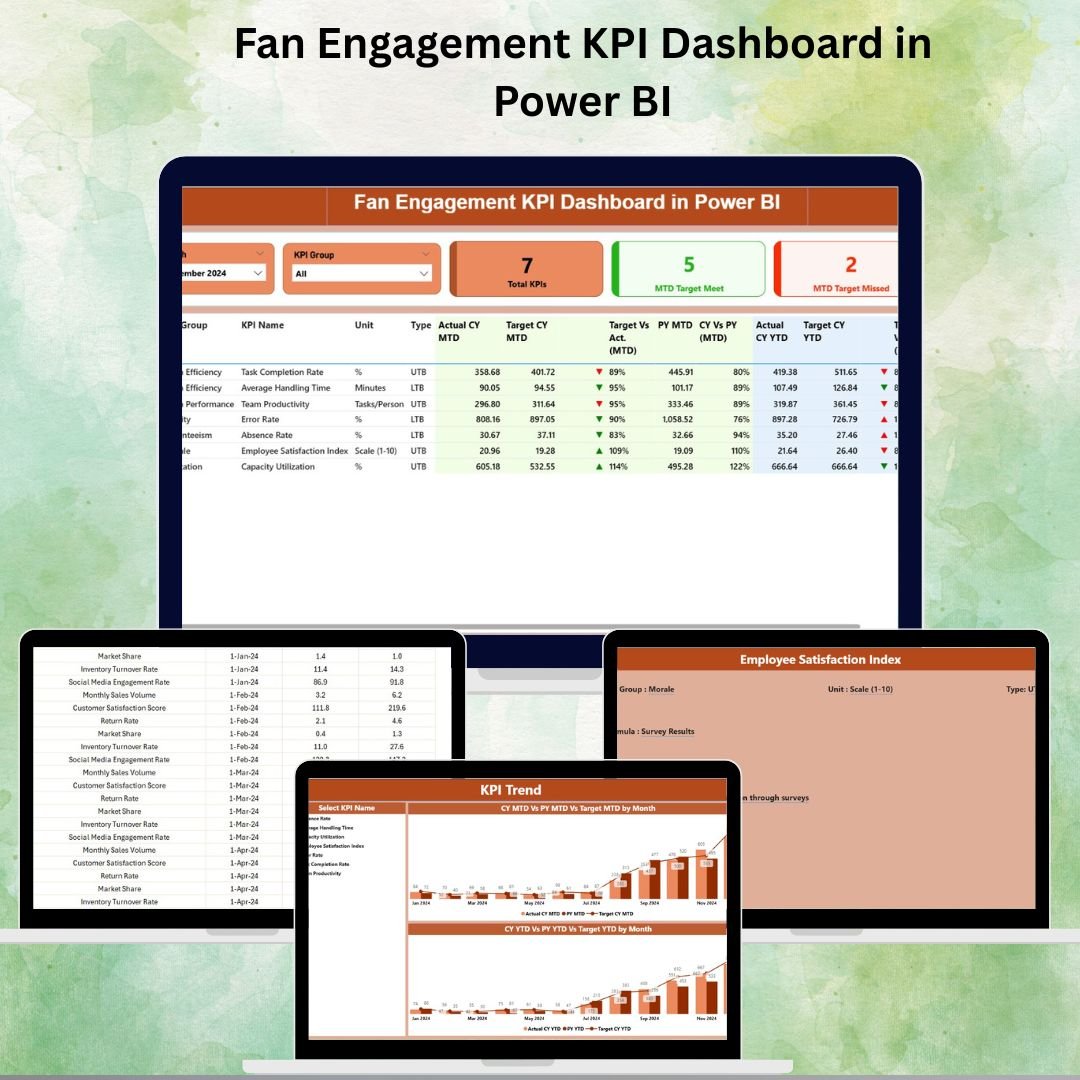
The Fan Engagement KPI Dashboard in Power BI is a powerful and ready-to-use analytics solution that gives you real-time insight into how your fans interact with your organization. It transforms simple Excel data into dynamic visual dashboards, helping you track Month-to-Date (MTD) and Year-to-Date (YTD) performance, compare current results with targets and previous year’s numbers, and quickly identify where engagement is rising — or falling.
Whether you’re monitoring digital campaigns, content interaction, event participation, membership renewals, or social media activity, this dashboard gives you the clarity you need to make better, faster decisions.
✨ Key Features of the Fan Engagement KPI Dashboard
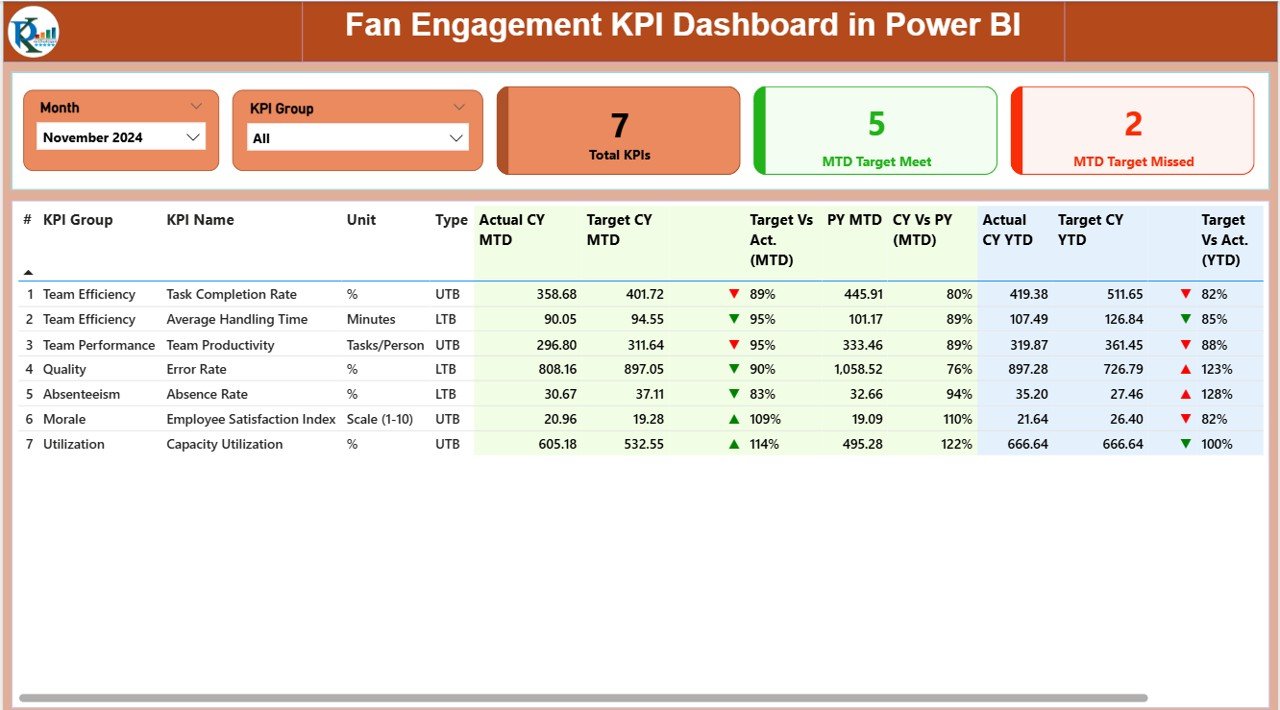
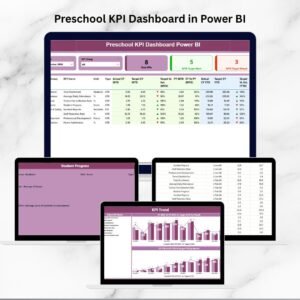
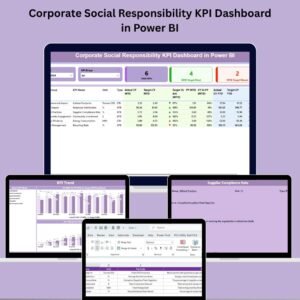
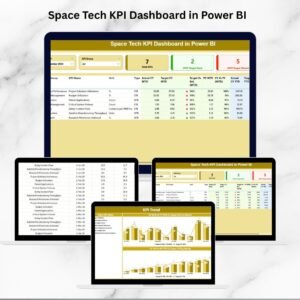
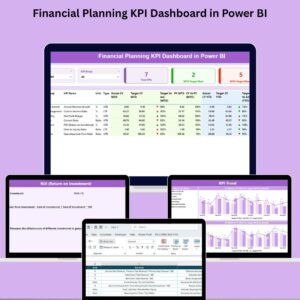
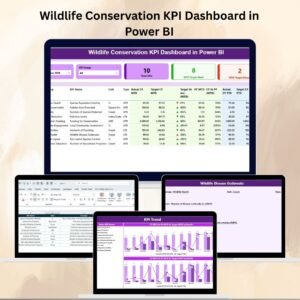
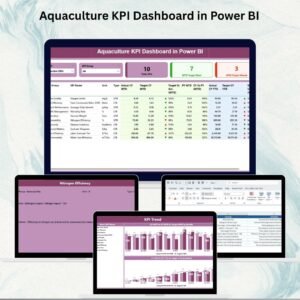
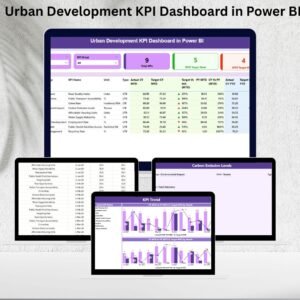
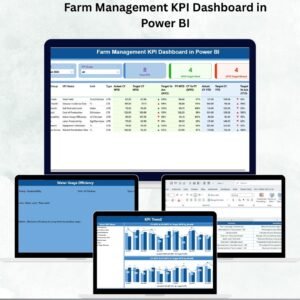
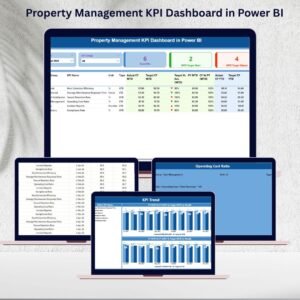
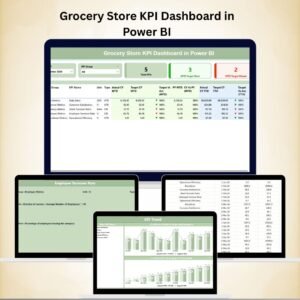
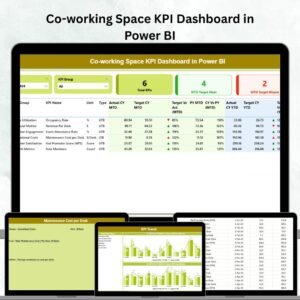
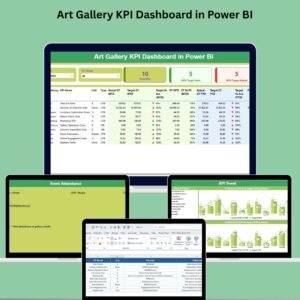
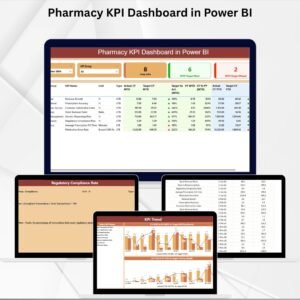
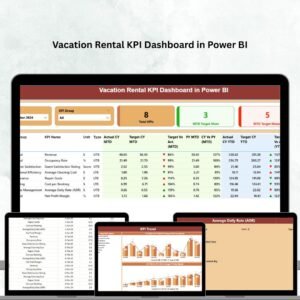
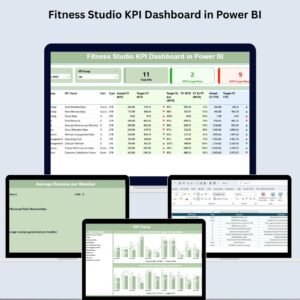
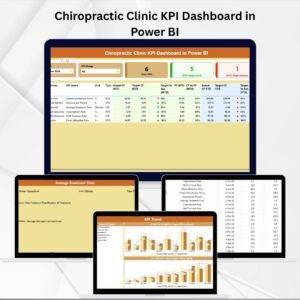
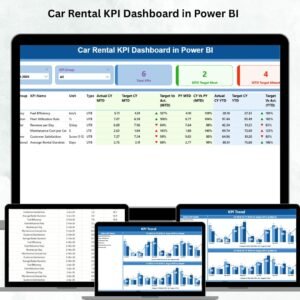
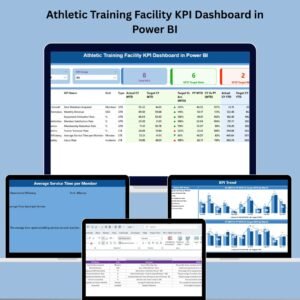
✅ Summary Page – Real-Time Overview
-
Filters for Month and KPI Group
-
KPI Cards that show:
• Total Fan KPIs
• MTD Target Met
• MTD Target Missed -
Detailed KPI table showing Actual vs Target vs Previous Year (both MTD & YTD), KPI type, status icon (▲/▼), and YoY comparisons
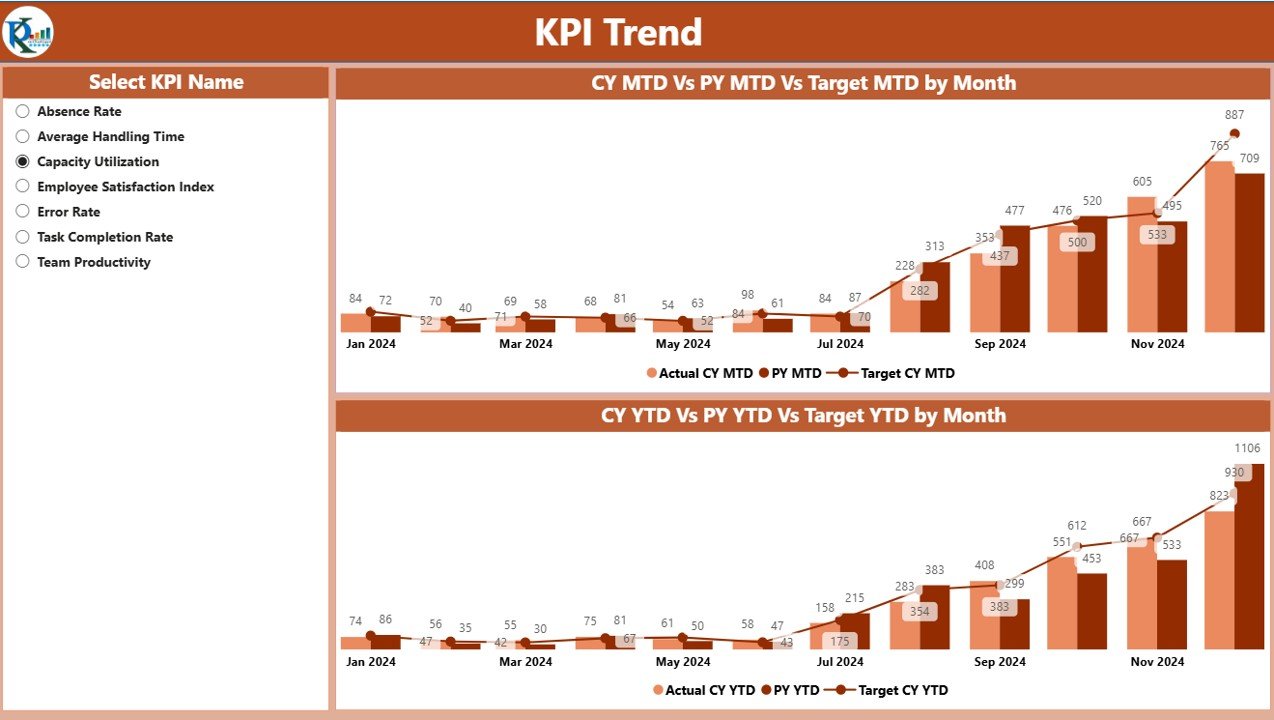
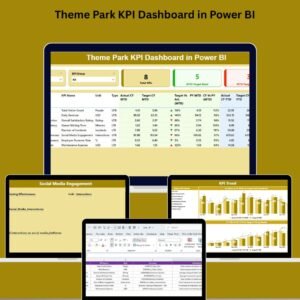
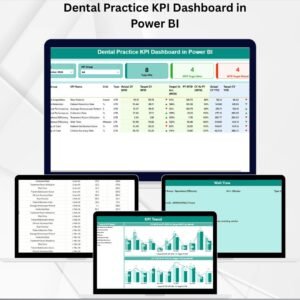
✅ KPI Trend Page – Performance Over Time
-
Two combo charts:
• MTD Actual vs Target vs Previous Year
• YTD Actual vs Target vs Previous Year -
KPI slicer for selecting specific KPIs
-
Perfect for spotting trends, drop-offs, and seasonal patterns
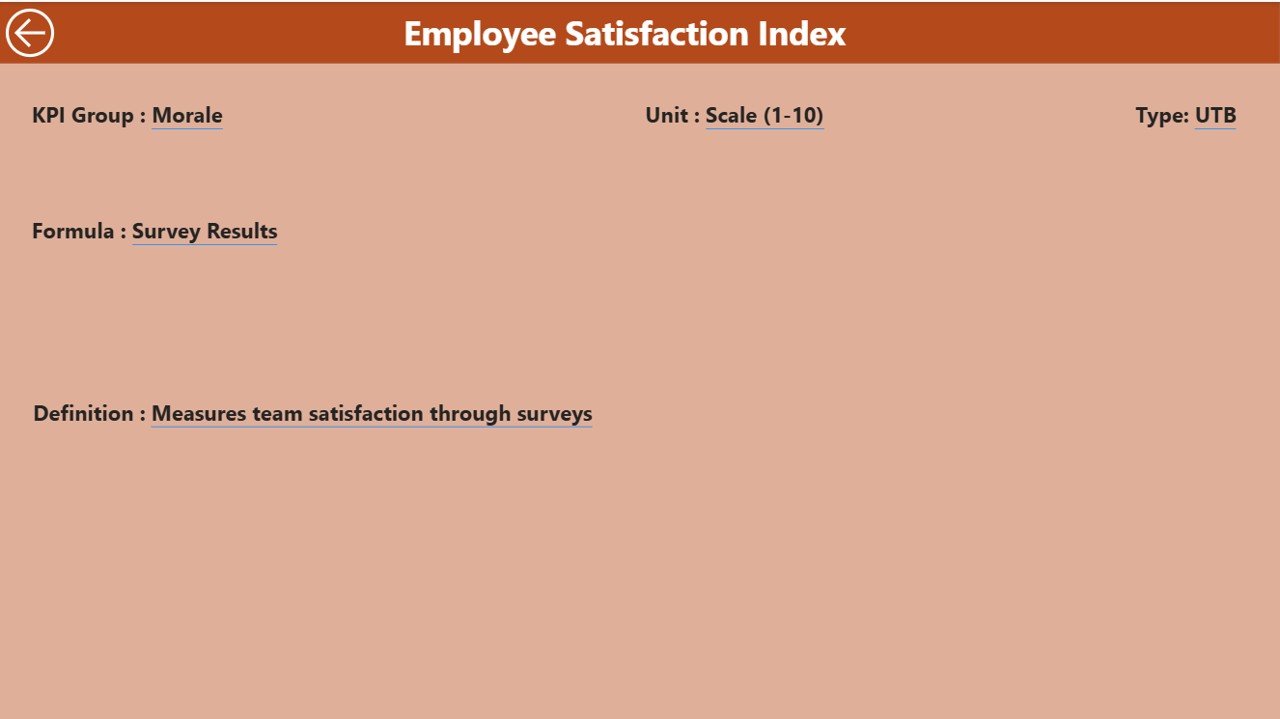
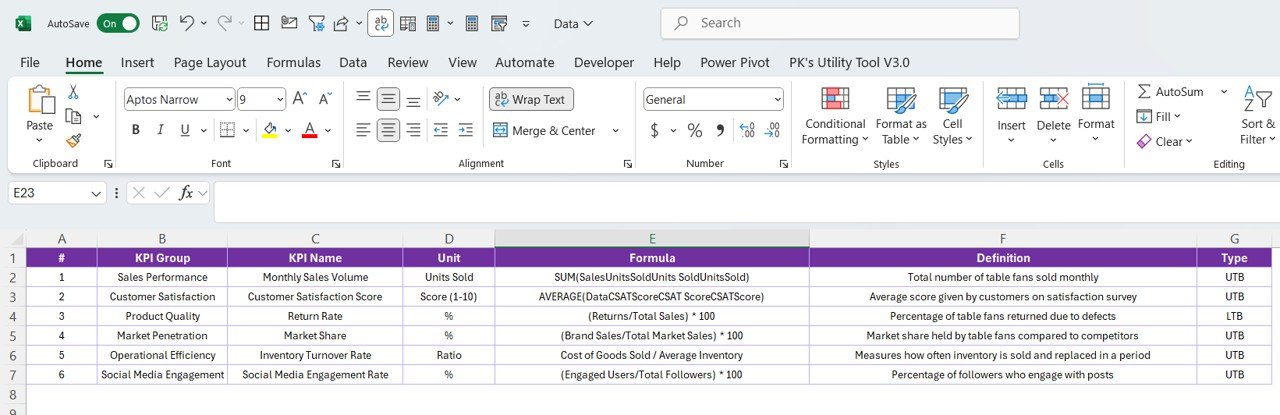
✅ KPI Definition Page – Drill-Through View
-
Displays KPI Formula, Definition, Group, Unit, and KPI Type
-
Accessible directly from the Summary Page via right-click → Drill Through
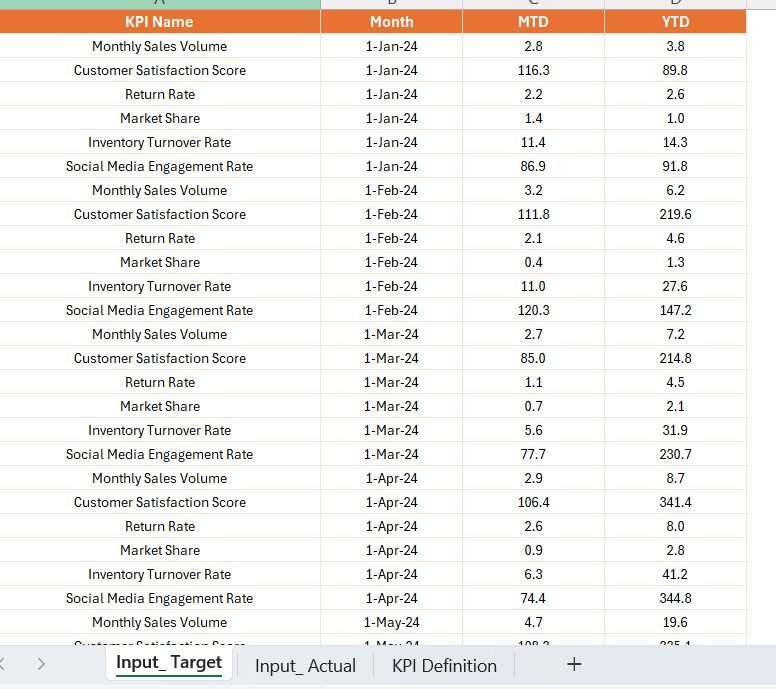
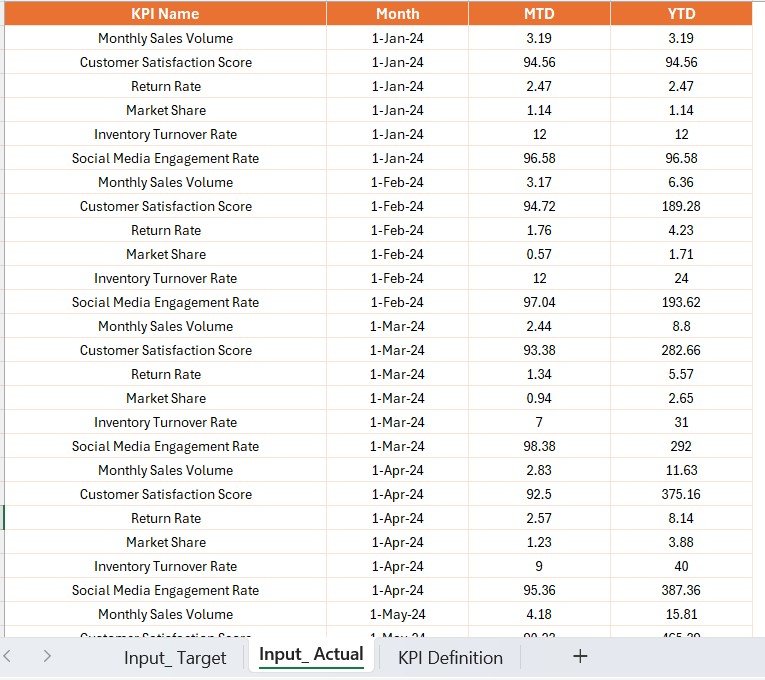
✅ Excel-Based Data Source
-
Uses three simple sheets: Input_Actual, Input_Target, and KPI_Definition
-
Only requires entering the first date of each month for accurate MTD/YTD calculations
-
No advanced BI skills required
📂 What’s Included in the Dashboard
| Page Name | Purpose |
|---|---|
| Summary | Real-time MTD & YTD performance snapshot |
| KPI Trend | KPI-specific trend analysis over 12 months |
| KPI Definition | Drill-through with KPI definitions and formulas |
🛠 How to Use the Dashboard
Step 1: Fill in the Excel sheets (Actual, Target, KPI_Definition)
Step 2: Open Power BI Desktop → Click Refresh
Step 3: Filter by Month or KPI Group in the Summary Page
Step 4: Right-click a KPI and Drill Through for definitions if needed
Step 5: Review the Trend Page to analyze where engagement is improving or declining
🎯 Who Can Benefit
🏟 Sports Clubs & Leagues – Track campaigns, attendance and digital interactions
🎤 Event Organizers – Measure fan engagement before, during and after events
📱 Marketing Teams – Assess social media and content performance instantly
🎧 Entertainment Brands – Monitor audience feedback and interactions in real time
🚀 Why You Need This Dashboard
-
Real-Time Visibility over MTD & YTD engagement
-
Improved Campaign Planning with trend insights
-
Target vs Actual vs Previous Year comparison
-
Interactive Filters & Drill-Through for deep dives
-
Easy Data Input via Excel (No technical setup)
-
Fully customizable Power BI file


Reviews
There are no reviews yet.