


In today’s fast-evolving digital landscape, protecting environmental and sustainability data against cyber threats is more crucial than ever. That’s why we created the Environmental and Sustainability Cybersecurity KPI Dashboard in Excel — your all-in-one Excel-based solution to track, measure, and analyze cybersecurity performance tailored for sustainability-focused organizations. 🌍📊
Whether you’re monitoring threat mitigation efficiency or response time to incidents, this powerful KPI dashboard helps you stay in control — all within the simplicity of Excel. Let’s explore what makes this dashboard an essential tool for your cybersecurity team.
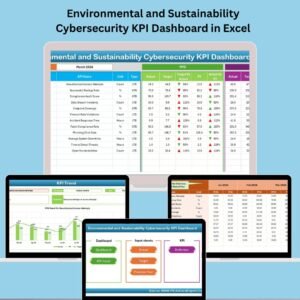
🛠️ Key Features of Environmental and Sustainability Cybersecurity KPI Dashboard
🏠 Home Sheet – Easy Navigation

-
📍 Interactive buttons to instantly jump to:
-
Dashboard
-
KPI Trend
-
Actual Numbers
-
Target Data
-
Previous Year Data
-
KPI Definition
-
-
🔄 Organized structure ensures smooth user experience
📊 Dashboard Sheet – Real-Time Insights
-
📅 Select Month from dropdown (cell D3)
-
📈 View KPI data for MTD (Month-To-Date) & YTD (Year-To-Date)
-
📉 Compare Actual vs. Target and Actual vs. Previous Year
-
📌 Up/Down Arrows with conditional formatting for visual performance feedback
-
All charts and values auto-update based on the selected month
📈 KPI Trend Sheet – Analyze KPI Trends Over Time
-
🔽 Select KPI from dropdown (C3)
-
📌 View complete details: KPI Group, Unit, Type (LTB or UTB), Formula, and Definition
-
📊 MTD and YTD trend charts show Actual, Target, and Previous Year for better forecasting
✍️ Actual Numbers Input Sheet
-
📅 Set base month (E1), then enter monthly actuals for each KPI
-
🧮 Input fields for both MTD and YTD metrics
-
📌 Easy-to-update structure for regular data tracking
🎯 Target Sheet
-
Input MTD and YTD targets per KPI
-
Structured month-by-month columns
-
Serves as benchmark data to assess performance
📆 Previous Year Number Sheet
-
Enter past year’s KPI values
-
Provides context for year-over-year analysis
-
Mirrors the format of current year’s actuals for accurate comparison
📘 KPI Definition Sheet
-
Define each KPI clearly with these fields:
-
KPI Name
-
KPI Group
-
Unit
-
Formula
-
Type (LTB/UTB)
-
Full KPI Definition
-
-
Ensures transparency and documentation of performance measures
📂 What’s Inside the Dashboard File?
-
✅ 7 Interactive Worksheets
-
✅ Month selector to view dynamic results
-
✅ Auto-calculating performance comparisons
-
✅ MTD and YTD trend visualization
-
✅ Easy data input for Actuals, Targets, and PY
-
✅ Conditional formatting for instant status view
-
✅ Editable KPI Definition table
-
✅ Built-in documentation and structure
Whether you’re reporting to senior management or refining internal strategies, this dashboard is your go-to cybersecurity KPI solution for sustainability-focused organizations.
🧑💻 How to Use the Cybersecurity KPI Dashboard in Excel
-
🧾 Open the Home Sheet and navigate using the buttons
-
📥 Go to Actual Numbers Input and enter monthly MTD/YTD data
-
🎯 Update Target Sheet with monthly goals per KPI
-
📆 Fill in Previous Year Numbers for baseline comparison
-
📊 Head to the Dashboard and select the month for dynamic insights
-
📈 Use the KPI Trend Sheet to analyze performance over time
-
📘 Maintain your KPI Definition sheet for clarity and team alignment
No complex setup. Just open Excel, enter your numbers, and gain insights instantly!
🎯 Who Can Benefit from This Dashboard?
-
🛡️ Cybersecurity Teams – Monitor threat resolution, incident response, and control failures
-
🌱 Sustainability Managers – Secure your environmental data systems
-
🏢 Compliance Officers – Ensure KPIs are aligned with regulatory standards
-
📈 Data Analysts – Get visual insights and export-ready reports
-
🌍 Green-Tech Startups & Enterprises – Merge sustainability and security reporting
-
🧑💼 Executive Leadership – Get a snapshot of cybersecurity posture at a glance
Whether you’re tracking 10 KPIs or 50 — this dashboard is scalable, accurate, and highly customizable.
🔗 Click here to read the Detailed blog post
🔗 Visit our YouTube channel to learn step-by-step video tutorials


Reviews
There are no reviews yet.