
In today’s competitive world, engineering teams are under constant pressure to deliver projects on time, cut costs, and maximize efficiency. Managing performance through manual reports or scattered spreadsheets often leads to mistakes, delays, and missed opportunities.
✨ That’s why the Engineering KPI Dashboard in Excel is a game-changer. Built with Excel’s advanced features like pivot tables, slicers, charts, and conditional formatting, this ready-to-use template empowers organizations to track, analyze, and visualize engineering performance in one place. It transforms raw data into meaningful insights, helping leaders and managers make smarter, data-driven decisions.
✅ Key Features of the Engineering KPI Dashboard
-
📊 Centralized Performance Tracking – Consolidates all KPIs into a single dashboard.
-
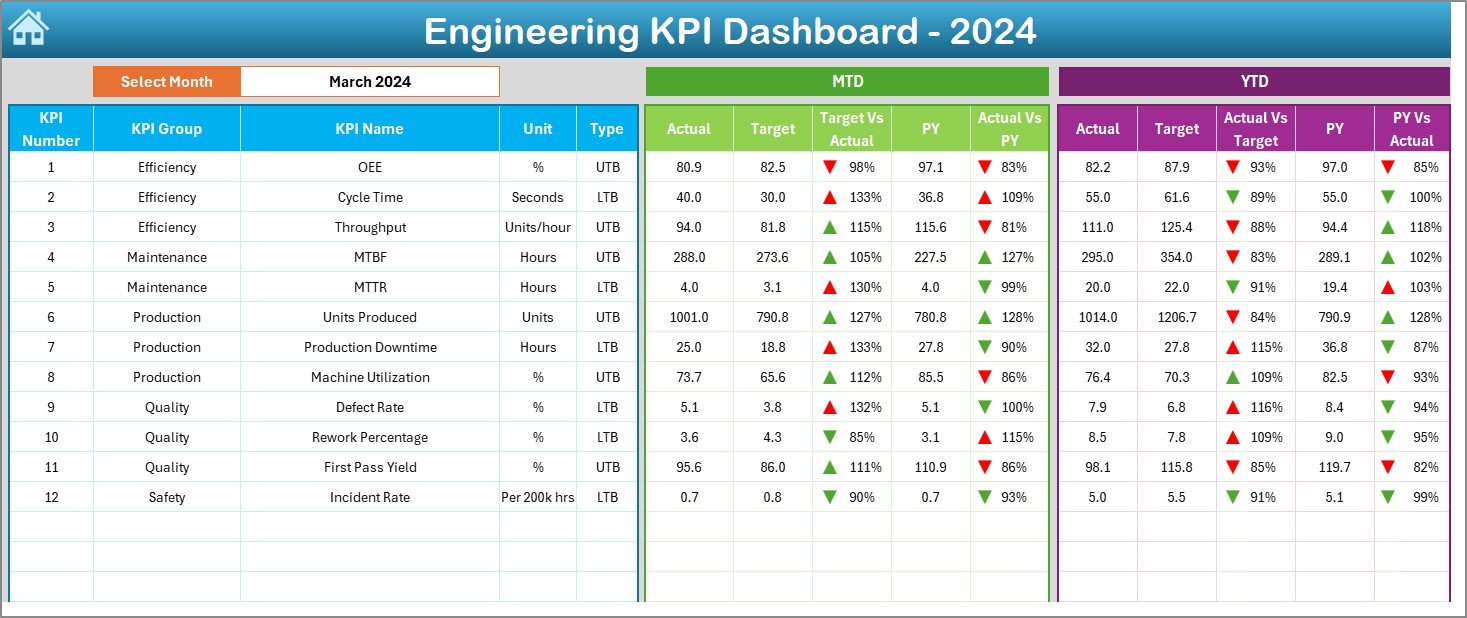
🎯 MTD & YTD Comparisons – View Month-to-Date and Year-to-Date performance instantly.
-
📈 Trend Analysis – Interactive charts reveal patterns over time.
-
🟢 Conditional Formatting – Red/green arrows highlight gaps vs. targets.
-
🗂 Structured Data Sheets – Includes Actual, Target, Previous Year, and KPI Definition tabs.
-
🕒 Time-Saving Automation – Prebuilt formulas eliminate manual calculations.
-
🛠 Fully Customizable – Add, edit, or remove KPIs to suit your needs.
-
💡 Cost-Effective – A professional alternative to expensive BI tools.
📂 What’s Inside the Engineering KPI Dashboard
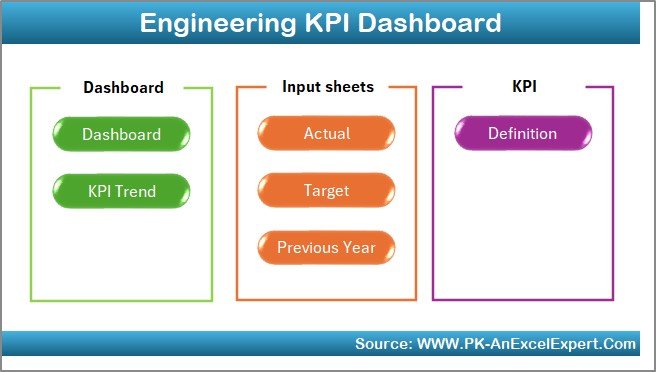
This template comes with seven interactive worksheets, each with a specific purpose:
-
🏠 Home Sheet – Index page with six quick navigation buttons.
-
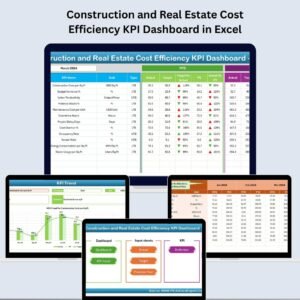
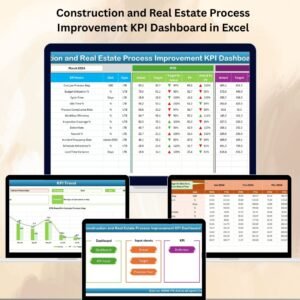
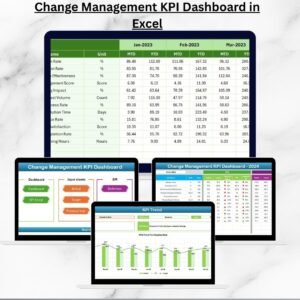
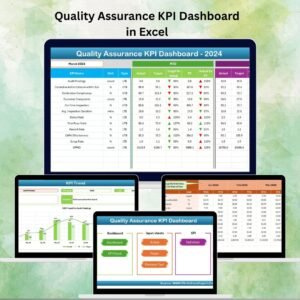
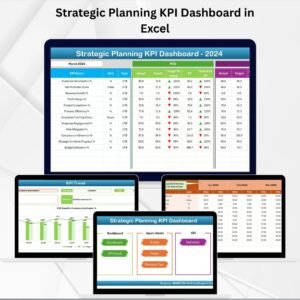
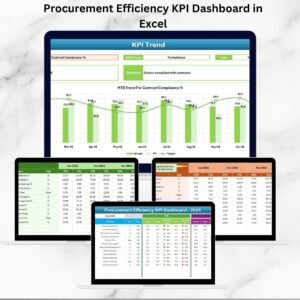
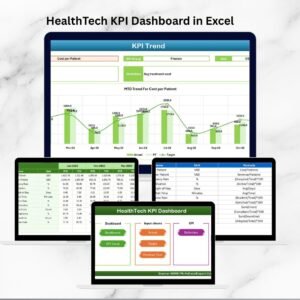
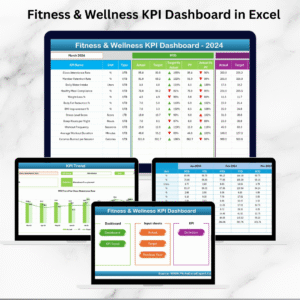
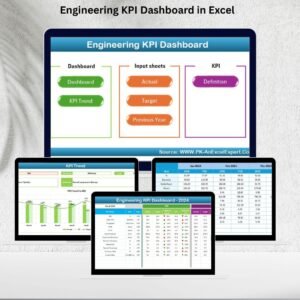
📊 Dashboard Tab – Main analytical page showing MTD/YTD Actuals, Targets, Previous Year values, and variance analysis.
-
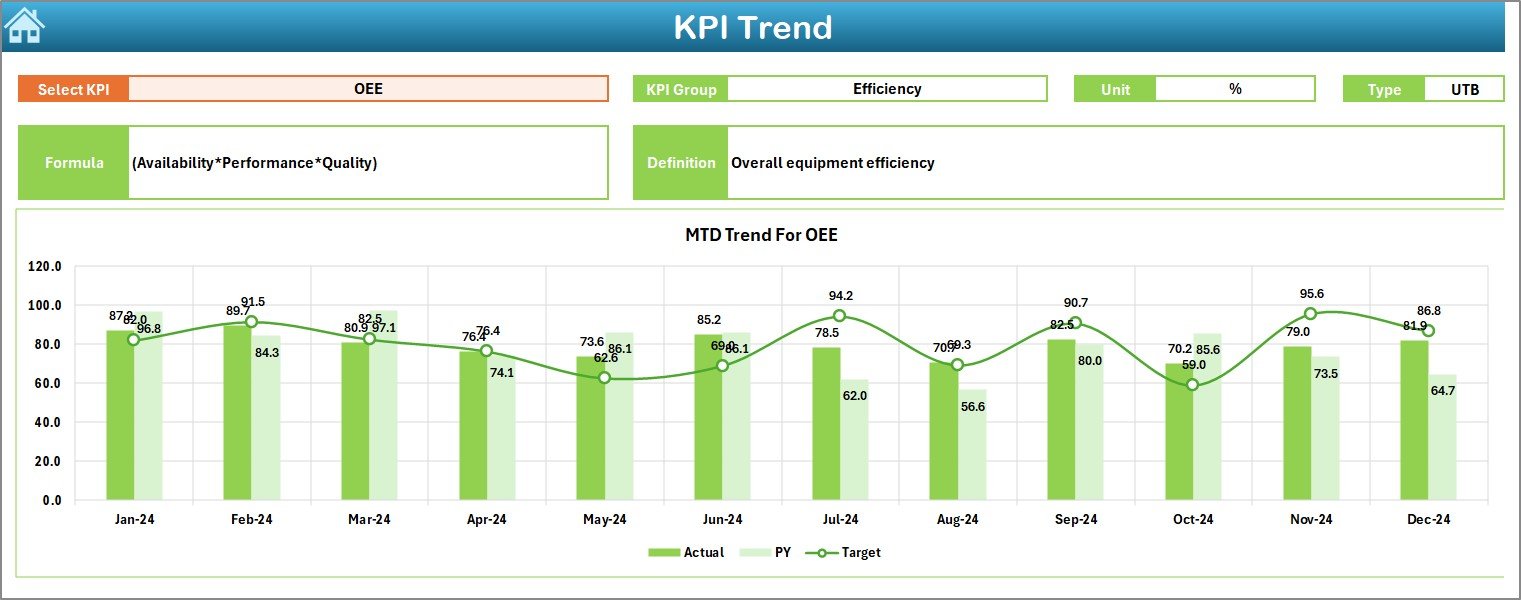
📈 KPI Trend Sheet – Drop-down selection to explore trends of individual KPIs with charts and definitions.
-
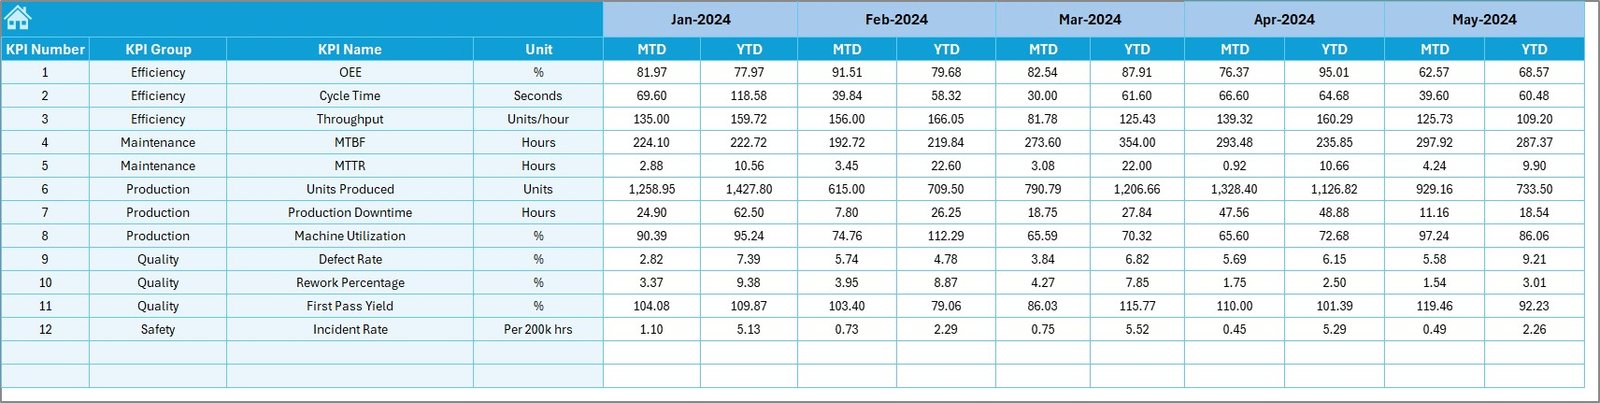
✍ Actual Numbers Input – Record monthly MTD & YTD performance data.
-
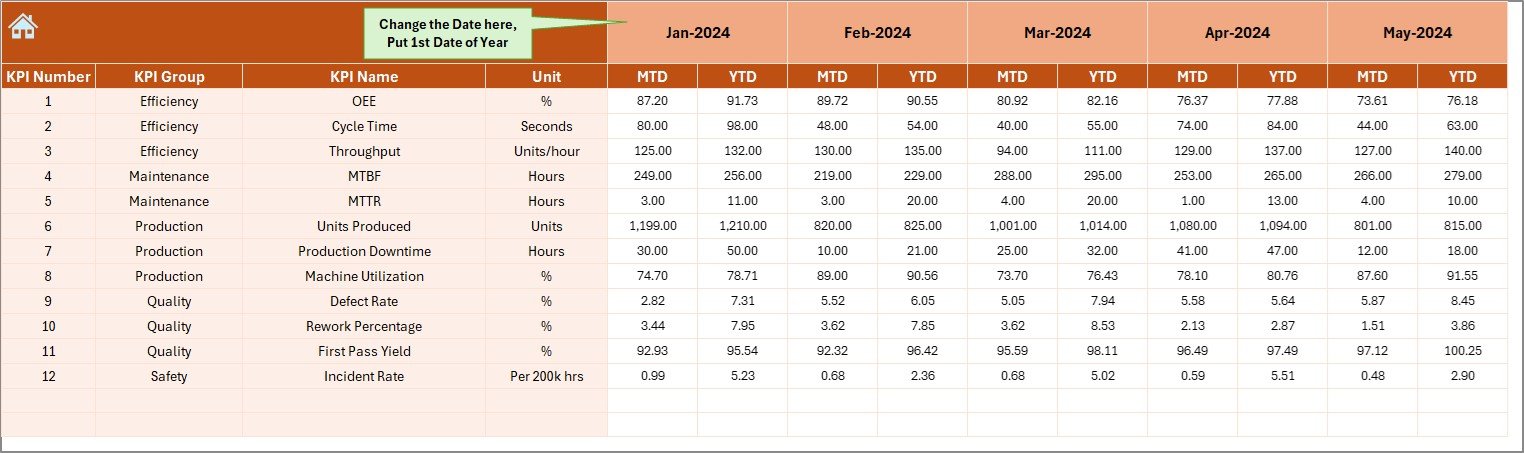
🎯 Target Sheet – Store monthly and yearly KPI targets.
-
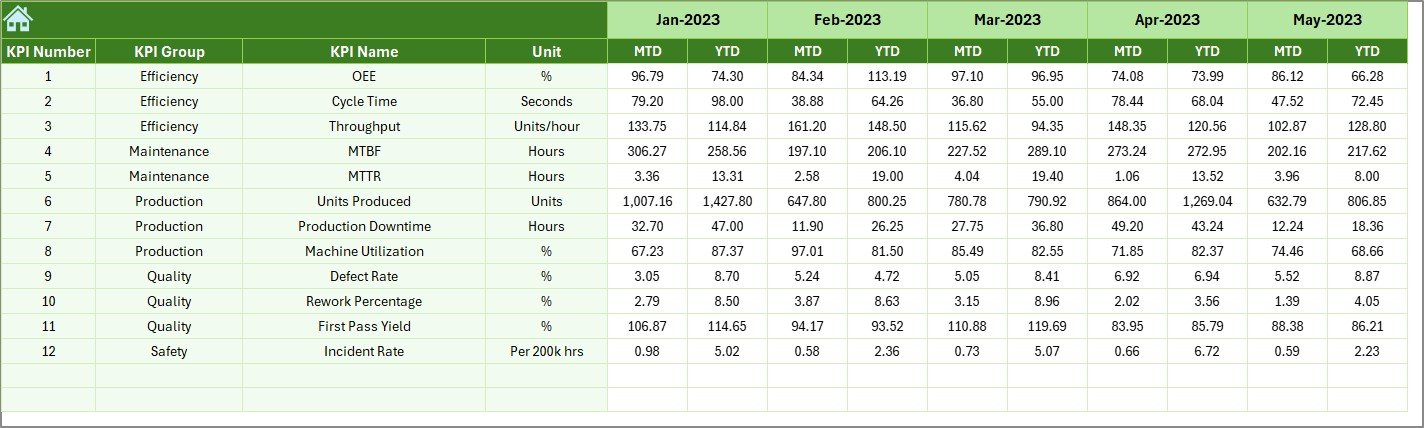
📅 Previous Year Numbers – Compare historical data for year-on-year benchmarking.
-
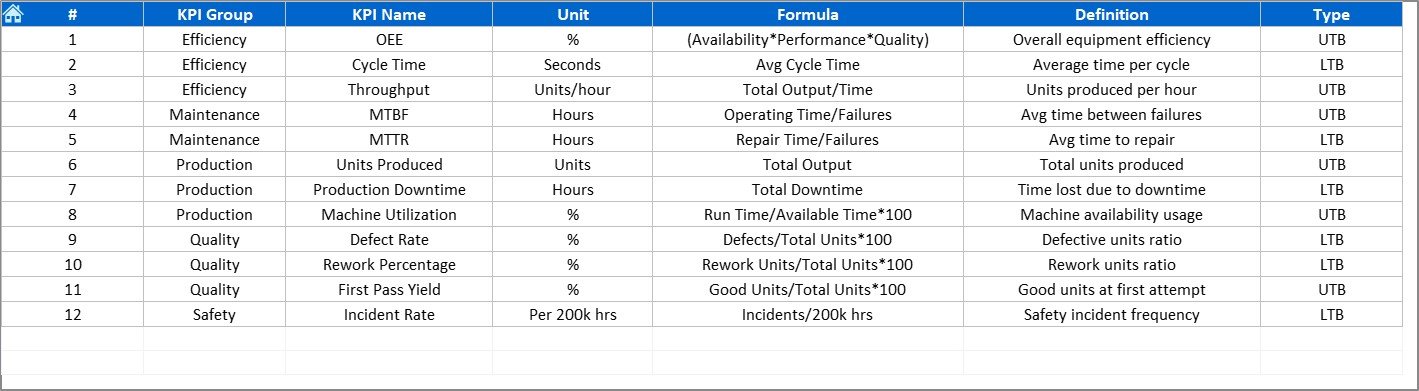
📖 KPI Definition Sheet – Knowledge base with KPI names, units, formulas, and definitions.
🚀 How to Use the Engineering KPI Dashboard
-
Define KPIs – Use the KPI Definition sheet to set up your metrics.
-
Enter Targets – Add monthly and yearly targets in the Target Sheet.
-
Input Previous Year Data – Record last year’s numbers for benchmarking.
-
Update Actuals – Enter monthly performance data in the Actual Numbers sheet.
-
Review Dashboard – Analyze results in the Dashboard tab with variance arrows.
-
Track Trends – Use the KPI Trend sheet to identify patterns and improvement areas.
💡 No advanced Excel skills required—basic knowledge is enough to operate this dashboard smoothly.
👥 Who Can Benefit from This Dashboard?
-
🏭 Manufacturing Plants – Track production efficiency, machine downtime, and defect rates.
-
🏗 Construction Companies – Monitor project timelines, resource usage, and cost variances.
-
⚙ Product Development Teams – Measure cycle times, innovation rates, and engineering changes.
-
🔌 Energy & Utilities – Track safety metrics, equipment utilization, and operational costs.
-
🚗 Automotive Industry – Monitor defects, supply chain issues, and warranty claims.
-
📊 Small & Medium Enterprises – A cost-friendly solution without investing in BI software.
📖 Click here to read the Detailed blog post
Visit our YouTube channel to learn step-by-step video tutorials 👉 PKAnExcelExpert YouTube Channel
Watch the step-by-step video tutorial:


Reviews
There are no reviews yet.