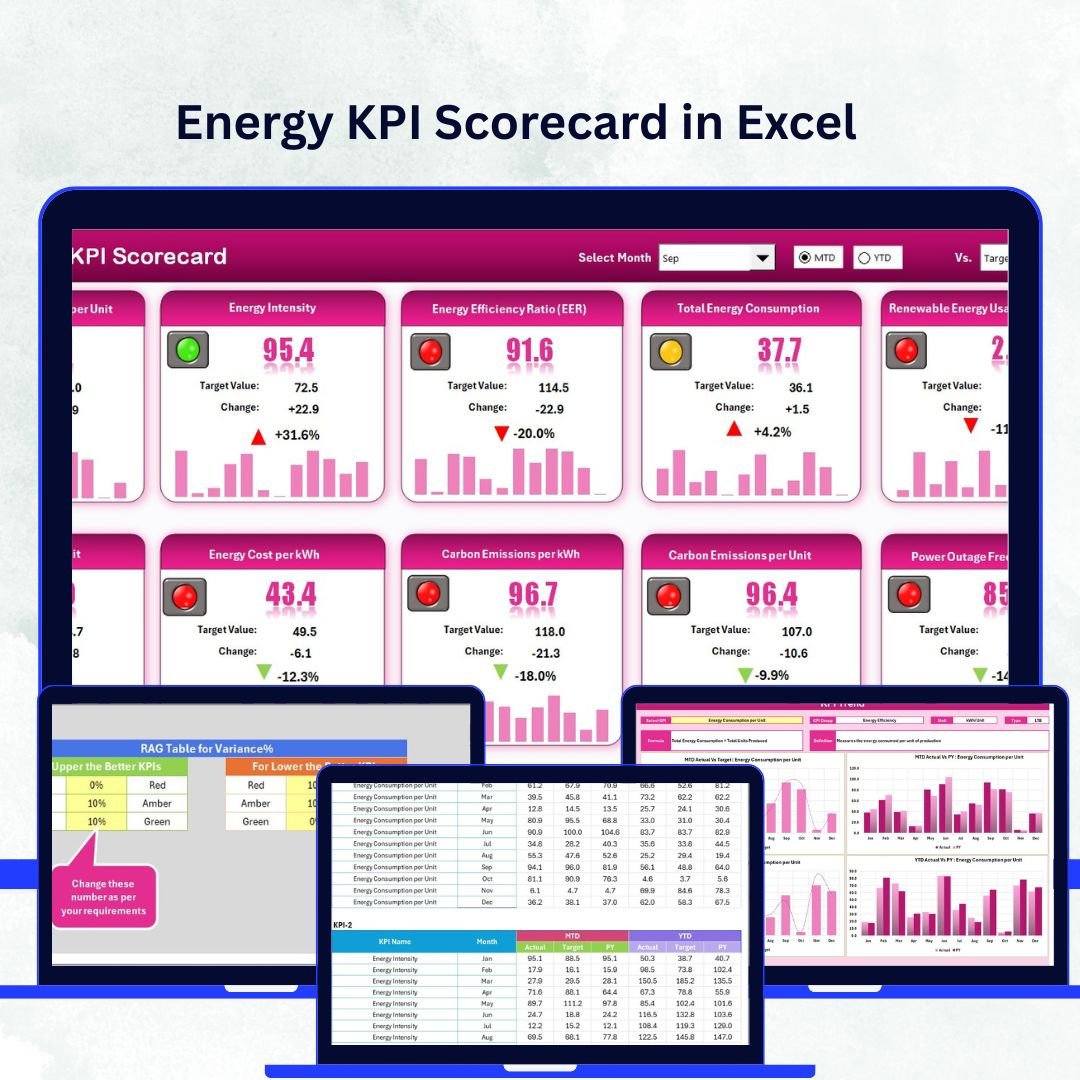
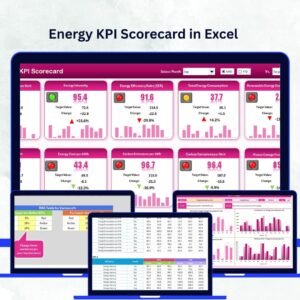
Managing energy efficiently is essential for every modern organization striving toward sustainability and cost control. 🌍 The Energy KPI Scorecard in Excel is a powerful, ready-to-use solution that enables you to monitor energy consumption, efficiency, cost, and emissions in one interactive dashboard.
Built entirely in Microsoft Excel, this scorecard helps businesses—from manufacturing and utilities to real estate and service sectors—measure progress against goals, identify inefficiencies, and take data-driven action. With its clear visuals and structured data flow, it simplifies performance tracking for energy managers, sustainability officers, and operations teams alike.
⚙️ Key Features of Energy KPI Scorecard in Excel
⚡ Centralized Energy Monitoring: Track energy usage, cost, and emissions in one file.
📈 Actual vs Target Comparison: Evaluate how close your performance is to defined energy goals.
🎯 MTD & YTD Analysis: Measure both monthly and year-to-date energy performance.
🎨 Color-Coded Visuals: Instantly recognize KPI status using green (good), yellow (average), and red (needs attention).
📊 Dynamic Trend Charts: Analyze performance trends and identify seasonal or operational shifts.
🧮 Automated Calculations: Built-in Excel formulas ensure instant updates across all sheets.
💡 Customizable KPIs: Add, edit, or redefine energy metrics as per your organization’s goals.
💻 No Extra Software Needed: 100% Excel-based—no add-ins, macros, or subscriptions.
📦 What’s Inside the Energy KPI Scorecard
This Excel template is designed with four fully linked worksheets, making energy performance tracking simple and organized:
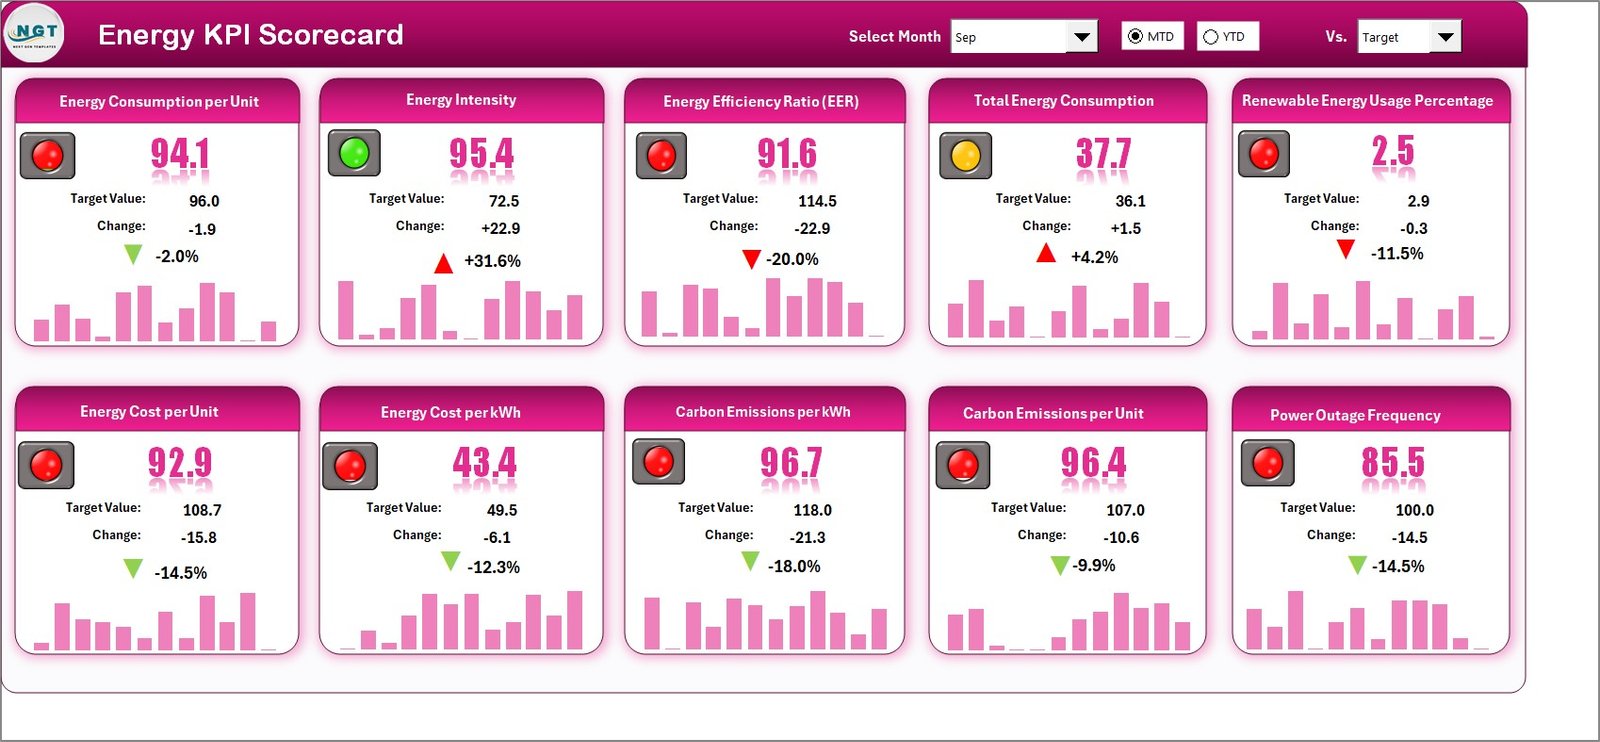
1️⃣ Scorecard Sheet – Performance Dashboard
-
Displays MTD and YTD summaries for all KPIs.
-
Dropdown selectors let you choose any month for analysis.
-
Compares Actual, Target, and Previous Year data with automatic color indicators.
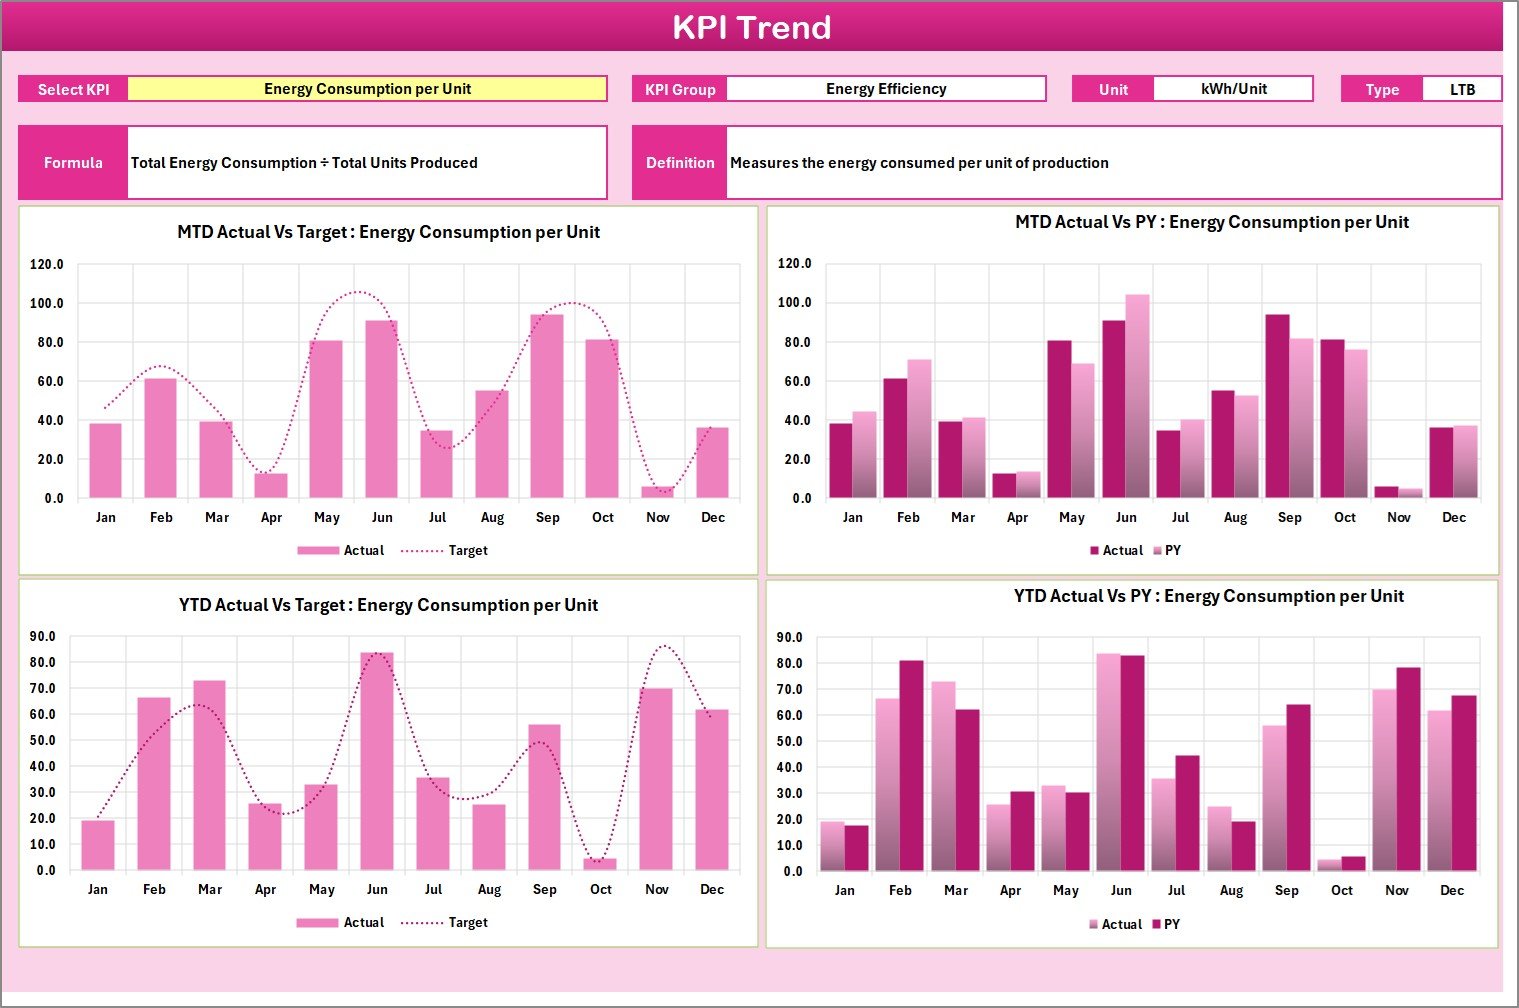
2️⃣ KPI Trend Sheet – Historical Analysis
-
Select a KPI (via dropdown in cell C3) to visualize its trend.
-
Displays Actual, Target, and Previous Year charts for deeper insight.
-
Helps identify inefficiencies and track improvement over time.
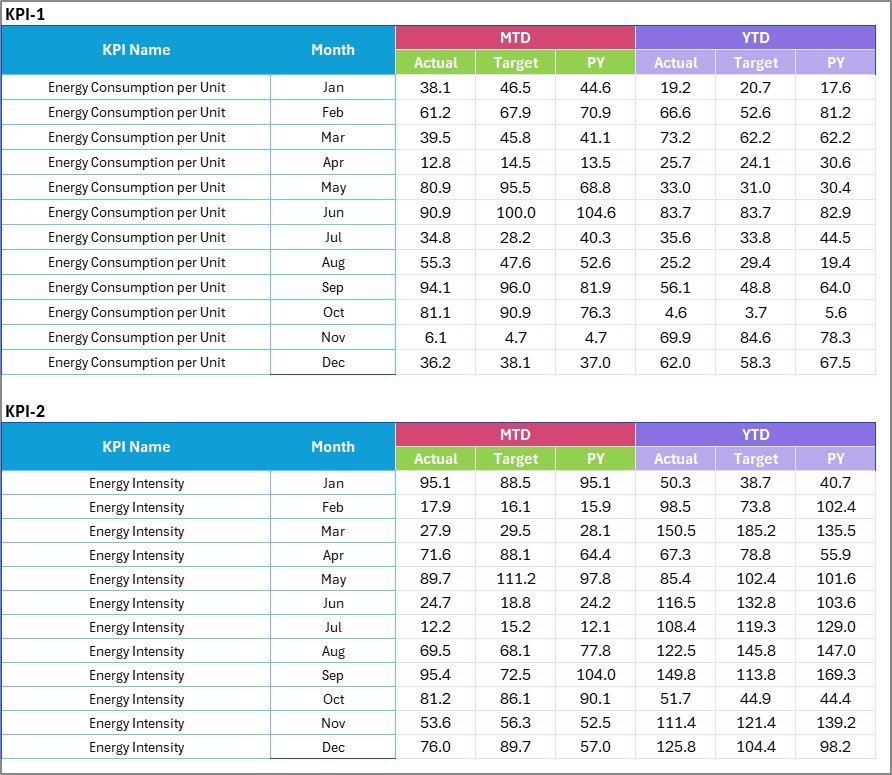
3️⃣ Input Data Sheet – Data Management Hub
-
Enter Actual, Target, and Previous Year figures for each KPI and month.
-
Updates automatically across charts and dashboards.
-
Ensures accurate, consistent data entry.
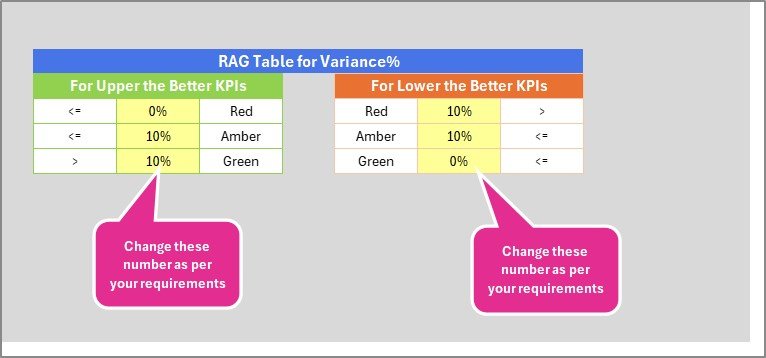
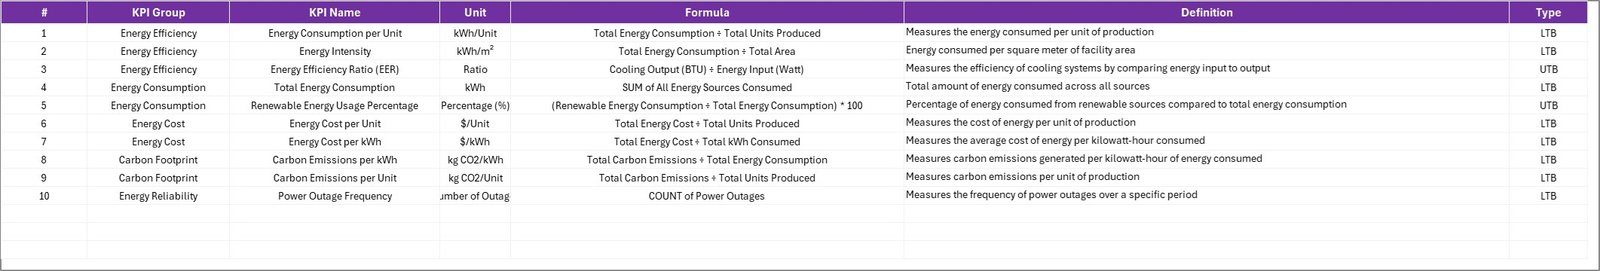
4️⃣ KPI Definition Sheet – KPI Reference Library
-
Lists KPI Name, Group, Unit, Formula, and Definition.
-
Clarifies which KPIs are Lower the Better (LTB) or Upper the Better (UTB).
-
Ensures all stakeholders interpret metrics the same way.
Each sheet is seamlessly connected, creating a comprehensive system for energy tracking and decision-making.
🧭 How to Use the Energy KPI Scorecard
🪄 Step 1: Define all KPIs in the KPI Definition sheet.
📊 Step 2: Input monthly Actual, Target, and Previous Year data in the Input Data sheet.
📈 Step 3: Open the KPI Trend sheet to visualize patterns and trends.
🎯 Step 4: View summaries and comparisons on the Scorecard sheet.
📅 Step 5: Update data monthly to maintain accuracy and generate consistent reports.
With its automated structure and visual indicators, the scorecard turns raw data into actionable insights within minutes. 🚀
👥 Who Can Benefit from This Energy KPI Scorecard
🏭 Manufacturing Plants: Track equipment efficiency and energy waste.
🏢 Facility Managers: Monitor building energy use, HVAC performance, and savings.
⚡ Utilities & Energy Providers: Evaluate generation, distribution, and transmission efficiency.
💰 Finance Teams: Analyze energy cost trends and identify savings opportunities.
🌿 Sustainability Managers: Monitor carbon footprint and renewable energy usage.
📈 Executives: Review energy performance KPIs for strategic decisions.
Whether for a single site or multiple locations, this scorecard brings visibility, consistency, and measurable progress to your energy management goals.


Reviews
There are no reviews yet.