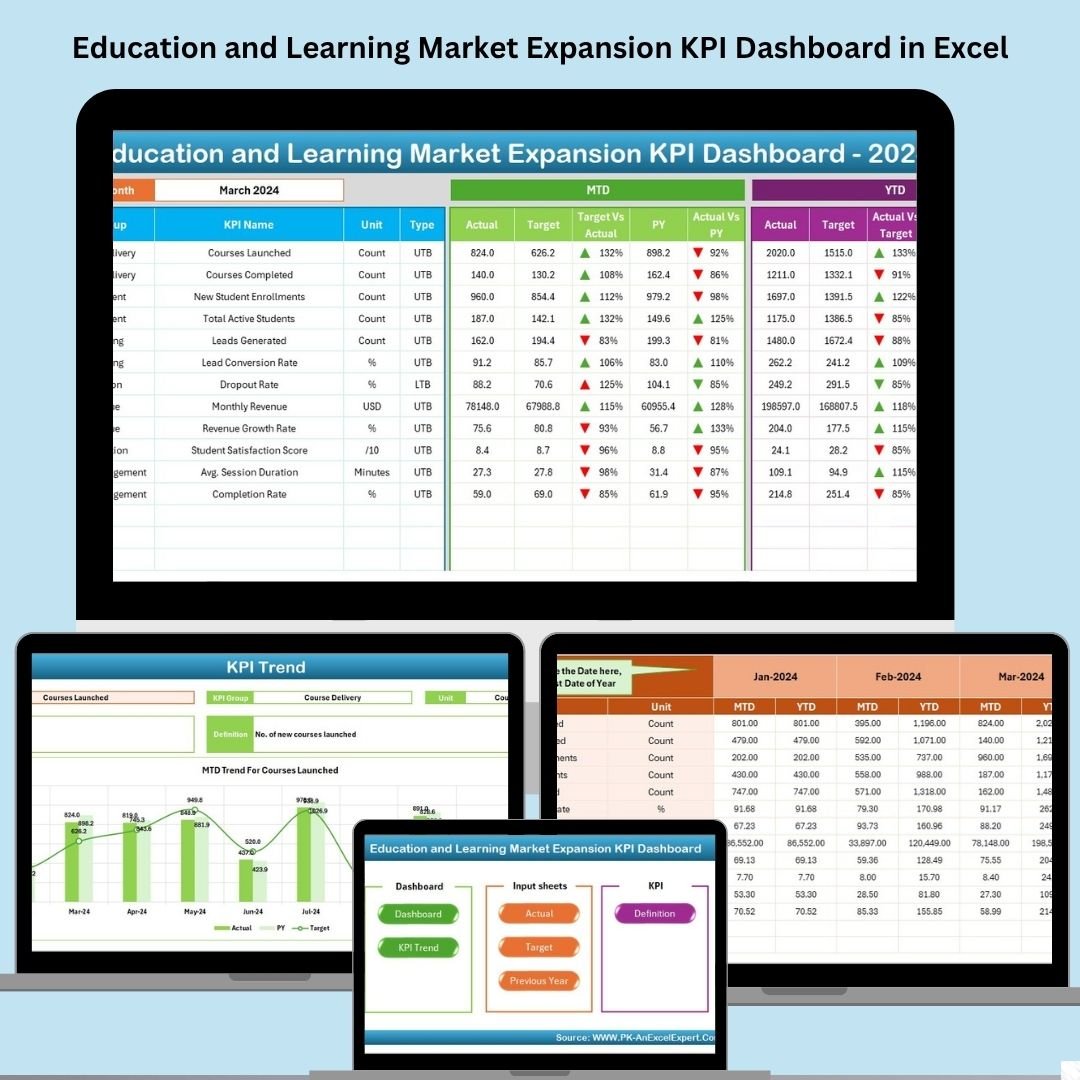
Expanding your education business? Don’t guess—track it! The Education and Learning Market Expansion KPI Dashboard in Excel is the smart solution for administrators, online coaches, training centers, and educational institutions looking to monitor progress, growth, and performance—all in one interactive and easy-to-use Excel file.
With this template, you can visualize Month-to-Date (MTD), Year-to-Date (YTD), and Previous Year performance across key KPIs, measure target achievement, and gain strategic insights to improve and grow your programs. No subscriptions, no complex software—just Excel and powerful decision-making at your fingertips.
✨ Key Features of Education & Learning KPI Dashboard
🏠 Home Sheet with Quick Navigation
Jump instantly to any sheet with one click—like a control panel for your dashboard.
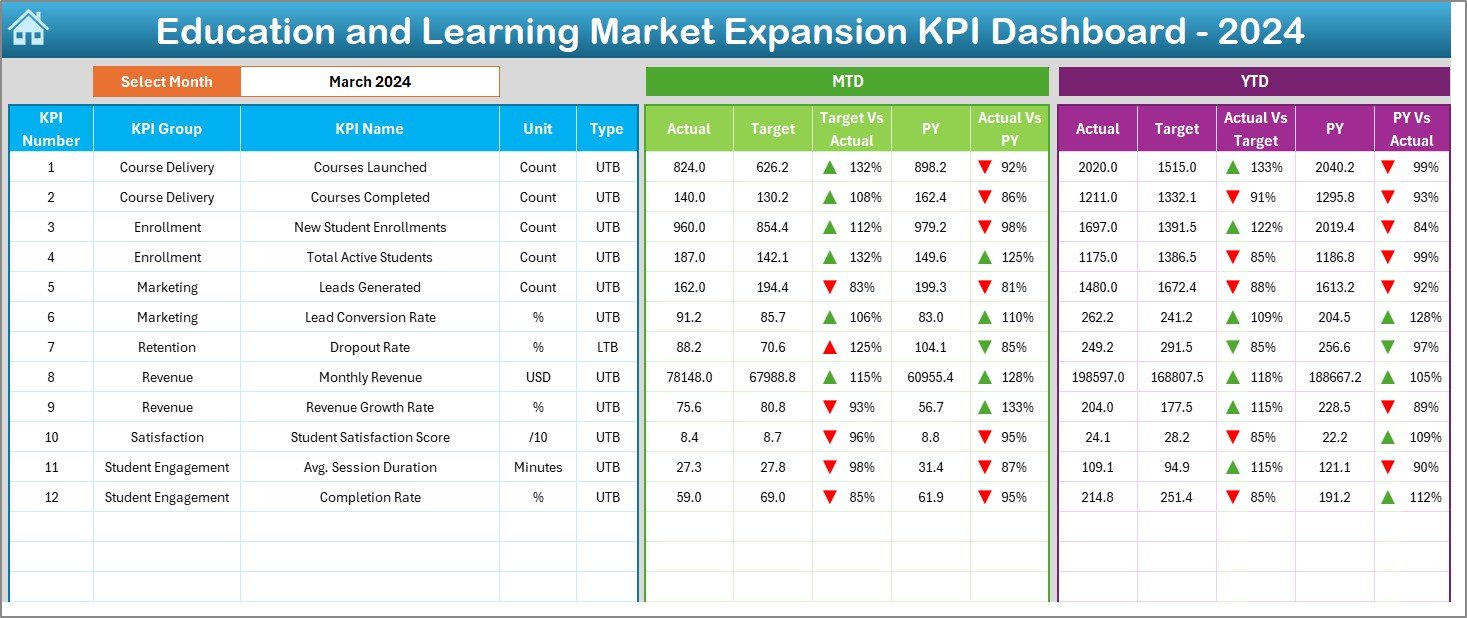
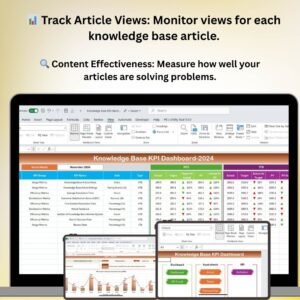
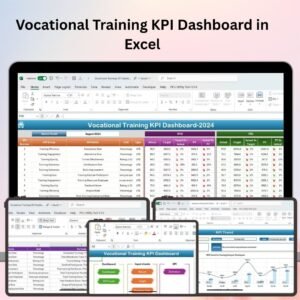
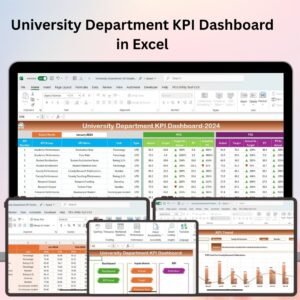
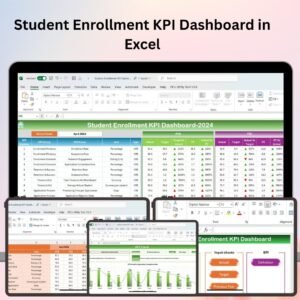
📊 Real-Time Dashboard View
Get instant visual updates for MTD, YTD, and Previous Year performance with conditional arrows and color-coded formatting.
🔄 Month Selector for Dynamic Filtering
Choose any month from a dropdown and see the entire dashboard update automatically.
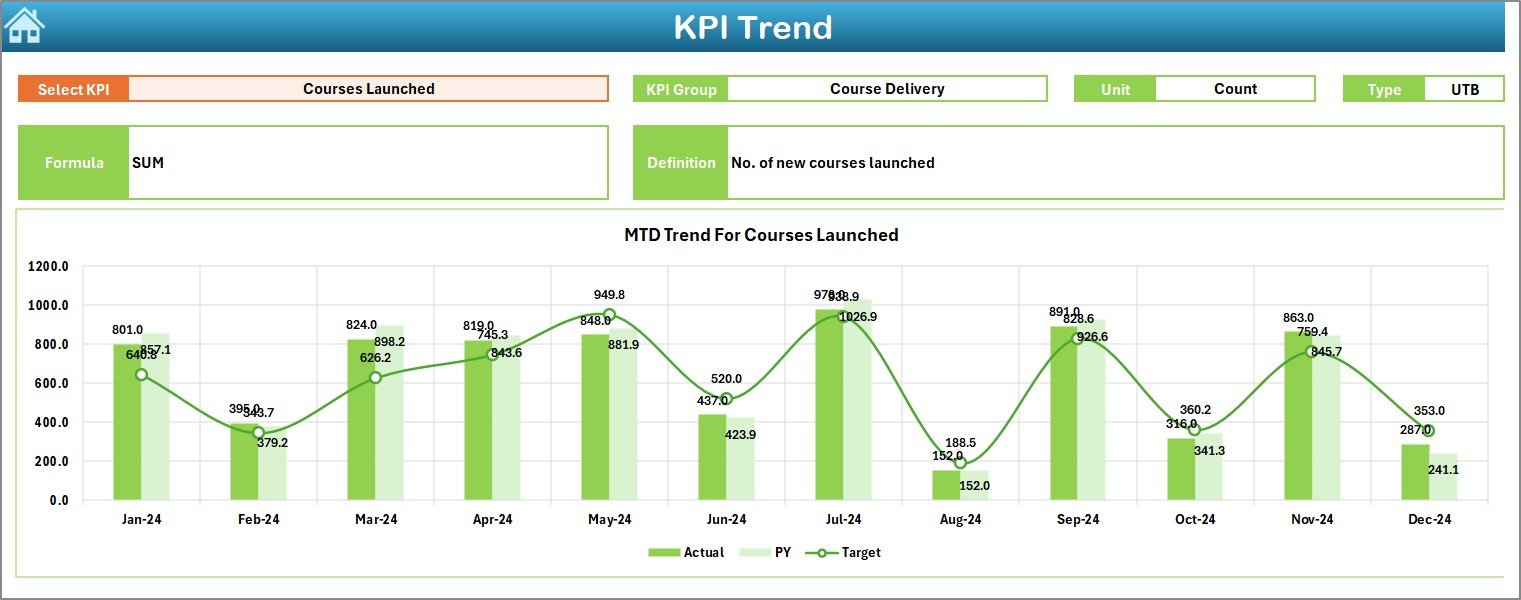
📈 KPI Trend Sheet
Track individual KPI trends over time with deep insights into KPI type, formula, and definitions.
🧾 Actual, Target, and Previous Year Input Sheets
Update three separate sheets with monthly data to power the dashboard with accurate, historical, and target-based numbers.
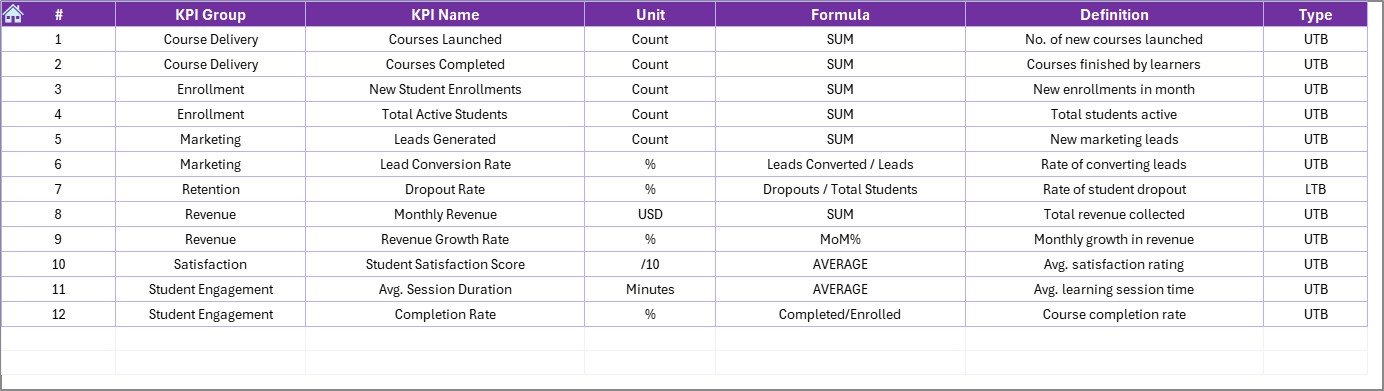
📘 KPI Definition Sheet
Stay aligned with a structured reference of each KPI, including name, unit, type (UTB/LTB), and formula.
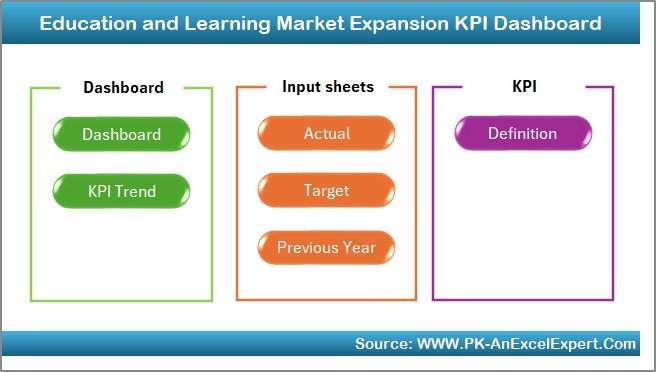
📂 What’s Inside the Dashboard Template
🟢 1. Home Sheet
An intuitive entry point with 6 clickable buttons to navigate to any part of the file.
🟢 2. Dashboard Sheet
The visual heart of the template: see actual vs target performance with up/down arrows for instant clarity.
🟢 3. KPI Trend Sheet
Analyze selected KPI trends across months and identify areas needing attention.
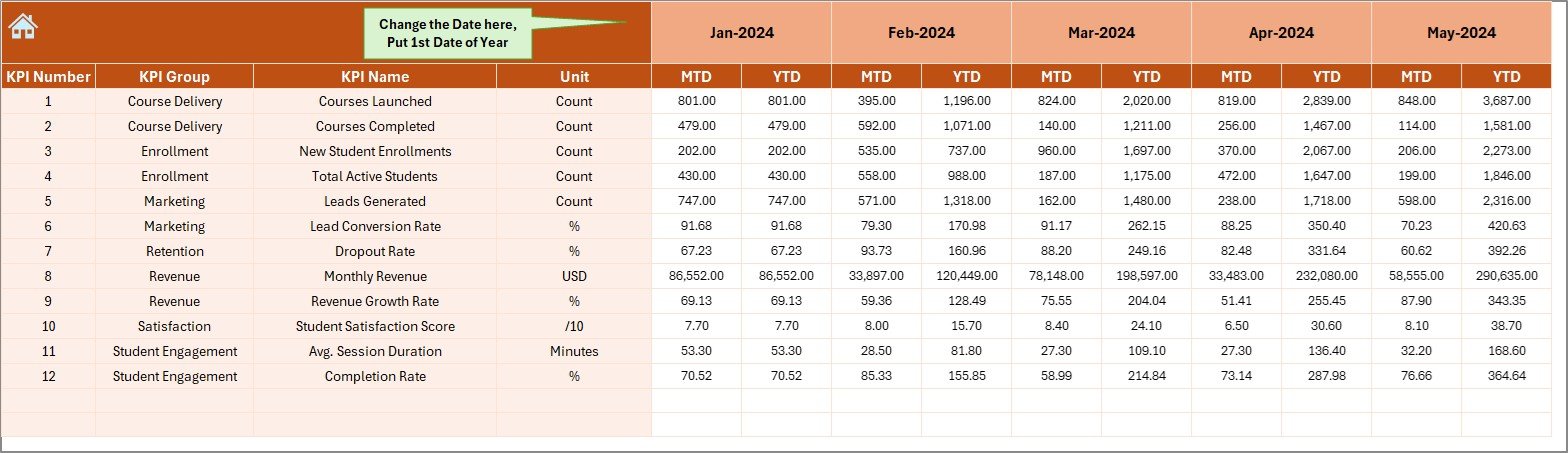
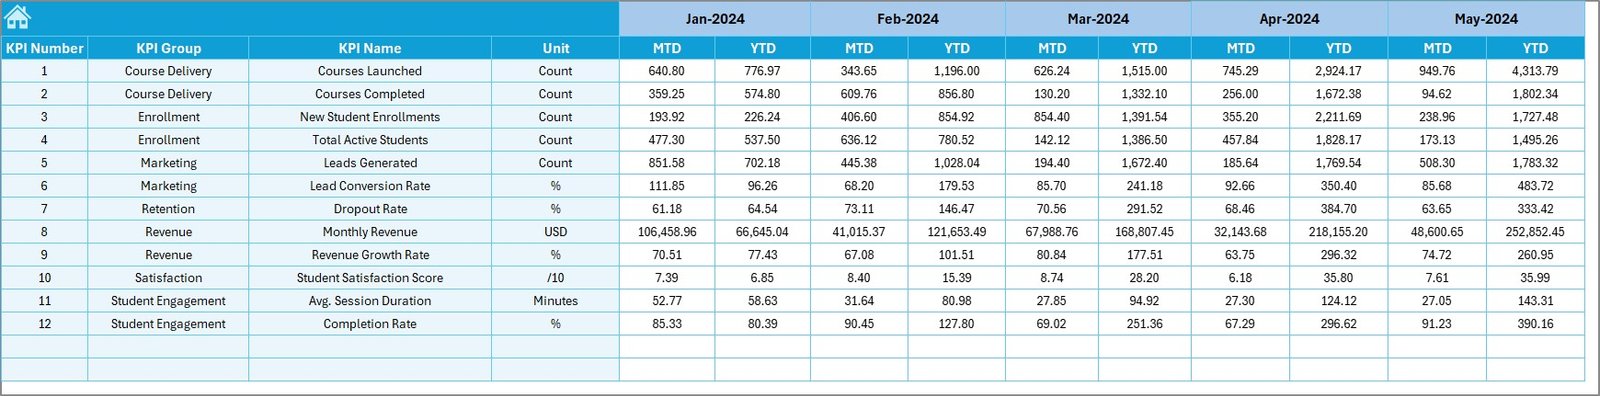
🟢 4. Actual Numbers Input Sheet
Enter monthly actual performance data here—it powers the charts and metrics.
🟢 5. Target Sheet
Define clear monthly goals for each KPI—your benchmarks for success.
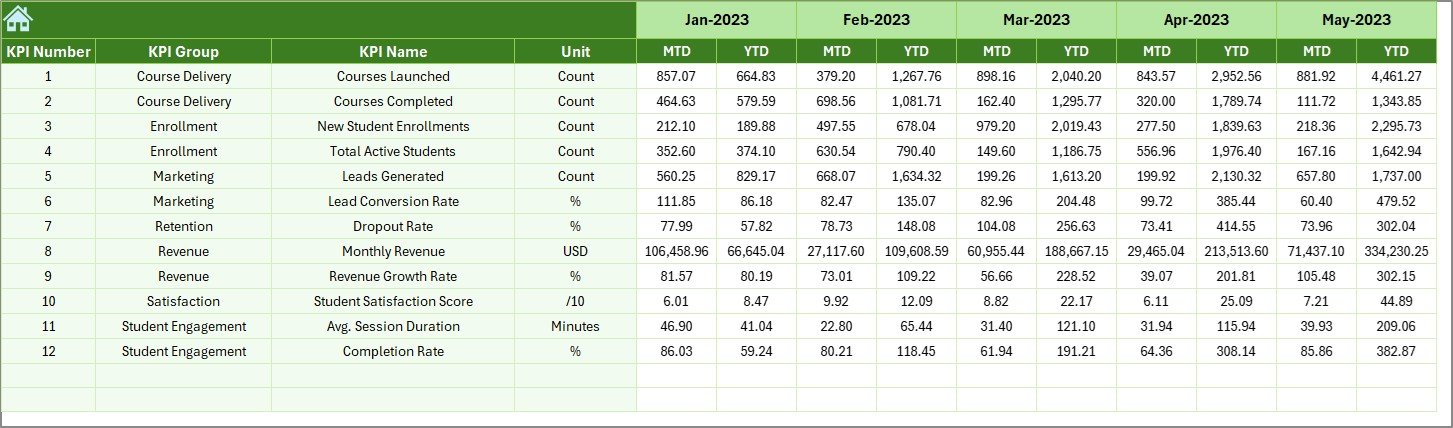
🟢 6. Previous Year Data Sheet
Compare this year’s performance to last year’s to spot improvements or declines.
🟢 7. KPI Definition Sheet
Use this tab to understand, explain, and document each KPI.
🛠️ How to Use the Dashboard
👉 Step 1: Enter the First Month of Your Financial Year
Cell E1 in the Actual Numbers Input Sheet sets the timeline.
👉 Step 2: Add Actual Values
Fill in your actual performance data by month in the Actual Numbers Input Sheet.
👉 Step 3: Define Targets
Use the Target Sheet to input your MTD and YTD targets for every KPI.
👉 Step 4: Add Last Year’s Numbers
Use the Previous Year Sheet to input historical values and enable growth comparisons.
👉 Step 5: Select Month on Dashboard
Pick the desired month on the Dashboard sheet (cell D3) and watch the metrics update automatically.
👨🏫 Who Can Benefit from This Dashboard?
🎓 School Administrators – Monitor enrollments, performance, and outreach
💡 Online Coaches – Track completion, engagement, and feedback KPIs
🏫 Tutoring Centers – Measure monthly and yearly performance with clarity
🏢 Corporate Training Teams – Optimize internal L&D programs
🚀 EdTech Startups – Visualize impact and growth metrics across locations
📚 Franchise Learning Models – Track performance across branches and regions
🔧 Customize the Dashboard Easily
✅ Add new KPIs in the KPI Definition Sheet
✅ Modify timelines (weekly/quarterly) as needed
✅ Brand it with your logo, fonts, and colors
✅ Create pivot charts for advanced visuals
✅ Adjust conditional formatting for goals and warnings
This Excel file is fully editable and scalable for your business needs.
✅ Click here to read the Detailed blog post
🔗 Visit our YouTube channel to learn step-by-step video tutorials


Reviews
There are no reviews yet.