


In the modern education landscape, financial performance is as critical as academic results. Whether you’re running a school, college, or training institute, tracking financial KPIs is essential to ensure transparency, efficiency, and long-term growth. That’s where the Education and Learning Financial Health KPI Dashboard in Excel becomes a game-changer. This dashboard gives you all the tools to assess your institution’s financial health—month-by-month and year-to-date—without relying on complicated systems or manual spreadsheets.
💼 Key Features of the Financial Health KPI Dashboard
🧾 Real-Time KPI Analysis
Get a complete view of MTD (Month-to-Date) and YTD (Year-to-Date) actuals, targets, and previous year comparisons—all from a single dashboard.
📊 Visual Insights
Smart conditional formatting, trend arrows, and dynamic charts make it easy to detect performance issues or successes instantly.
🔄 Dynamic Month Selection
Use the drop-down in cell D3 to switch between months and watch the dashboard refresh automatically.
📈 KPI Trend Sheet
Select any KPI from the dropdown and view its monthly trend compared to target and previous year. It’s perfect for identifying patterns over time.
📋 Input Sheets for Accuracy
Easily update your Actual, Target, and Previous Year data using dedicated input sheets—no Excel formulas needed.
🧩 Pre-Built KPI Definitions
Maintain standardized KPI names, units, definitions, and performance logic (UTB or LTB) for consistent tracking.
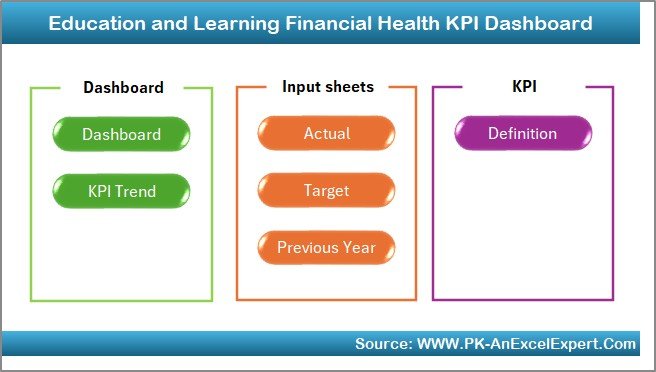
📦 What’s Inside the Dashboard?
The template includes 7 well-organized worksheets:
1️⃣ Home Sheet
Your command center—use 6 navigation buttons to access key sections instantly.
2️⃣ Dashboard Sheet
Visually compare actuals with targets and previous year metrics using KPIs, arrows, and slicers.
3️⃣ KPI Trend Sheet
Analyze one KPI at a time with a dedicated line chart and key definitions.
4️⃣ Actual Numbers Input
Update the month and enter your institution’s MTD and YTD data.
5️⃣ Target Sheet
Enter monthly goals for each KPI to benchmark performance.
6️⃣ Previous Year Numbers
Log historic data for comparative analysis.
7️⃣ KPI Definition
Define, standardize, and track each KPI’s meaning, formula, and unit clearly.
🛠️ How to Use the Product
Using this dashboard is as easy as 1-2-3:
-
Go to the Home Sheet and select your desired tab.
-
Update the Actual Numbers Input, Target Sheet, and Previous Year Sheet as needed.
-
View insights instantly on the Dashboard and KPI Trend tabs.
Repeat this monthly, and you’ll have a complete view of your financial trajectory!
👥 Who Can Benefit from This Dashboard?
💰 Finance Managers
Monitor tuition revenue, expenses, and cost-efficiency metrics in real-time.
🏫 School Administrators
Align operational performance with strategic financial goals.
💼 Grant Managers
Ensure optimal use of external funding and grants.
🧠 Policy Makers
Make better budgeting and investment decisions based on clean, structured data.
🚀 Why Choose This Dashboard?
✅ No coding or VBA required—100% formula-based
✅ Easy monthly updates using dropdowns and data input sheets
✅ Suitable for Excel 2016 and above
✅ Fully customizable with your institution’s colors, logos, or new KPIs
✅ Instant visual feedback on underperforming or overperforming metrics
🌟 Most Popular KPIs Included
-
Tuition Fee Collection Rate
-
Operational Cost per Student
-
Grant Utilization %
-
Faculty Salary to Total Expense Ratio
-
Year-on-Year Budget Variance
-
Cost Recovery Ratio
-
Cash Flow per Student
-
Monthly Revenue Growth
-
Expenditure per Program
-
Debt to Income Ratio
Each KPI is clearly tagged as UTB (Upper the Better) or LTB (Lower the Better) so you know what to optimize.


Reviews
There are no reviews yet.