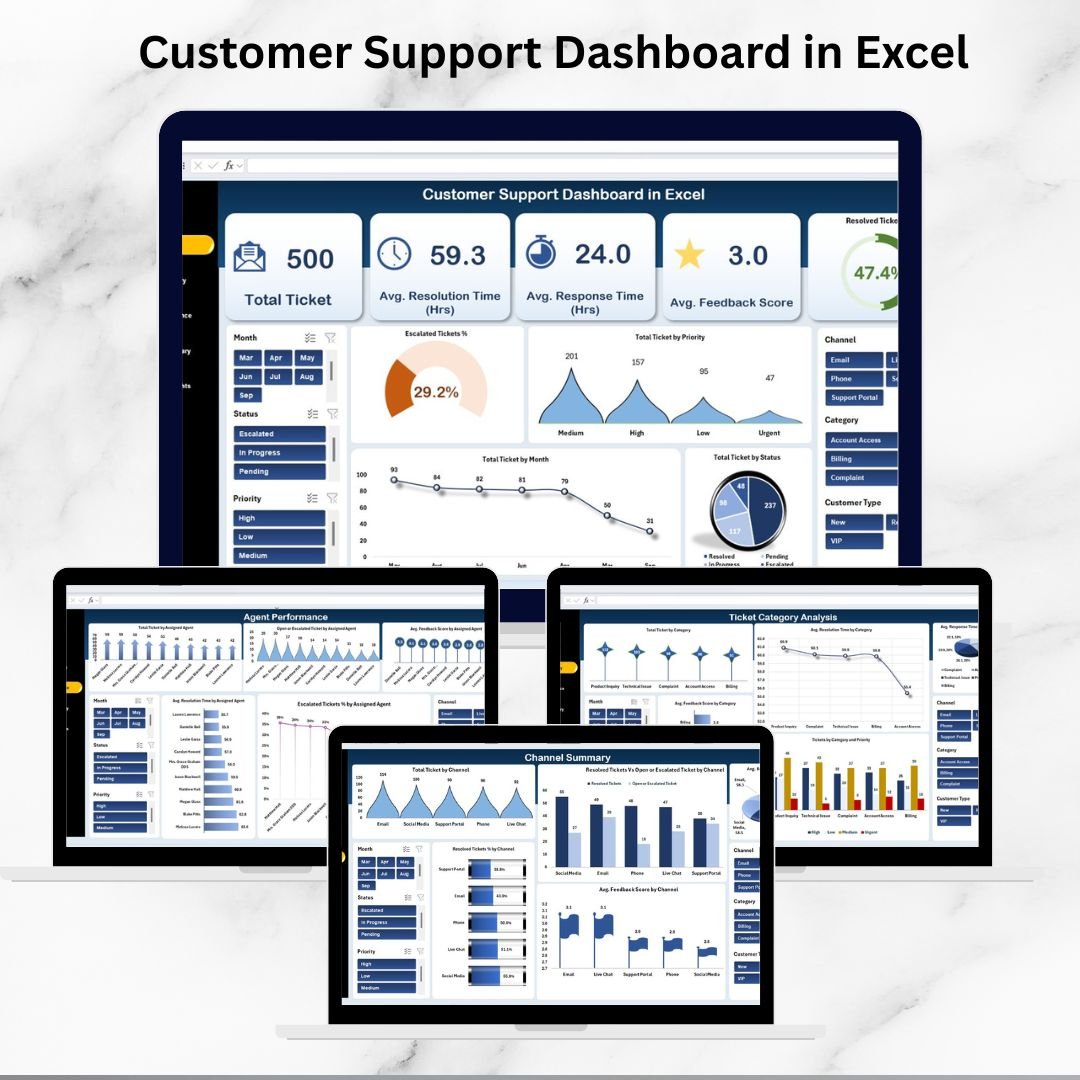
Delivering outstanding customer support isn’t just about solving issues—it’s about creating an experience that keeps customers loyal and engaged. In a fast-paced business environment, where support teams manage hundreds or thousands of tickets across multiple channels, having a centralized, visual reporting system is essential. That’s why the Customer Support Dashboard in Excel is a must-have tool for every support manager and team leader.
This ready-to-use dashboard consolidates key support metrics into interactive visuals and cards, giving you the power to monitor ticket trends, agent performance, resolution times, and customer satisfaction—all in one place. Unlike expensive support management software, this Excel-based solution is cost-effective, customizable, and designed for ease of use, making it ideal for small to large support teams alike.
✨ Key Features of the Customer Support Dashboard
-
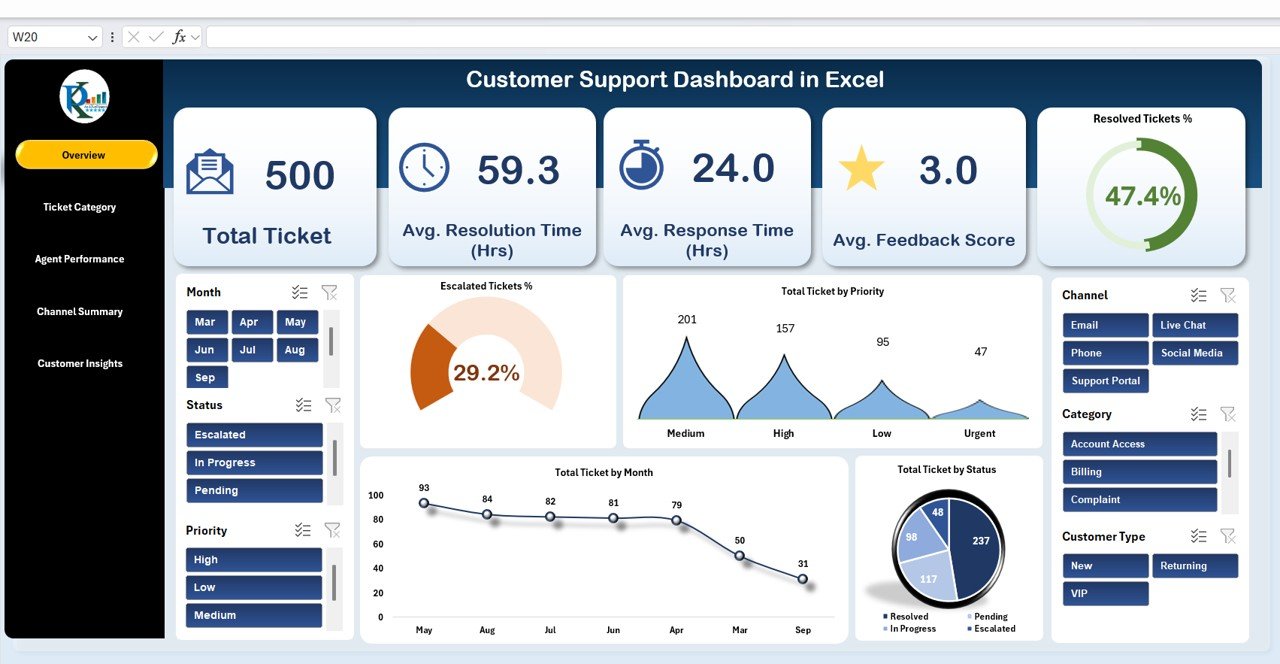
Interactive Overview Page – High-level snapshot of tickets, resolution time, response time, feedback, and resolution % with cards and charts.
-
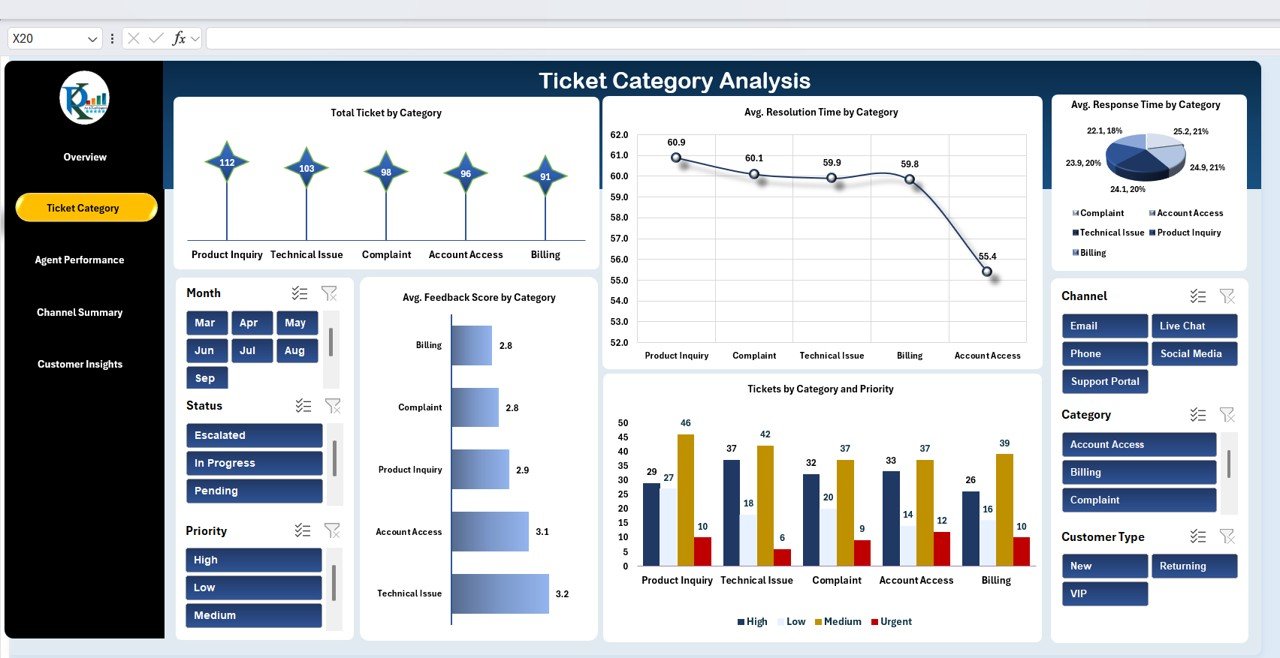
Category Analysis – Track tickets by type, priority, and resolution trends to identify recurring pain points.
-
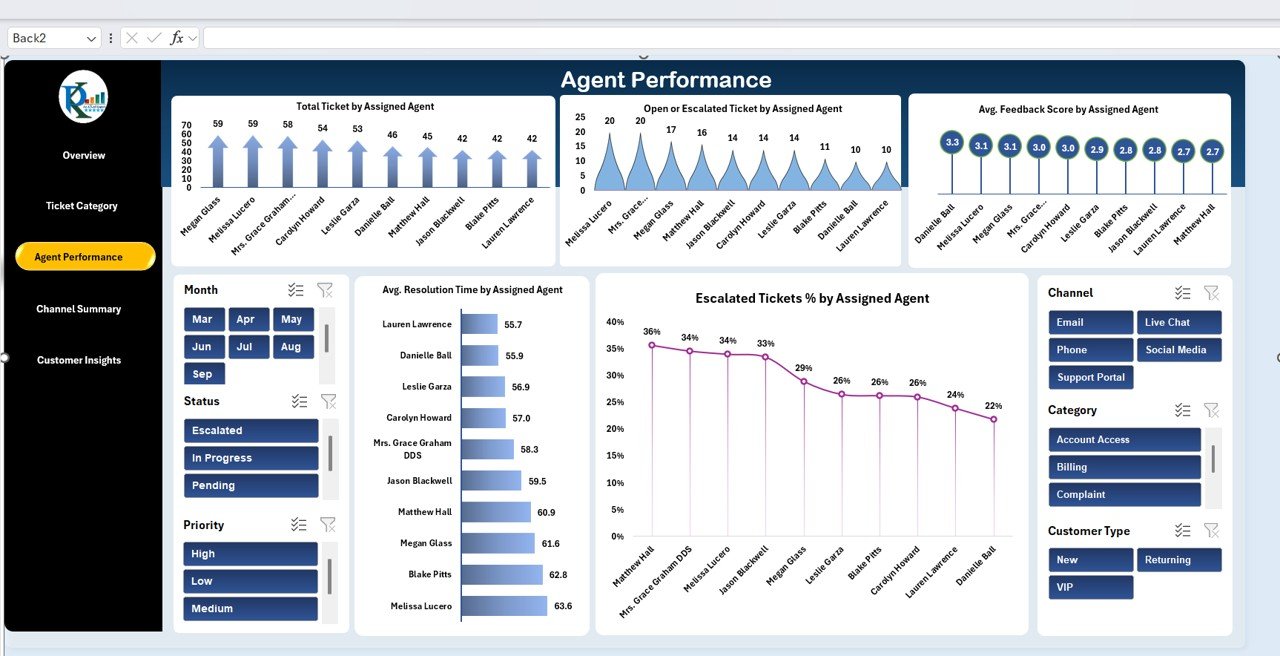
Agent Performance Tracking – Evaluate each agent’s workload, resolution speed, escalation percentage, and customer feedback score.
-
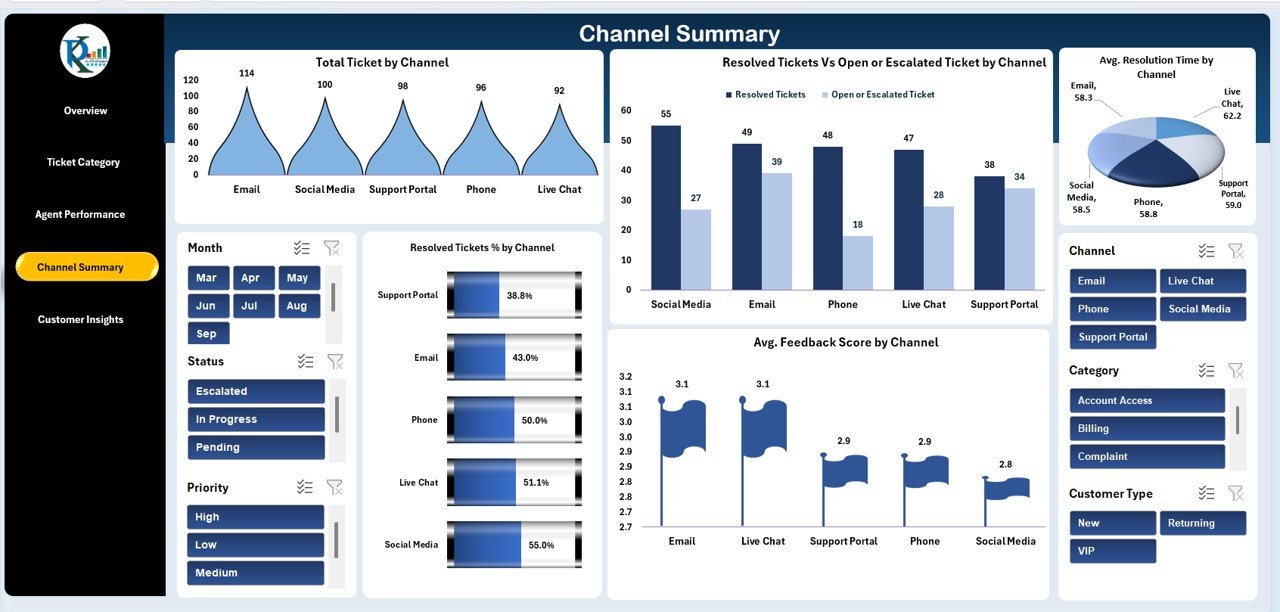
Channel Summary – Compare support efficiency across Email, Chat, Phone, or other channels.
-
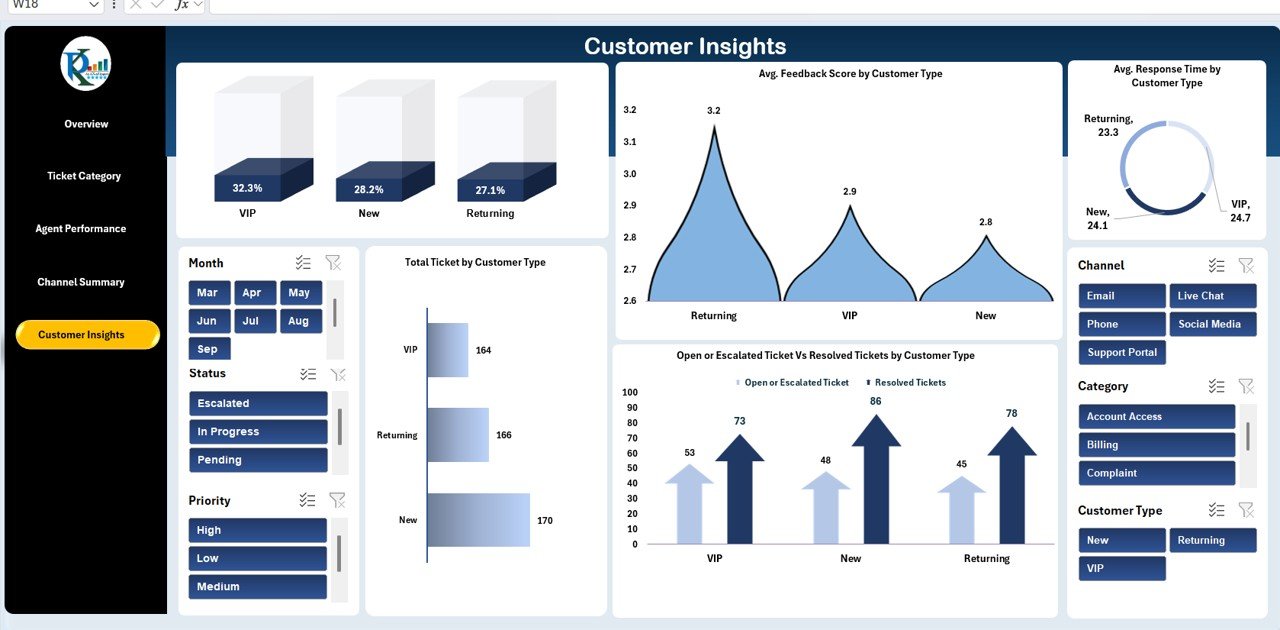
Customer Insights – Analyze satisfaction, ticket volume, and resolution trends by customer type.
-
Dynamic Data Link – Update once in the Data Sheet and see dashboards refresh instantly.
-
Customizable KPIs – Add or adjust performance metrics to fit your support goals.
-
Scalable for Large Teams – Handles high ticket volumes efficiently with pivot tables and structured data.
📂 What’s Inside the Customer Support Dashboard
This dashboard is structured across six dedicated worksheet tabs:
-
Overview Sheet Tab
-
Cards for Total Tickets, Avg. Resolution Time, Avg. Response Time, Avg. Feedback Score, Resolved Tickets %
-
Charts for Escalated Tickets %, Ticket by Priority, Ticket by Month, Ticket by Status
-
-
Ticket Category Analysis Sheet Tab
-
Charts showing tickets by Category, Resolution Time, Priority, Feedback, and Response Time
-
-
Agent Performance Sheet Tab
-
Agent-wise performance on ticket volume, escalation %, feedback score, and resolution time
-
-
Channel Summary Sheet Tab
-
Metrics by channel: Tickets by Channel, Resolved vs Escalated, Feedback Score, Resolution Rate, Resolution Time
-
-
Customer Insights Sheet Tab
-
Tracks Feedback, Response Time, Ticket Status, and Ticket Volume by Customer Type
-
-
Data Sheet Tab
-
Input area for ticket records including Ticket ID, Category, Priority, Status, Agent, Times, Channel, Customer Type, Feedback Score
-
Updates automatically feed into the dashboards for real-time accuracy
-
🛠️ How to Use the Customer Support Dashboard
-
Open the Excel template and navigate to the Data Sheet.
-
Enter or import ticket records (Ticket ID, Category, Priority, Agent, Status, etc.).
-
Switch to the Overview Sheet to get a big-picture view of overall support health.
-
Use Category, Agent, Channel, or Customer sheets for deeper insights.
-
Update regularly (daily or weekly) for the most accurate reporting.
-
Share insights with leadership to align support operations with customer expectations.
👥 Who Can Benefit from This Dashboard
-
Support Managers – Monitor team efficiency and identify training needs.
-
Customer Experience Teams – Track feedback and pinpoint improvement areas.
-
Business Leaders – Gain a strategic view of support operations.
-
Small Businesses – Affordable alternative to costly software solutions.
-
Large Enterprises – Manage high-volume support operations at scale.
-
BPOs & Outsourcing Firms – Monitor agent performance across clients.
✅ Advantages of Using the Dashboard
-
Centralized Insights – All key metrics in one structured view.
-
Agent Performance Tracking – Identify top performers and areas needing coaching.
-
Customer Satisfaction Monitoring – Analyze feedback trends for better engagement.
-
Channel Optimization – Compare support efficiency across multiple platforms.
-
Data-Driven Decisions – Make informed process improvements with clear visuals.
-
Customizable & Scalable – Works for any team size and adapts to your KPIs.
🔑 Best Practices
-
Update ticket data daily or weekly for accuracy.
-
Segment analysis by agent, channel, and category for deeper insights.
-
Track escalation causes to reduce recurring issues.
-
Review trends monthly and quarterly to optimize resources.
-
Customize KPIs to reflect your team’s unique support goals.


Reviews
There are no reviews yet.