

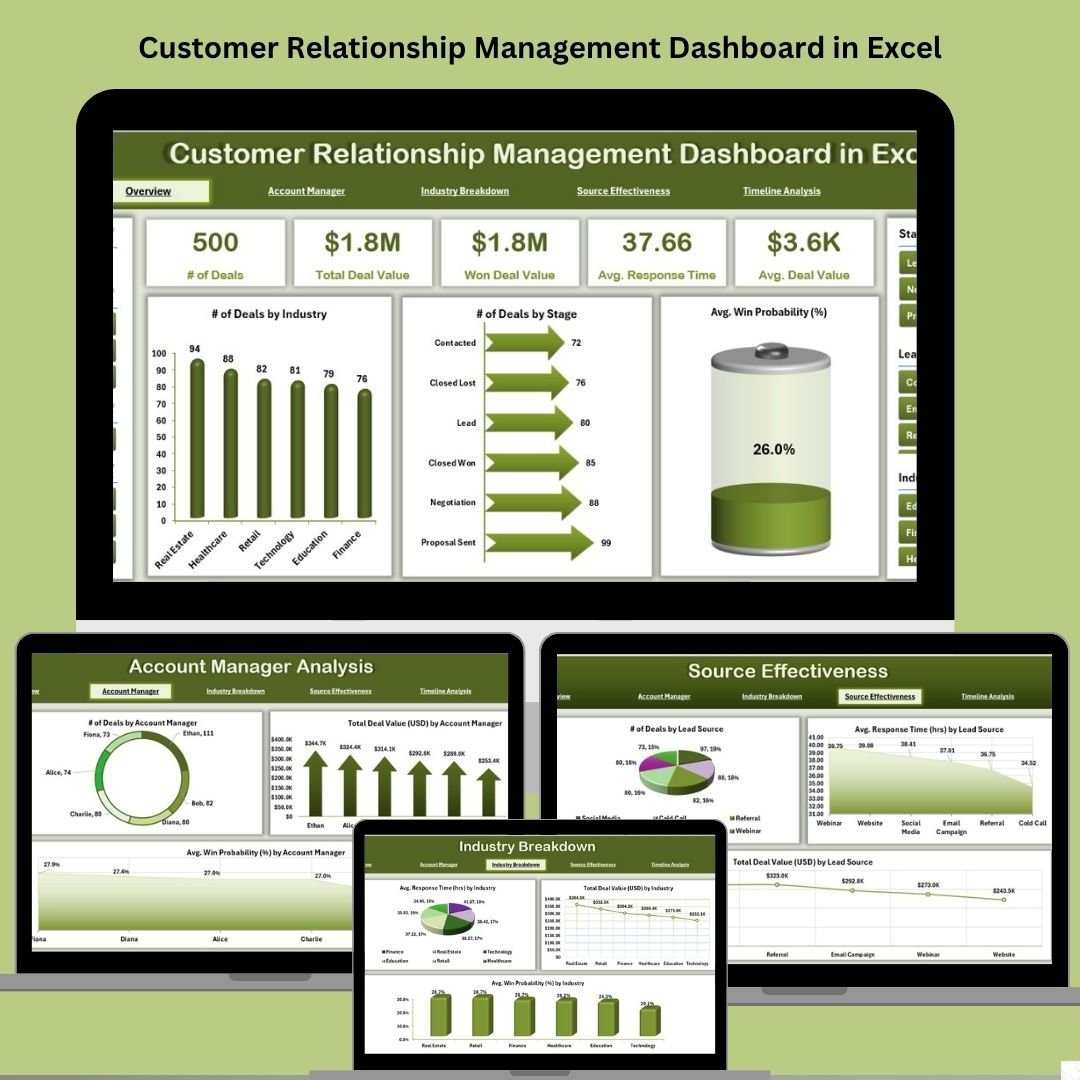



Managing customer relationships just got easier! With the Customer Relationship Management Dashboard in Excel, you can organize, analyze, and act on client data—without investing in expensive CRM software. This all-in-one Excel template is designed to help businesses monitor deals, analyze sources, and improve team performance in a familiar, user-friendly environment.
Whether you’re a startup, small business, or freelancer managing your own pipeline, this dynamic dashboard puts you in control of your sales process. Get ready to turn raw data into smart decisions.
✨ Key Features of CRM Dashboard
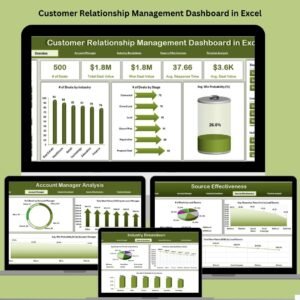
📊 Overview Page – Your Sales Command Center
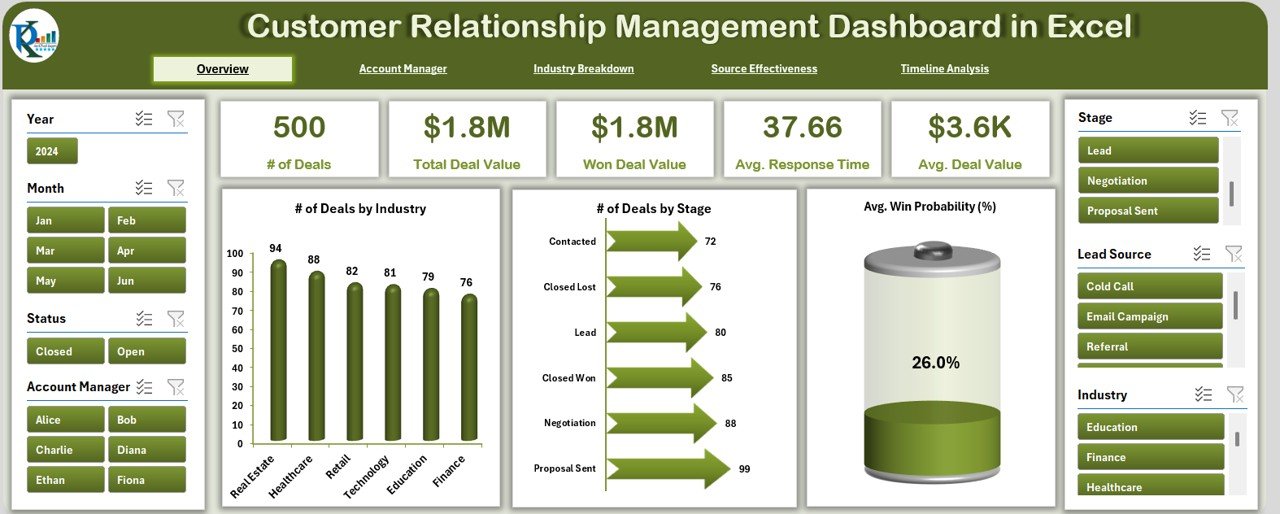
Left & right-side slicers to filter by time, manager, or source
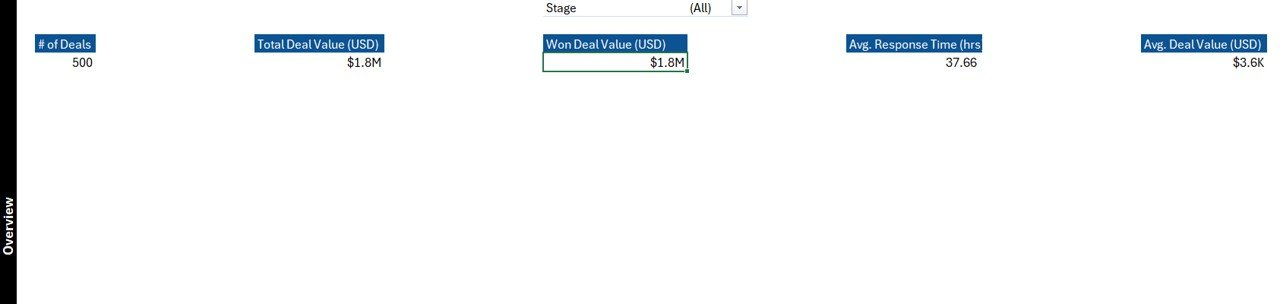
5 summary cards: Deals, Deal Value, Win Rate & more
Visuals include:
✔ Deals by Month
✔ Deal Value by Month
✔ Avg. Win Probability (%) by Month
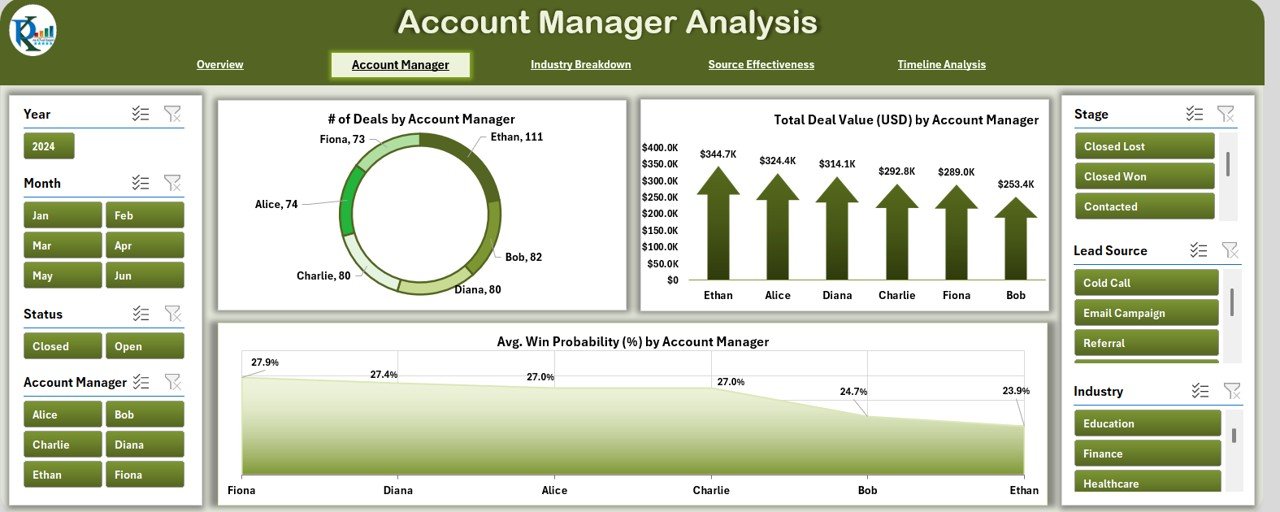
🧑💼 Account Manager Analysis
Track how each account manager performs with:
Slicers for drill-down by manager
Charts for Number of Deals, Deal Value, Win Probability
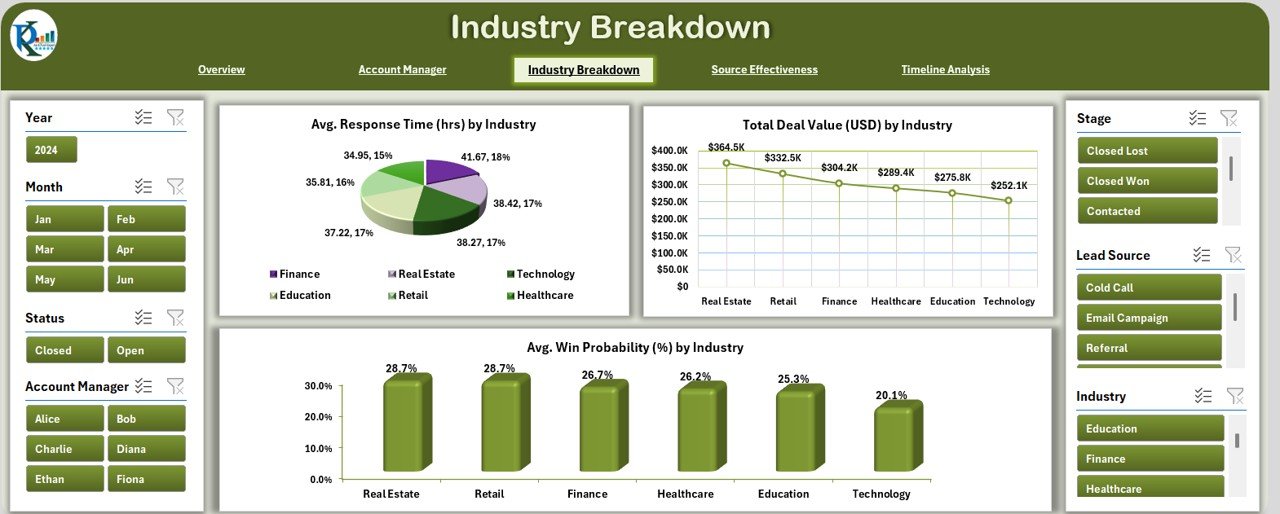
🏢 Industry Analysis
Identify top-performing industries using:
Average Response Time
Deal Value
Win Probability by Industry
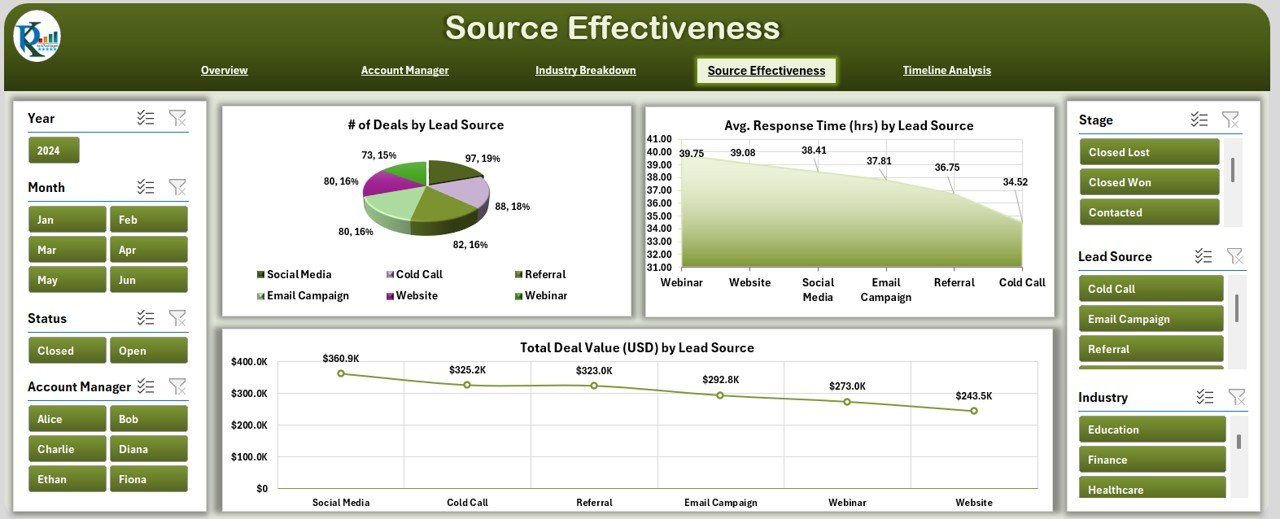
📣 Source Effectiveness Page
Optimize marketing by measuring lead source performance:
Number of Deals
Deal Value
Average Response Time by Source
📈 Timeline Analysis Page
Perfect for forecasting and planning:
Deals by Month
Average Deal Value
Monthly Win Probability
📂 What’s Inside the CRM Dashboard Template
🟢 Data Sheet
Your primary data input area. Add values for:
Customer ID
Lead Source
Industry
Account Manager
Contact Date
Response Time
Deal Value
Win Probability (%)
Status, Stage, Month, Year
🟢 Support Sheet
Store all dropdown list options for:
Industries
Account Managers
Lead Sources
This keeps your data clean, consistent, and error-free.
🛠️ How to Use the CRM Dashboard
👉 Step 1: Add Your Customer Data
Enter contact and deal information in the Data Sheet.
👉 Step 2: Customize Dropdown Lists
Update support fields like managers, industries, and lead sources.
👉 Step 3: Explore the Dashboard Pages
Use slicers and visuals to filter and analyze performance.
👉 Step 4: Update Weekly
Keep your data fresh to make informed decisions with real-time insights.
👉 Step 5: Present or Share Easily
Use charts and KPIs in meetings or share via cloud storage.
👥 Who Can Benefit from This CRM Dashboard?
✅ Sales Teams – Stay motivated by tracking deals and targets
✅ Marketing Managers – Optimize lead sources and campaigns
✅ Freelancers – Manage personal pipelines like a pro
✅ Small Business Owners – Get visibility without expensive tools
✅ Startups – Build an agile CRM process that grows with you
🔧 Customization Ideas to Boost Performance
💡 Add a Funnel Chart to visualize deal stages
📈 Insert Forecast vs Actual comparison charts
🌟 Highlight High-Value Deals with conditional formatting
📅 Track Follow-Up Dates or reminders
🔁 Create User Forms with VBA for easy data entry
This template is flexible and designed to grow with your business.
✅ Click here to read the Detailed blog post
🔗 Visit our YouTube channel to learn step-by-step video tutorials
Watch the step-by-step video tutorial:
Compatibility and Requirements
- Works in Microsoft Excel desktop (Excel 2016 or later, or Microsoft 365).
- The dashboard pages use slicers to filter by time, account manager and lead source. Microsoft explains them in Use slicers to filter data.
Frequently Asked Questions
Which pages does the dashboard include?
The dashboard has an Overview page, an Account Manager Analysis page, an Industry Analysis page, a Source Effectiveness page and a Timeline Analysis page. The workbook also has a Data Sheet and a Support Sheet.
What data do I enter?
You enter your customer data in the Data Sheet: Customer ID, Lead Source, Industry, Account Manager, Contact Date, Response Time, Deal Value, Win Probability (%), Status, Stage, Month and Year.
How do I change the dropdown options?
Open the Support Sheet and edit the lists of industries, account managers and lead sources. The dropdowns in the Data Sheet use those lists.
Can I see which lead source works best?
Yes. The Source Effectiveness page shows the number of deals, deal value and average response time for each lead source.
Is there a Power BI or Google Sheets version?
Yes. See the Customer Relationship Management Dashboard in Power BI and the Customer Relationship Management Dashboard in Google Sheets.
Related Customer Templates
- Customer Relationship Management Dashboard in Power BI: the same CRM dashboard in Power BI
- Customer Relationship Management Dashboard in Google Sheets: a Google Sheets edition
- Customer Satisfaction Dashboard in Excel: track how satisfied your customers are
- Customer Retention KPI Dashboard in Excel: follow customer retention KPIs
- Customer Address Book and Follow Up System V1.0: keep customer contacts and follow-ups
Browse all Excel dashboards.








Reviews
There are no reviews yet.