✅ Customer Onboarding Dashboard in Excel
Customer onboarding is a critical step in building strong and long-lasting business relationships. From the moment a new customer registers to the time they complete all onboarding activities, multiple departments need to work together to achieve a smooth experience. Without a central dashboard, this process can quickly become fragmented and hard to manage — causing delays, missed tasks, and poor satisfaction.
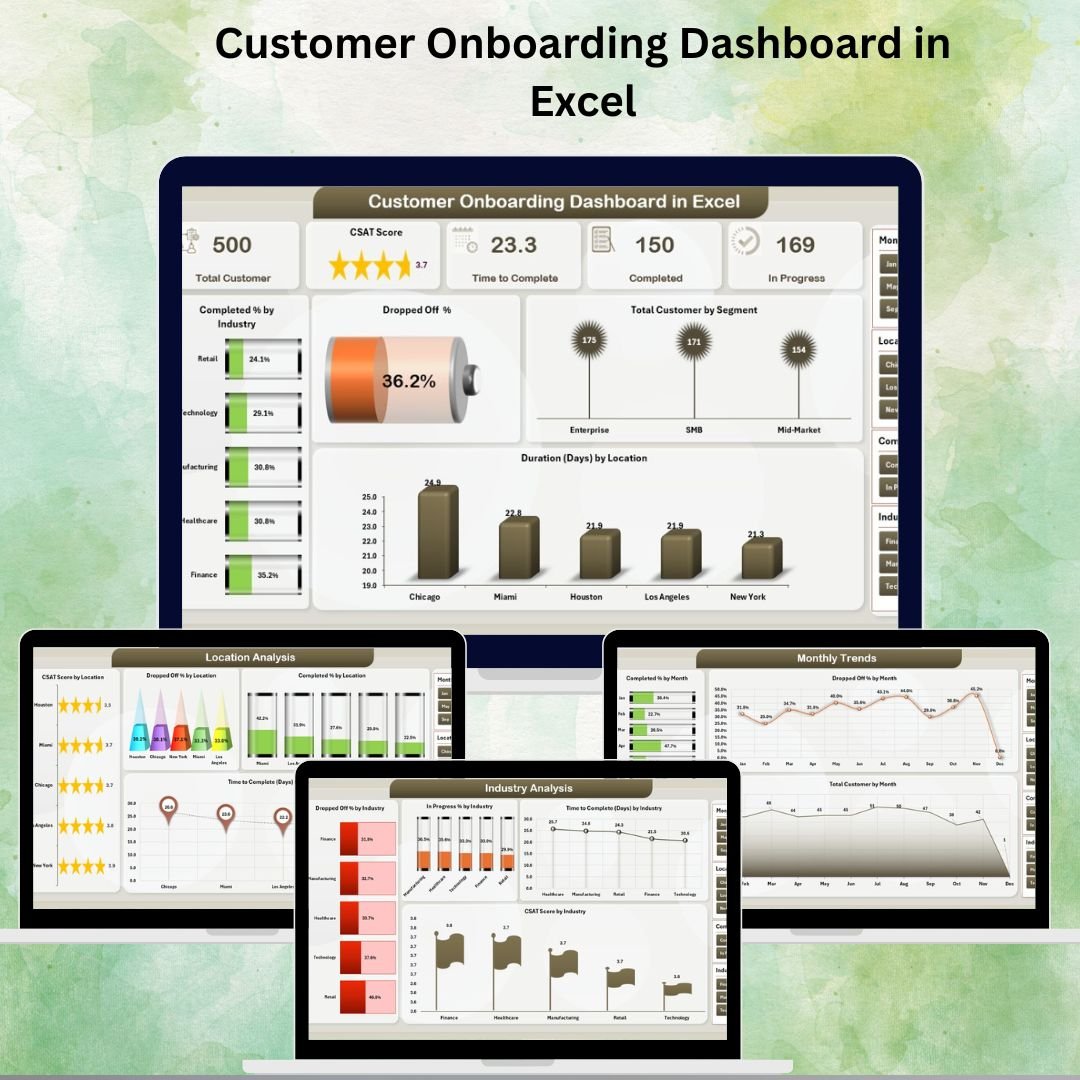
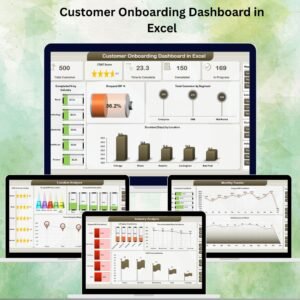
The Customer Onboarding Dashboard in Excel is a ready-to-use, highly visual template that helps you centralize onboarding performance data in one place. It transforms raw data into actionable insights, allowing you to track completion rates, dropped-off percentages, customer satisfaction (CSAT) scores, and task delays. Designed with 5 analytical pages, this dashboard gives leaders a clear overview and allows teams to drill down into specific areas (industry, location, stage, or month).
You don’t need any coding or expensive BI tools — everything works inside Excel using pivot tables, charts, slicers, and conditional formatting.
✨ Key Features of the Customer Onboarding Dashboard in Excel
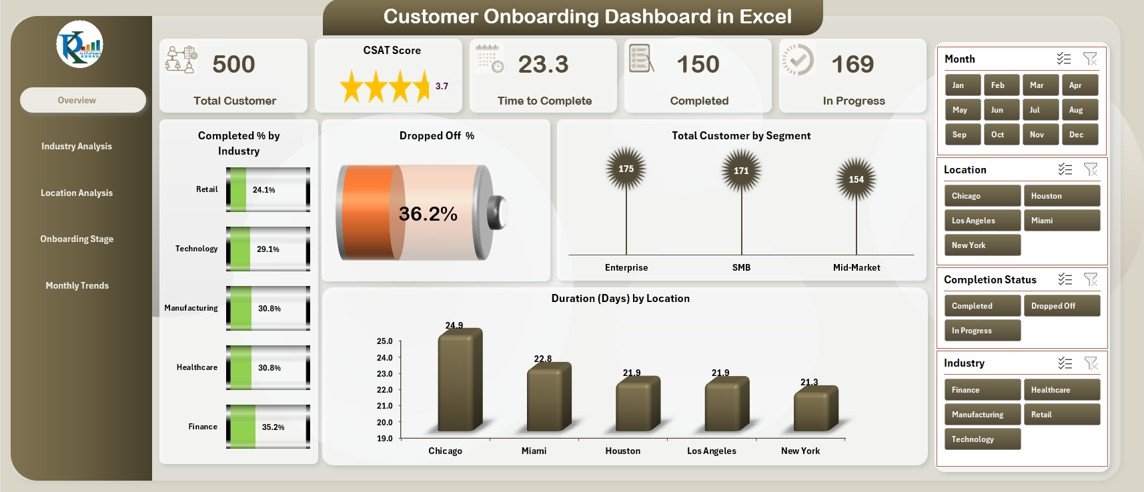
✅ Overview Page – High-Level Snapshot
-
KPI Cards such as Completed %, Delayed %, High Urgency %, CSAT %, Completion % by Department and Industry
-
Visuals for Dropped Off %, Total Customers by Segment, and Duration by Location
-
Slicers on the right-hand side for quick filtering (e.g., Month, Segment)
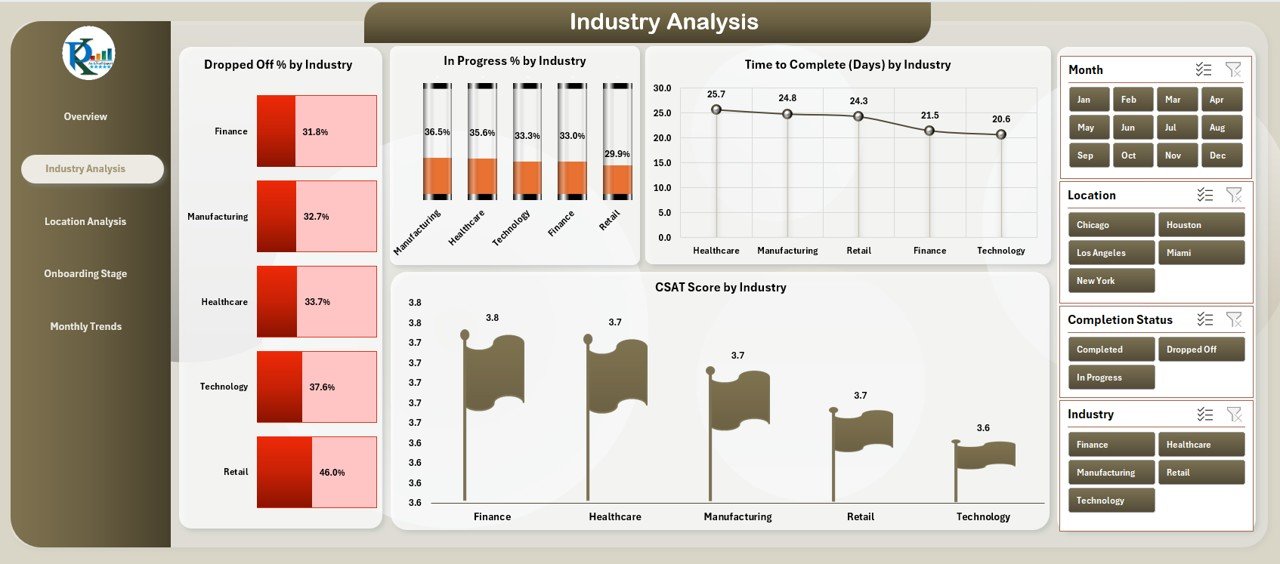
✅ Industry Analysis Page
-
Dropped Off % by Industry
-
In Progress % by Industry
-
Time to Complete (Days) by Industry
-
CSAT Score by Industry
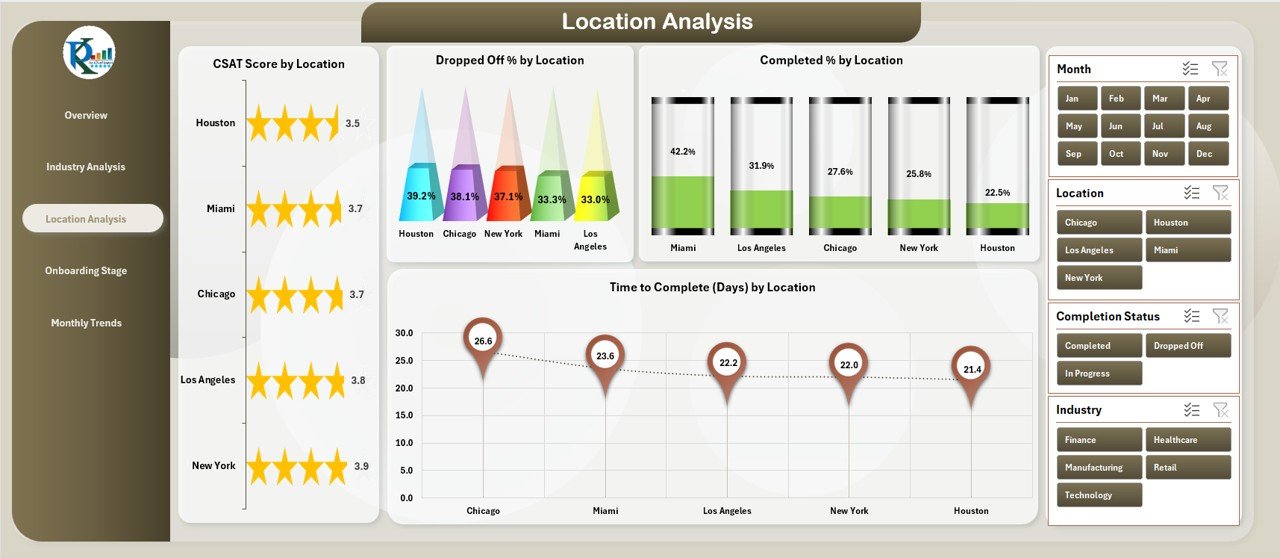
✅ Location Analysis Page
-
Regional performance view with CSAT, Dropped Off %, Completed %, and Time to Complete by Location
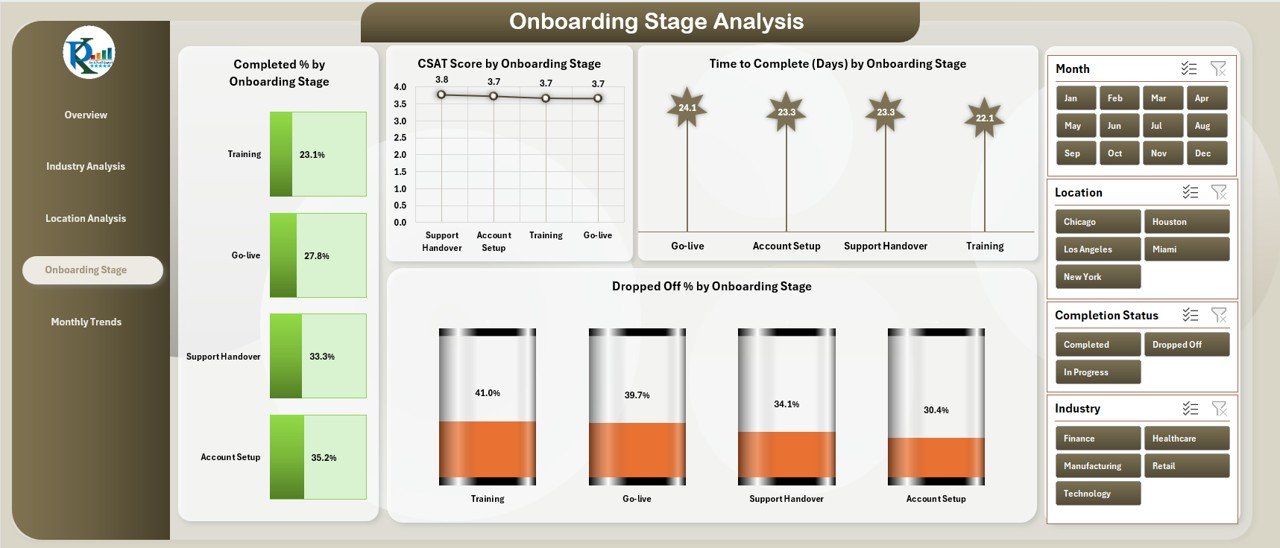
✅ Onboarding Stage Analysis Page
-
Completed % by Stage
-
Dropped Off % by Stage
-
Time to Complete by Stage
-
CSAT Score by Stage
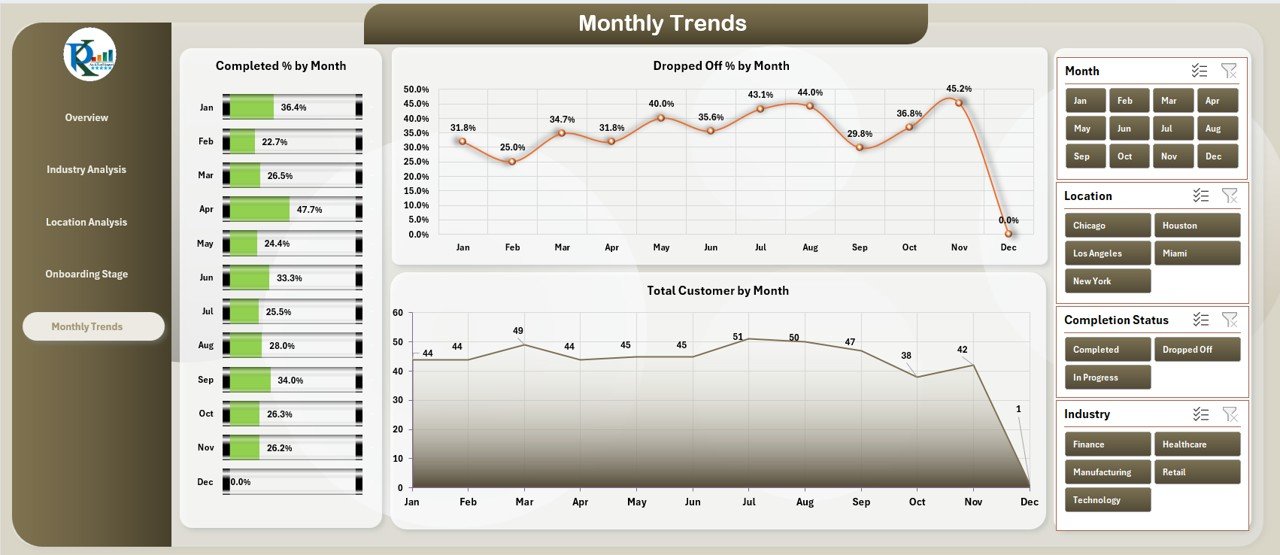
✅ Monthly Trends Page
-
Time-series charts of Completed %, Dropped Off %, and Total Customers per month
-
Identify seasonality and performance shifts quickly
🛠 How to Use the Customer Onboarding Dashboard
-
Organize Your Data in a clean table with fields like Customer Name, Industry, Location, Stage, CSAT, Start Date, End Date.
-
Insert Pivot Tables & Charts to summarize data into KPIs.
-
Create Dashboard Pages (Overview, Industry, Location, Stage, Monthly Trends).
-
Add Slicers (Month, Segment, Department) to make the dashboard interactive.
-
Apply Conditional Formatting to highlight delays and urgent tasks.
-
Review & Update Data Regularly to keep insights accurate.
🎯 Who Can Benefit from This Dashboard
📞 Customer Success Teams – Track onboarding progress and identify customers needing support
🧑💼 Operations & Process Managers – Monitor workloads and optimize onboarding processes
📈 Executive Management – Get a real-time overview of onboarding health and CSAT performance
🧠 Data & Insight Analysts – Drill down into patterns by industry, region, or stage
🚀 Key Benefits
-
Full Visibility of onboarding progress in one dashboard
-
Early Detection of Delays & Drop-Offs
-
Improved Customer Satisfaction through faster follow-up
-
Better Resource Allocation across departments or regions
-
Data-Driven Decisions instead of assumptions
-
100% Customizable – No code, no license required
📖 Click here to read the Detailed blog post
Visit our YouTube channel to learn step-by-step video tutorials


Reviews
There are no reviews yet.