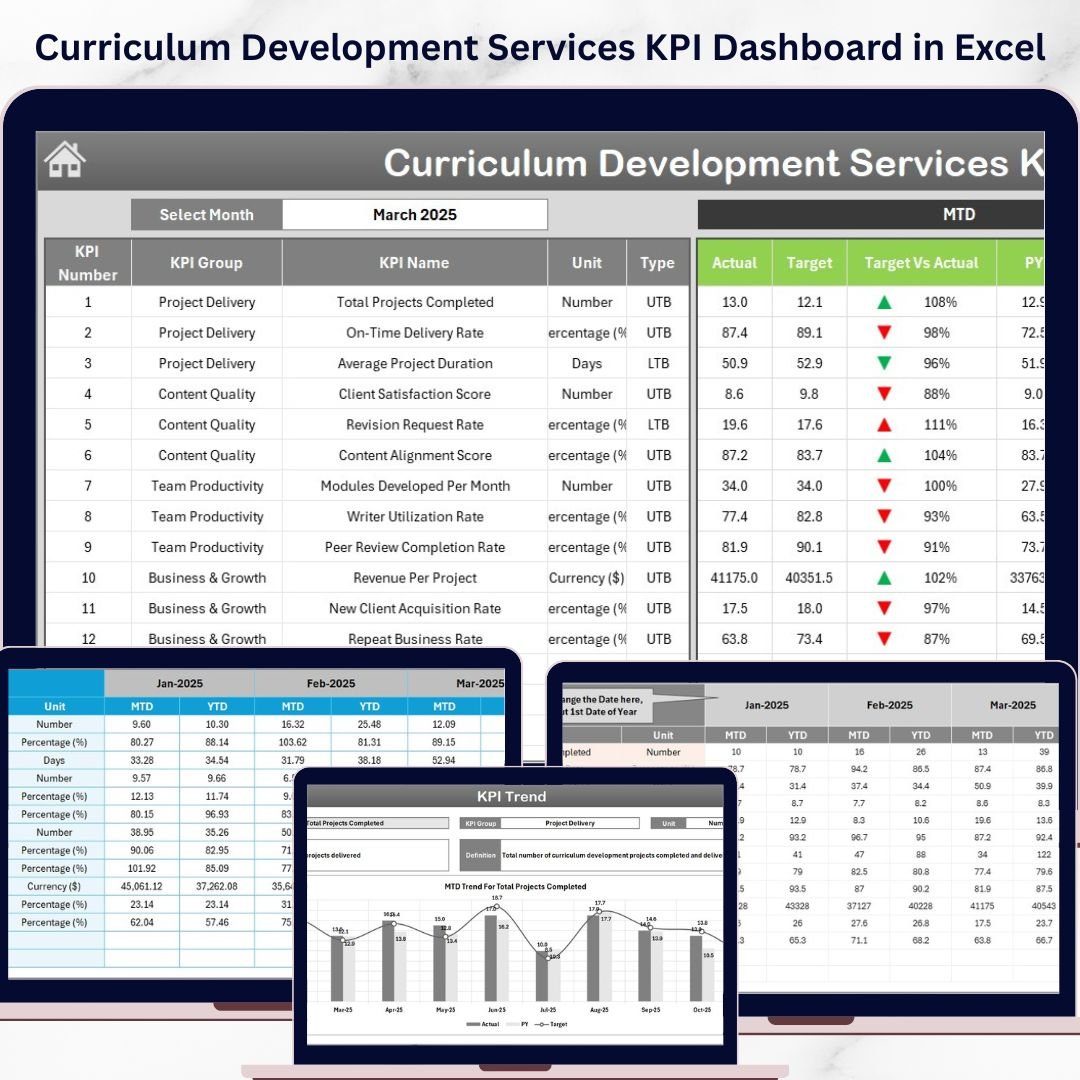
Key Features of Curriculum Development Services KPI Dashboard
Introducing the Curriculum Development Services KPI Dashboard – your ultimate digital solution to track, analyze, and optimize key performance indicators for curriculum development projects. Designed with precision and usability in mind, this comprehensive dashboard features 7 intuitive worksheets that provide a seamless experience for managing your KPIs with real-time insights.
- 📊 Home Sheet: Acts as the central navigation hub with 6 easy-to-use buttons that instantly direct you to specific sheets, enhancing your workflow efficiency.
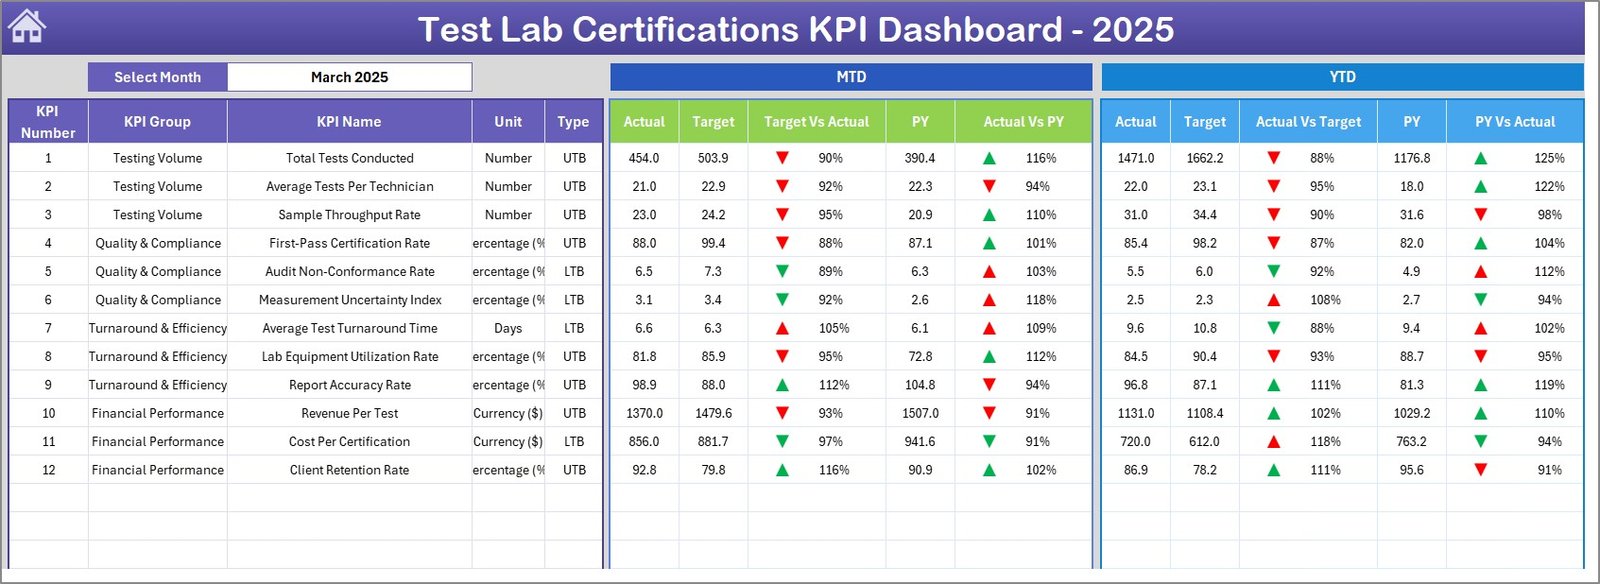
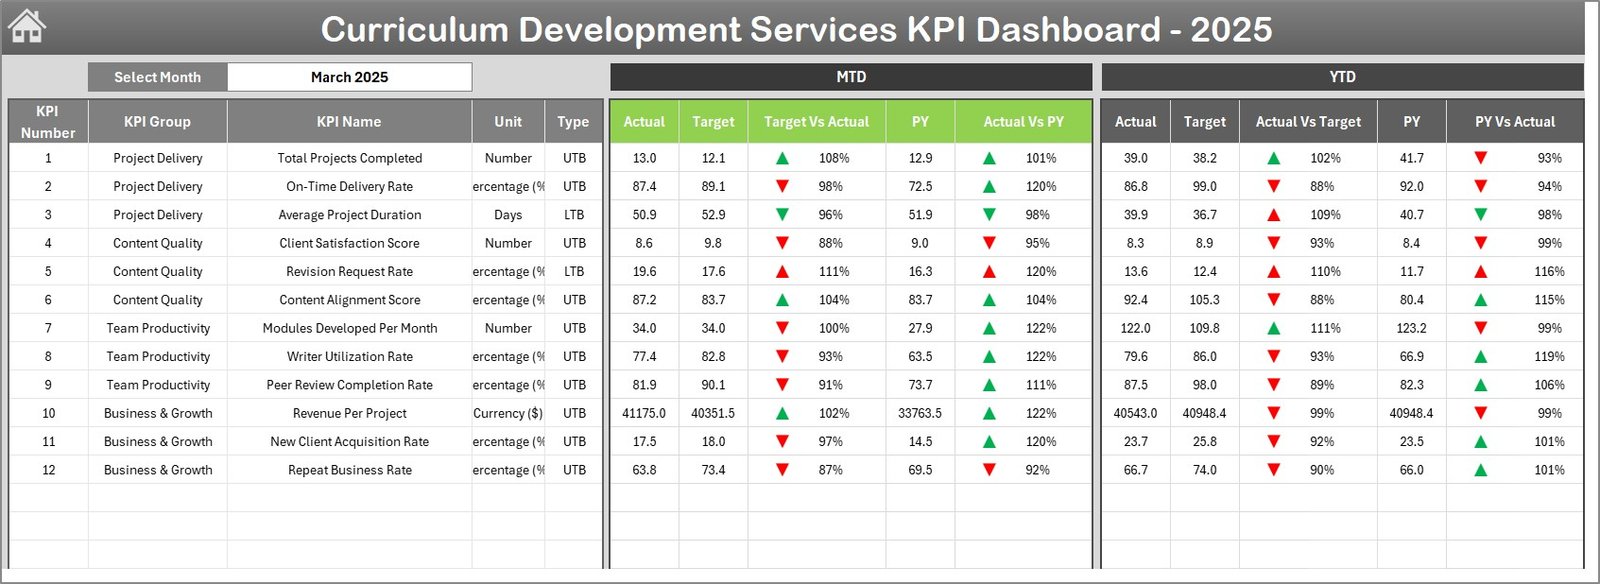
- 📈 Dashboard Sheet: The main control center where you can select any month from a dropdown (located at cell D3) to dynamically update all KPI data. It showcases Month-To-Date (MTD) Actual, Target, and Previous Year data alongside Year-To-Date (YTD) metrics. Visual cues like conditional formatting and up/down arrows help you quickly interpret Target vs. Actual and Previous Year vs. Actual comparisons.
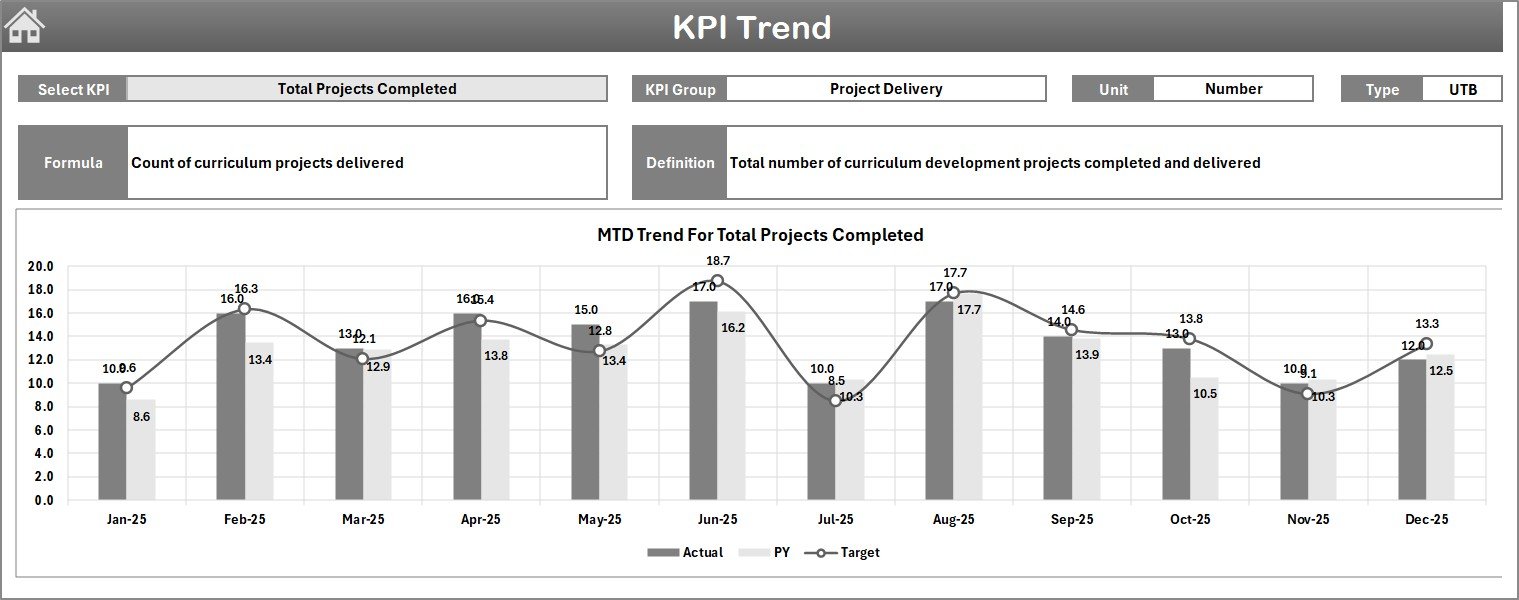
- 📉 KPI Trend Sheet: Select a KPI from the dropdown in cell C3 to view detailed information including KPI Group, Unit, Type (Lower the Better or Upper the Better), Formula, and Definition. This sheet also displays MTD and YTD trend charts comparing Actual, Target, and Previous Year performance, enabling data-driven decisions.
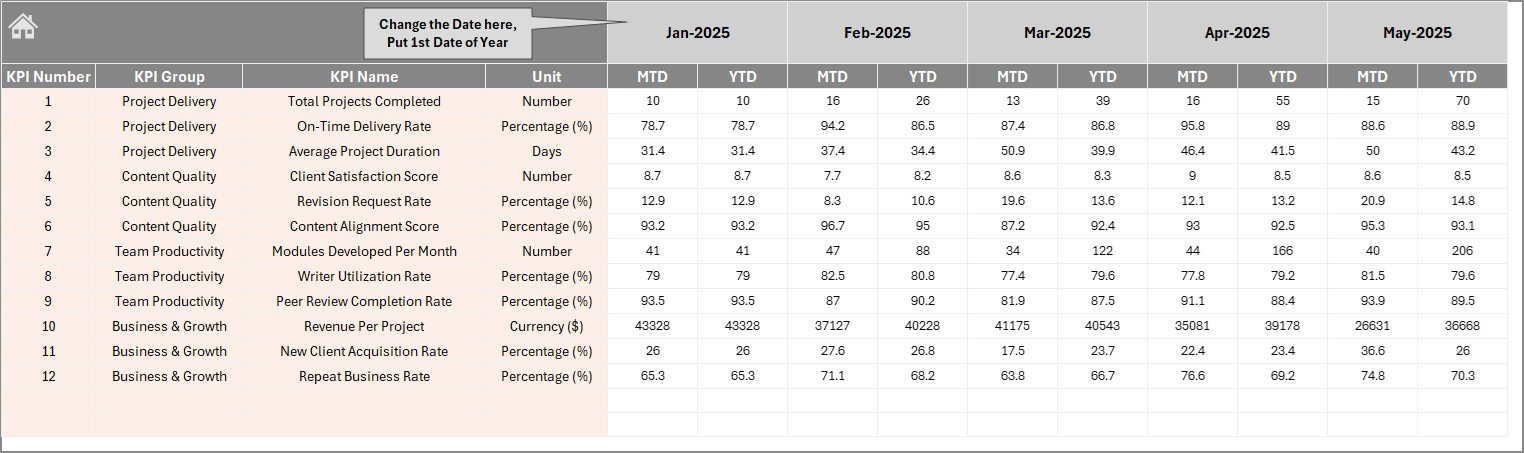
- ✍️ Actual Numbers Input Sheet: Easily input your actual numbers for MTD and YTD. You can modify the starting month of the year in cell E1 to align data entry accurately with your fiscal calendar.
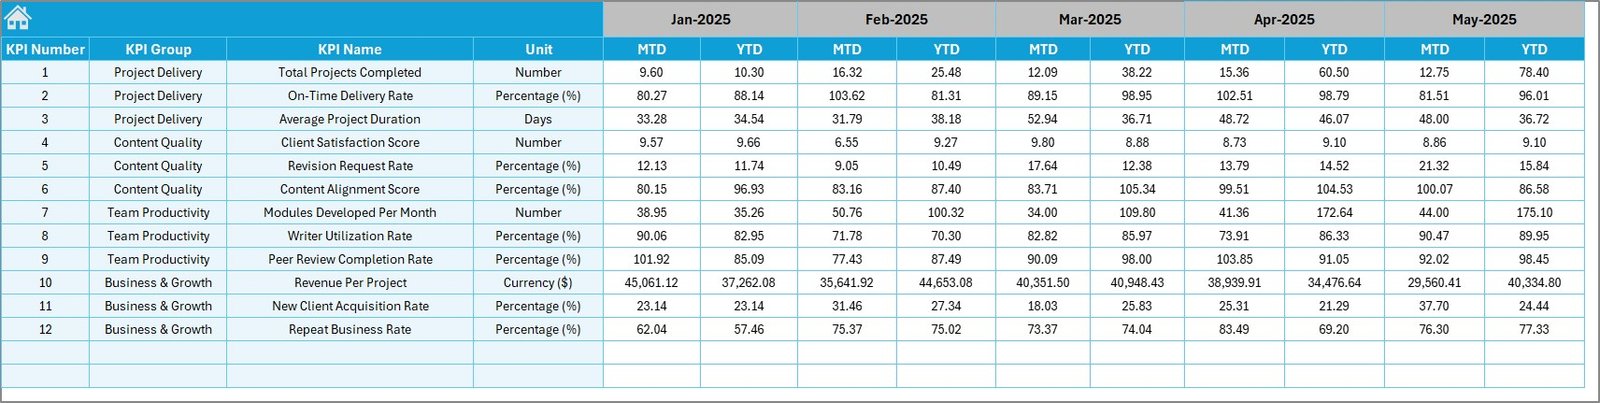
- 🎯 Target Number Input Sheet: Specify monthly target values for each KPI, both MTD and YTD, to ensure goal tracking and performance benchmarking.
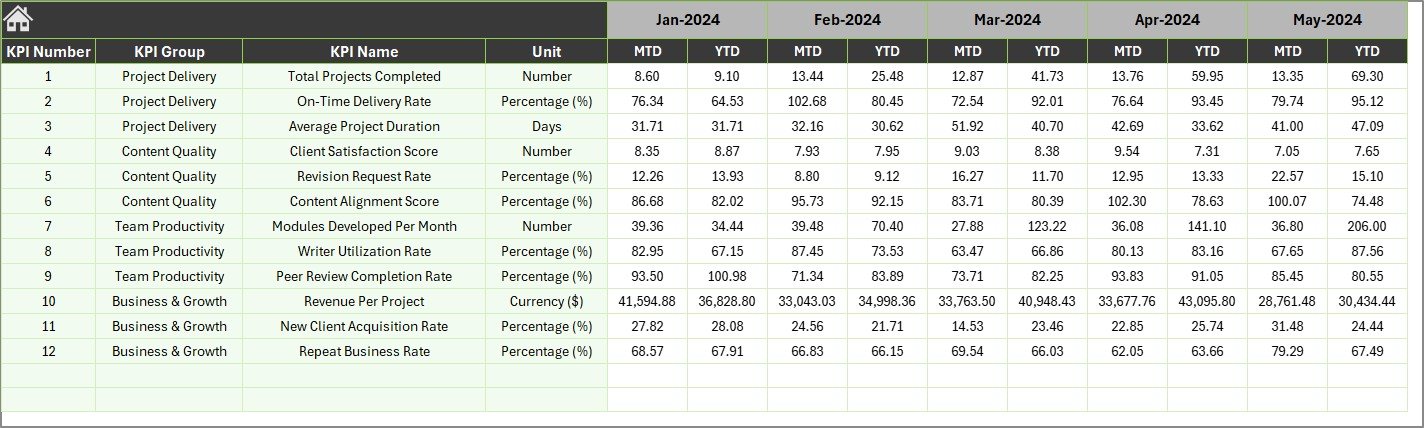
- 📅 Previous Year Number Sheet: Input your previous year’s data to facilitate year-over-year comparisons and trend analysis.
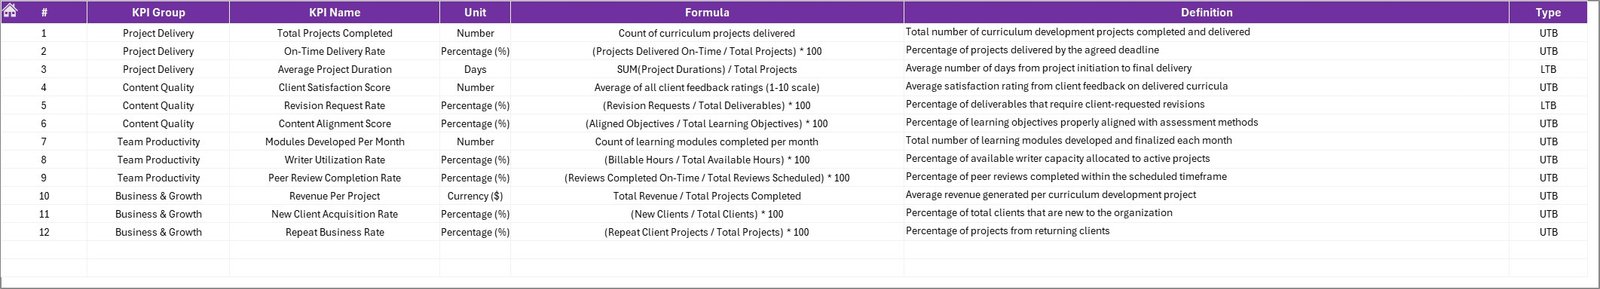
- 📚 KPI Definition Sheet: Manage your KPI metadata here by entering KPI Name, Group, Unit, Formula, Definition, and Type (LTB or UTB), ensuring clarity and consistency across your reporting.
What’s Inside the Curriculum Development Services KPI Dashboard
This dashboard is meticulously crafted for curriculum development professionals, educators, and project managers, incorporating all essential components for end-to-end KPI management. It contains seven interactive worksheets that work cohesively to provide a 360-degree view of your performance metrics, including:
- 📌 An easy-to-navigate home page with quick access buttons
- 📊 A dynamic dashboard that updates monthly data instantly
- 📉 Trend analysis charts for deep insights into KPI movements
- ✍️ Dedicated input sheets for actual, target, and previous year data
- 📑 A detailed KPI definition repository for transparency and accuracy
How to Use the Curriculum Development Services KPI Dashboard
Getting started with this KPI dashboard is simple and intuitive:
- 🖱️ Use the Home Sheet to navigate quickly between sections.
- 📅 Select the desired month on the Dashboard Sheet to view up-to-date KPI results.
- ✍️ Enter your actual results monthly in the Actual Numbers Input Sheet, adjusting the starting month as needed.
- 🎯 Enter your performance targets in the Target Number Input Sheet to benchmark progress.
- 📆 Fill in previous year’s data for comparative analysis.
- 📊 Explore KPI trends by selecting KPIs in the KPI Trend Sheet and analyze graphical performance data.
- 📚 Update or review KPI definitions to ensure consistent understanding across your team.
Who Can Benefit from This Curriculum Development Services KPI Dashboard
This dashboard is the perfect digital asset for a wide range of professionals and organizations involved in curriculum development and educational project management:
- 🏫 Educational Institutions: Track curriculum development effectiveness and align with educational goals.
- 🎓 Curriculum Developers: Monitor KPIs to optimize course design and delivery.
- 📈 Project Managers: Gain real-time insight into curriculum project progress and outcomes.
- 🧑🏫 Training Coordinators: Evaluate training program impact using data-driven KPI analysis.
- 📊 Data Analysts: Leverage comprehensive KPI data for reporting and strategic recommendations.
- 🏢 Educational Consultants: Provide clients with clear, actionable dashboards to improve curriculum quality.
Click here to read the Detailed blog post.
Visit our YouTube channel to learn step-by-step video tutorials


Reviews
There are no reviews yet.