
Corporate audits are no longer just about compliance—they are about risk control, cost visibility, and smarter governance. Yet many organizations still depend on scattered Excel files, emails, and static audit reports. This approach delays insights, hides risks, and makes audit follow-ups difficult.
That is exactly why the Corporate Audit Dashboard in Power BI is a game-changer.
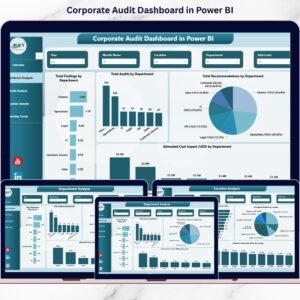
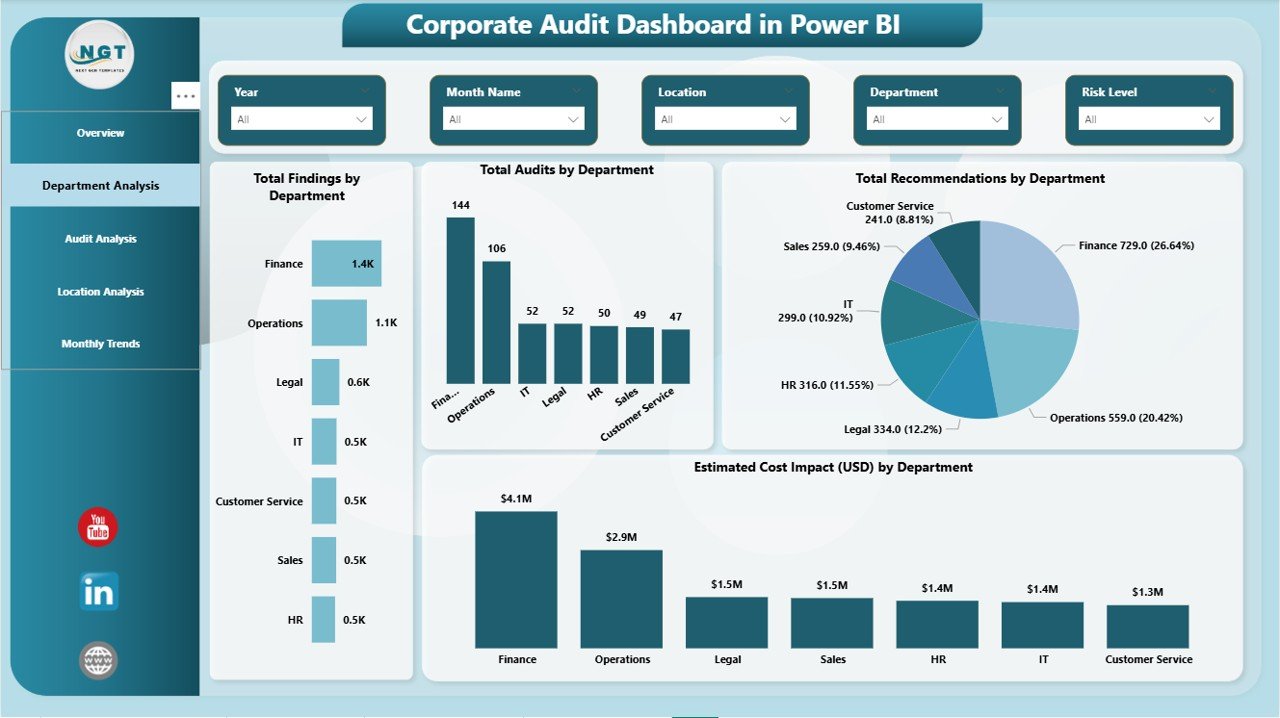
This ready-to-use Power BI dashboard converts raw audit data into clear, interactive, and decision-ready insights. Instead of reading long reports, audit teams and leadership can instantly understand audit performance, risk exposure, findings, and cost impact—all in one centralized dashboard.
Designed for modern audit teams, this solution improves transparency, speeds up decision-making, and strengthens governance across departments and locations.
## 🚀 Key Features of Corporate Audit Dashboard in Power BI
📊 Five Interactive Dashboard Pages
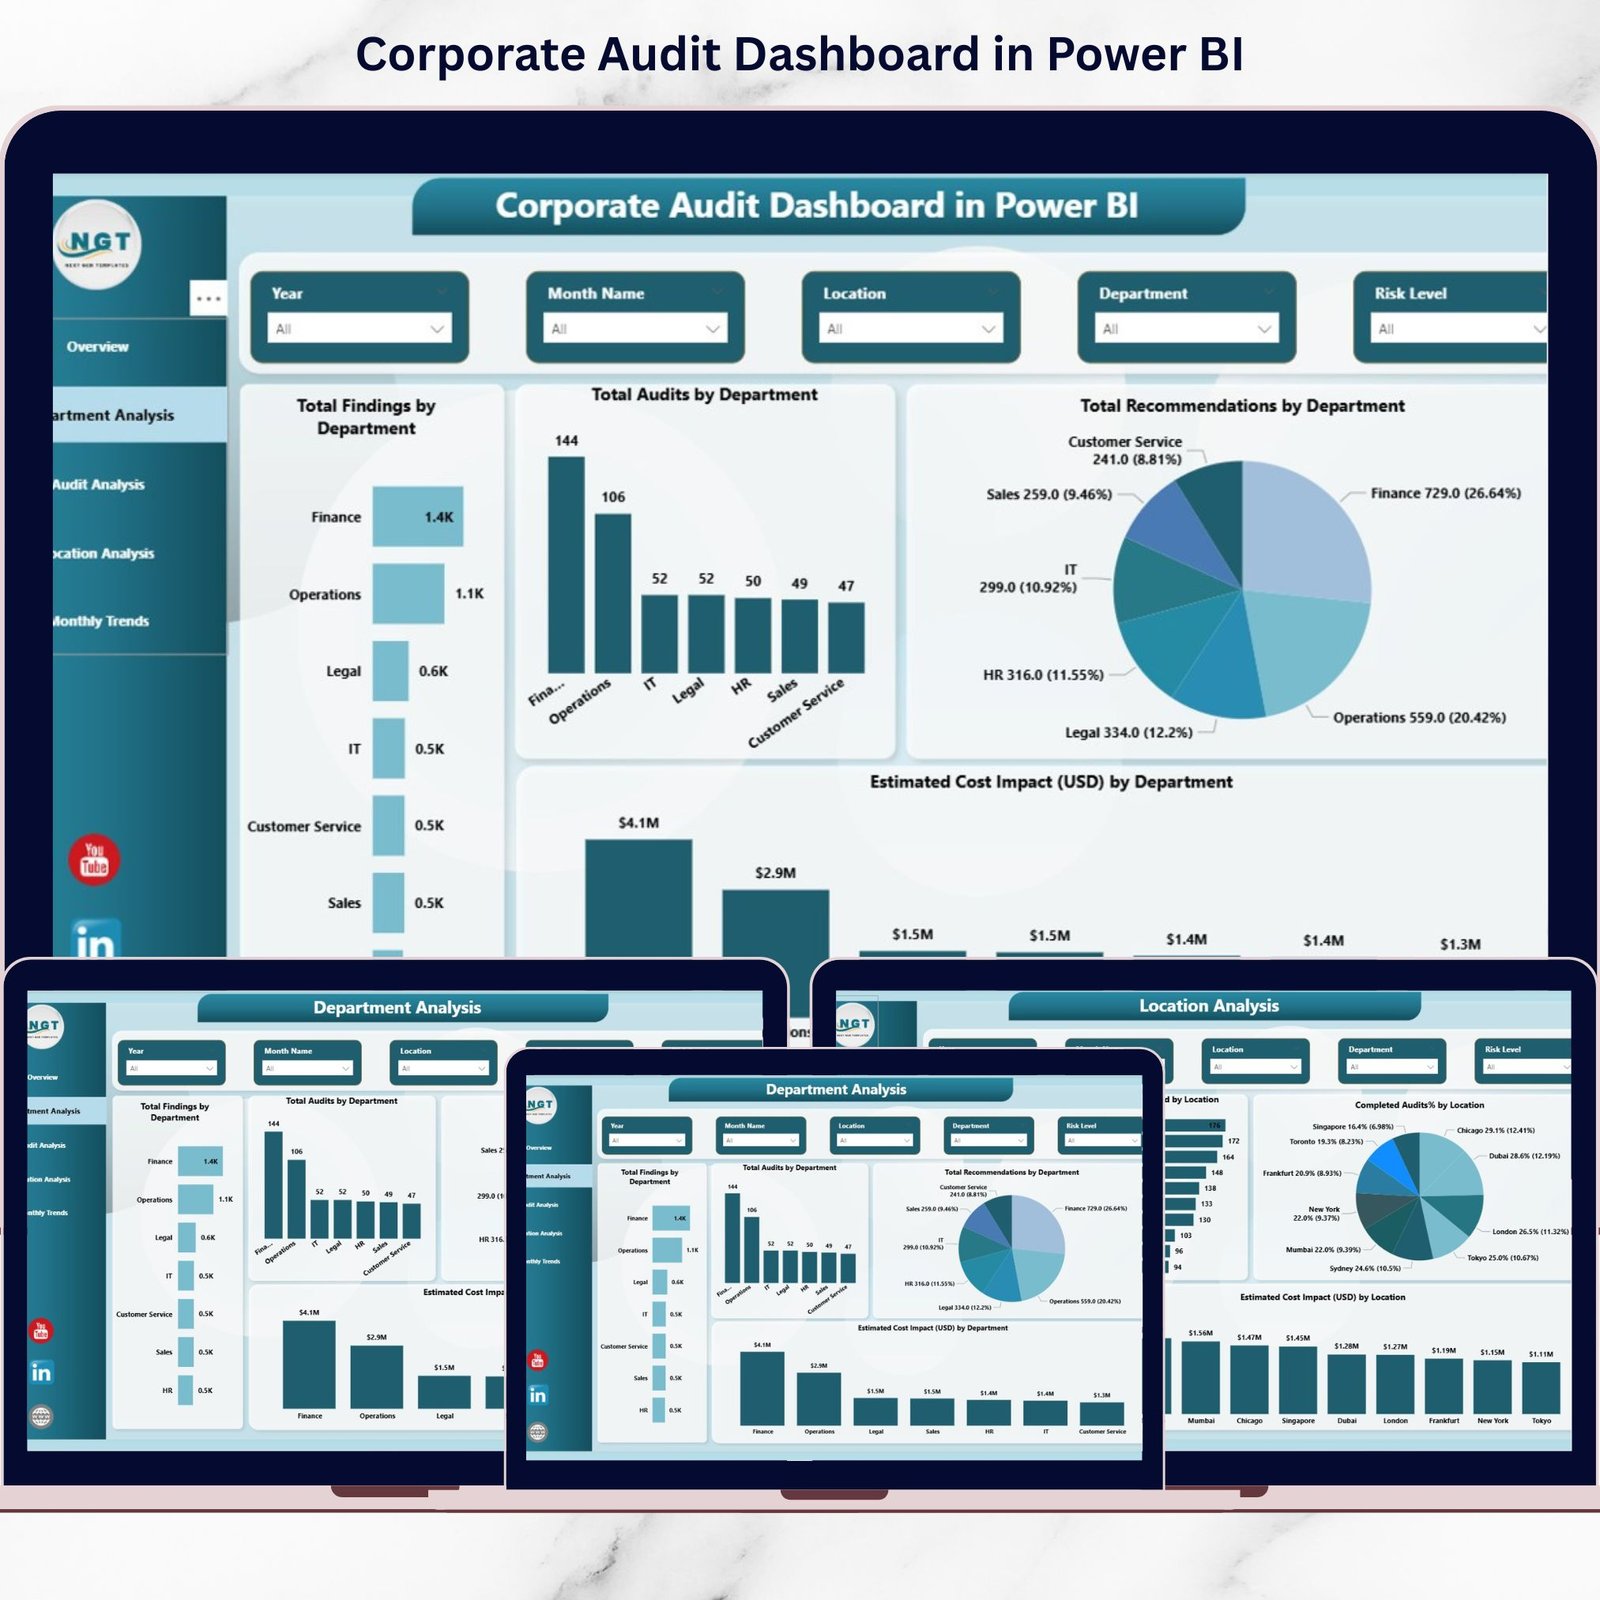
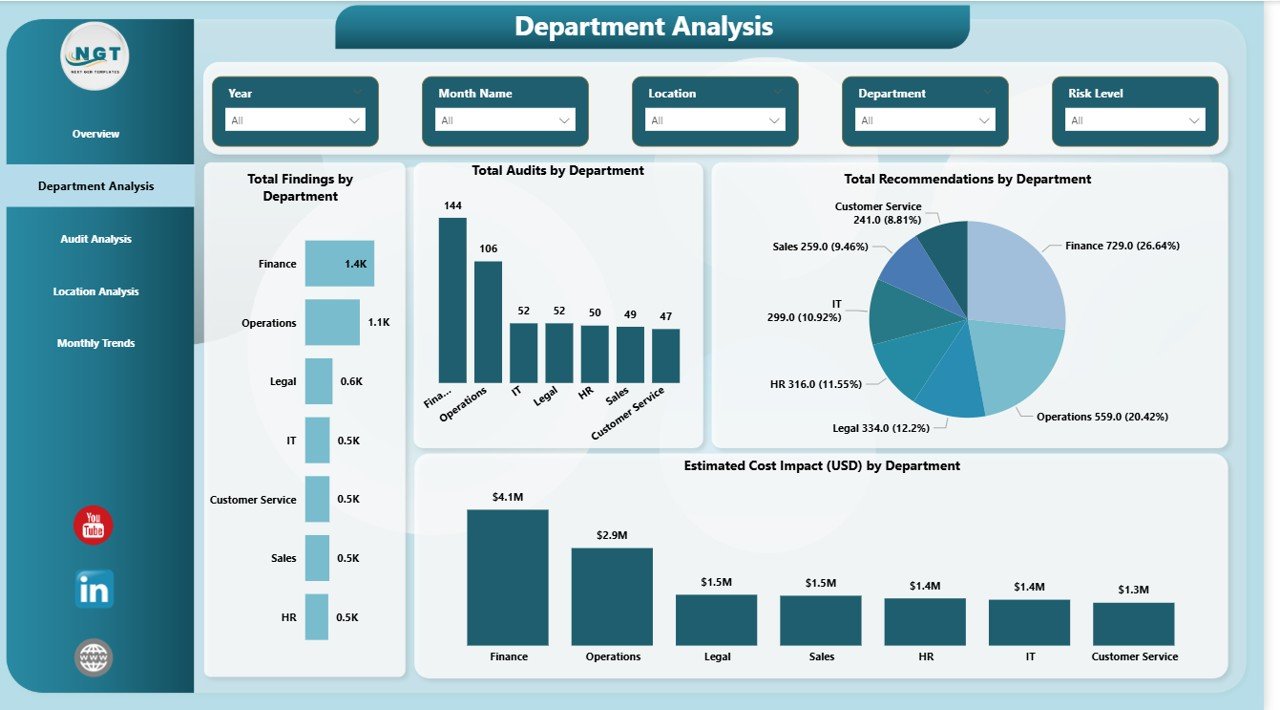
Get a complete audit view with Overview, Department Analysis, Audit Type Analysis, Location Analysis, and Monthly Trends.
📌 Real-Time KPI Tracking
Track Total Audits, Findings, Recommendations, Actions Closed, and Estimated Cost Impact instantly.
⚠️ Risk-Focused Insights
Identify high-risk audits, departments, and locations before issues escalate.
🔍 Powerful Drill-Down Analysis
Use slicers to filter by department, audit type, location, and time period.
📈 Trend Monitoring Over Time
Analyze monthly trends to detect recurring issues and measure improvements.
🔐 Enterprise-Level Security
Built on Power BI’s secure platform with role-based access and controlled sharing.
## 📦 What’s Inside the Corporate Audit Dashboard
This digital product includes a professionally designed Power BI dashboard file featuring:
✅ Overview Page with high-level audit KPIs
✅ Department-wise audit performance analysis
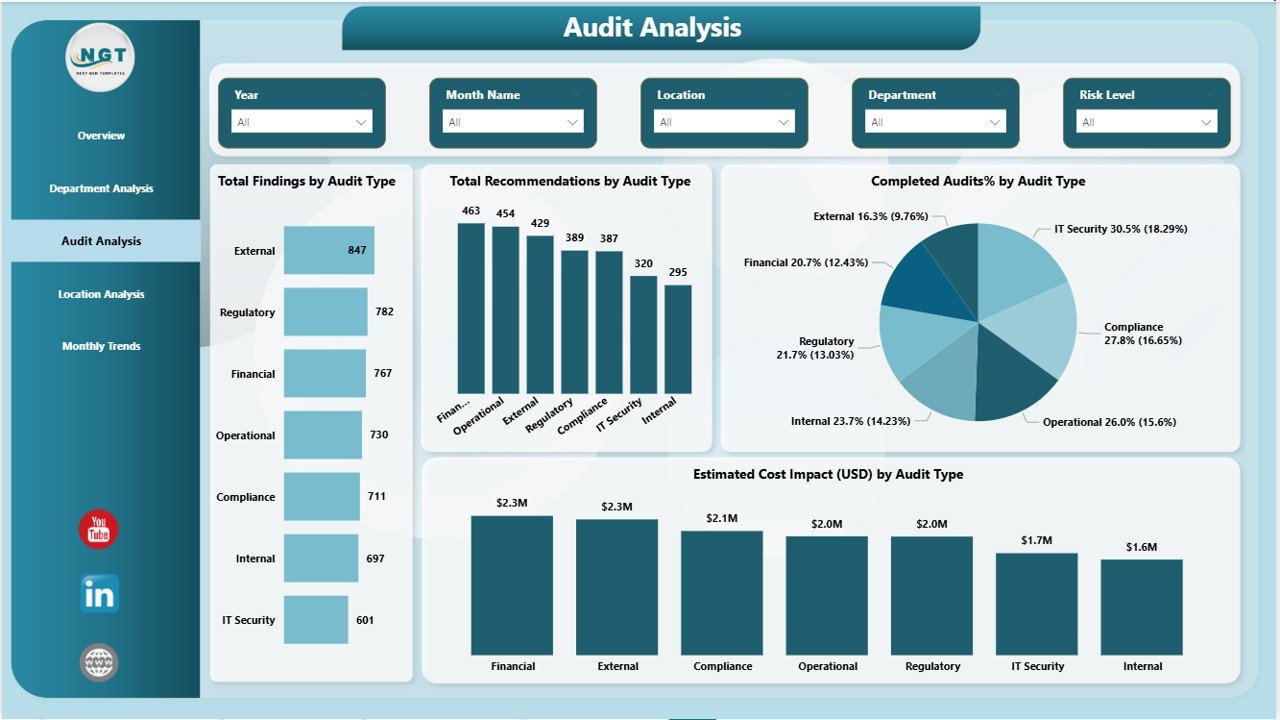
✅ Audit Type comparison (Financial, IT, Operational, Compliance, etc.)
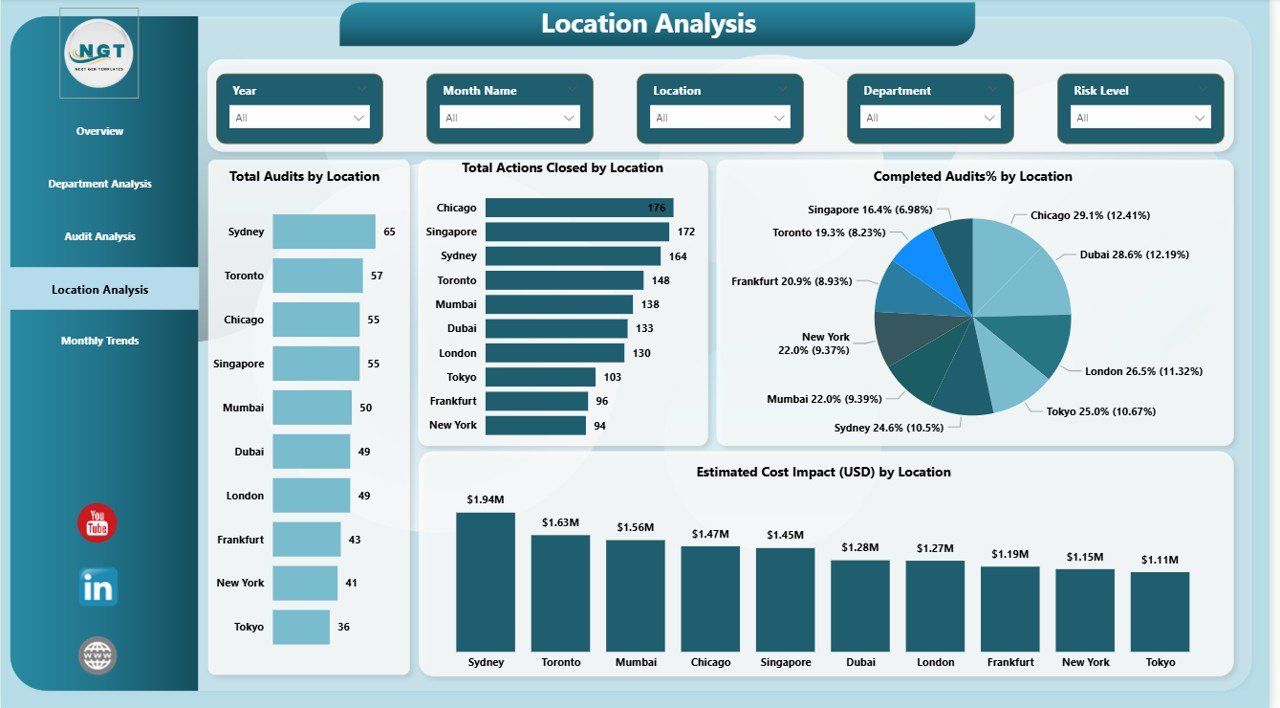
✅ Location-wise risk and compliance visibility
✅ Monthly trend analysis for findings, cost impact, and completion %
✅ Interactive slicers for flexible analysis
✅ Excel-friendly data model for easy updates
Everything is structured to deliver maximum clarity with minimum effort.
## 🛠️ How to Use the Corporate Audit Dashboard
Using this dashboard is simple—even for non-technical users:
1️⃣ Prepare your audit data in Excel (Departments, Audit Types, Locations, Dates, Findings, Costs)
2️⃣ Load the data into Power BI
3️⃣ Refresh the dashboard with one click
4️⃣ Apply slicers to explore insights
5️⃣ Share reports securely with leadership
No complex setup. No advanced coding. Just actionable audit intelligence.
## 👥 Who Can Benefit from This Corporate Audit Dashboard
This dashboard is ideal for:
👔 Internal Audit Teams – Track audits, findings, and action closures
🛡️ Compliance Officers – Monitor regulatory and compliance risks
📉 Risk Management Teams – Identify high-risk areas early
💼 Finance & Operations Leaders – Understand audit cost impact
🏢 Senior Management & Board Members – Get instant audit visibility
Whether you are a small organization or a large enterprise, this dashboard scales effortlessly with your audit needs.
Click here to read the Detailed Blog Post
Watch the step-by-step video tutorial: