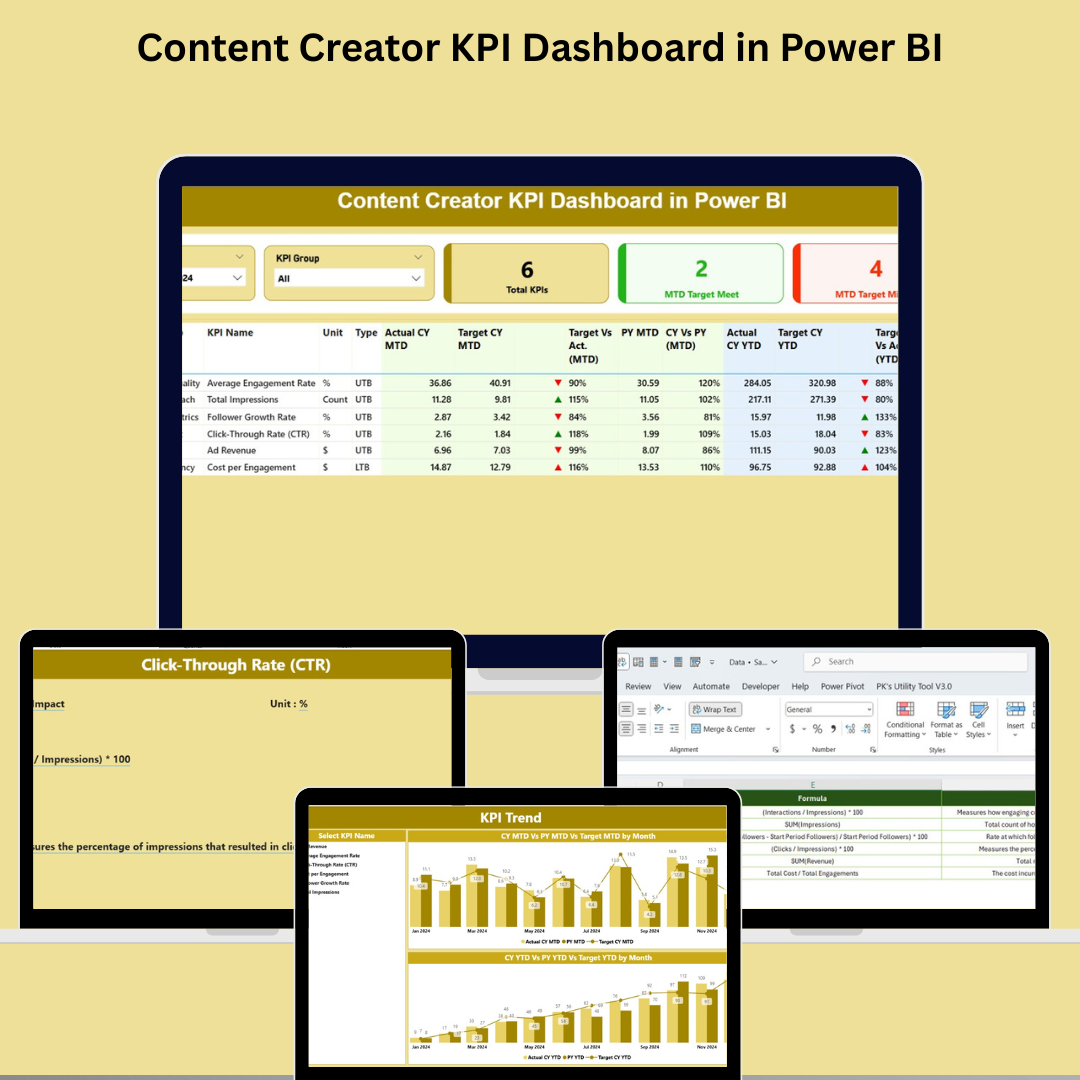
The Content Creator KPI Dashboard in Power BI is your all-in-one solution to track, analyze, and optimize your digital content strategy. Whether you’re a solo YouTuber, a dynamic blogging team, a digital marketing agency, or a network of influencers, this ready-to-use Power BI dashboard will supercharge your performance monitoring process with visual clarity and insightful analytics.
With Excel as its backend data engine and Power BI’s interactive interface at the front, this dashboard is crafted to empower creators with the metrics that matter the most.
✨ Key Features of Content Creator KPI Dashboard
📊 Three Powerful Pages for Deep Insights
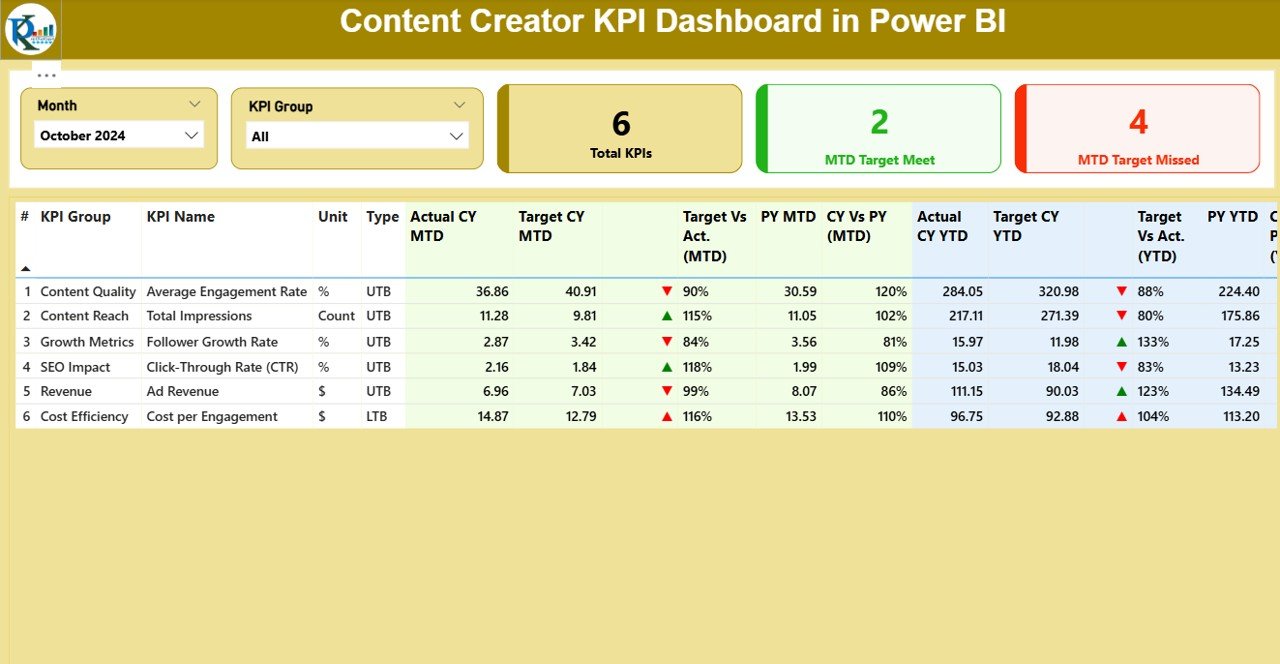
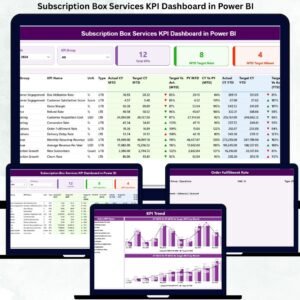
1️⃣ Summary Page – The Command Center
-
Easily select your desired Month and KPI Group using slicers
-
View cards for Total KPIs Count, MTD Target Met, and Target Missed
-
Dive into the detailed KPI table covering:
-
Current Month and YTD Actuals
-
Monthly and Annual Targets
-
Performance icons (green/red)
-
YoY comparisons for MTD and YTD
-
Target vs. Actual indicators
-
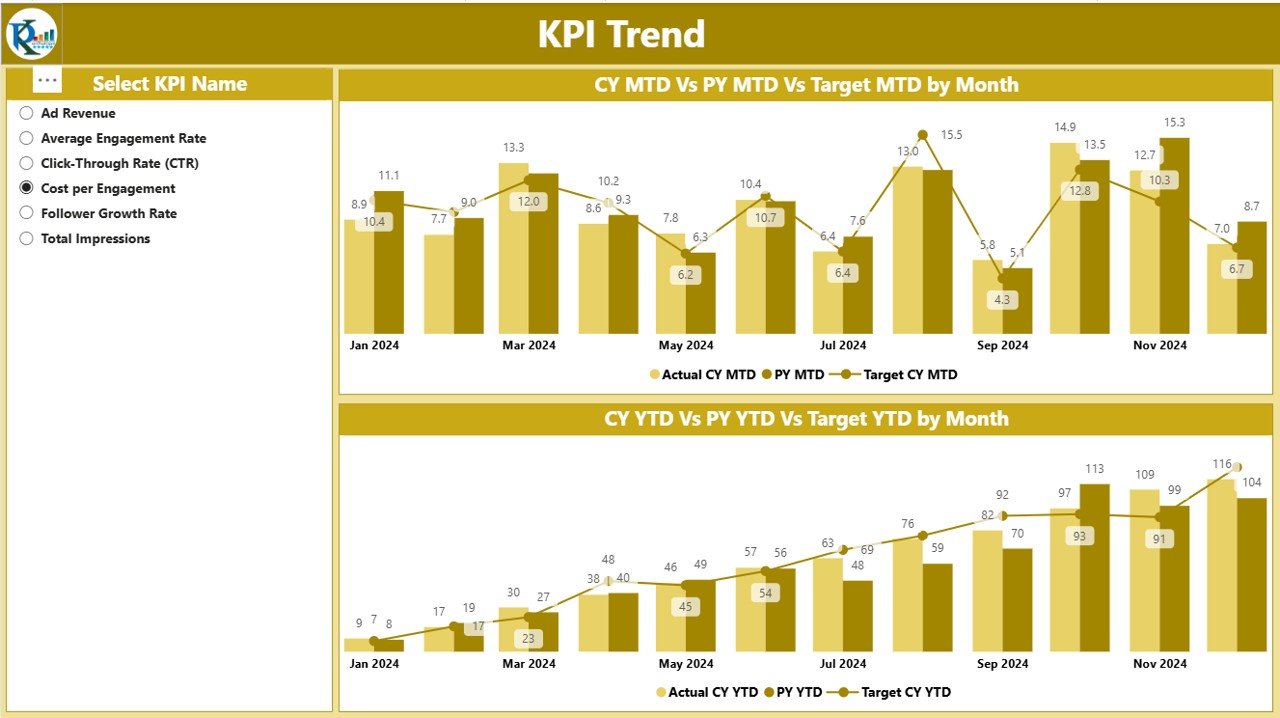
2️⃣ KPI Trend Page – Visualize Performance Over Time
-
Combo charts show trends for Actual vs Target vs Previous Year
-
Use the KPI slicer to zoom into individual performance metrics
-
Instantly grasp how you’re progressing over time
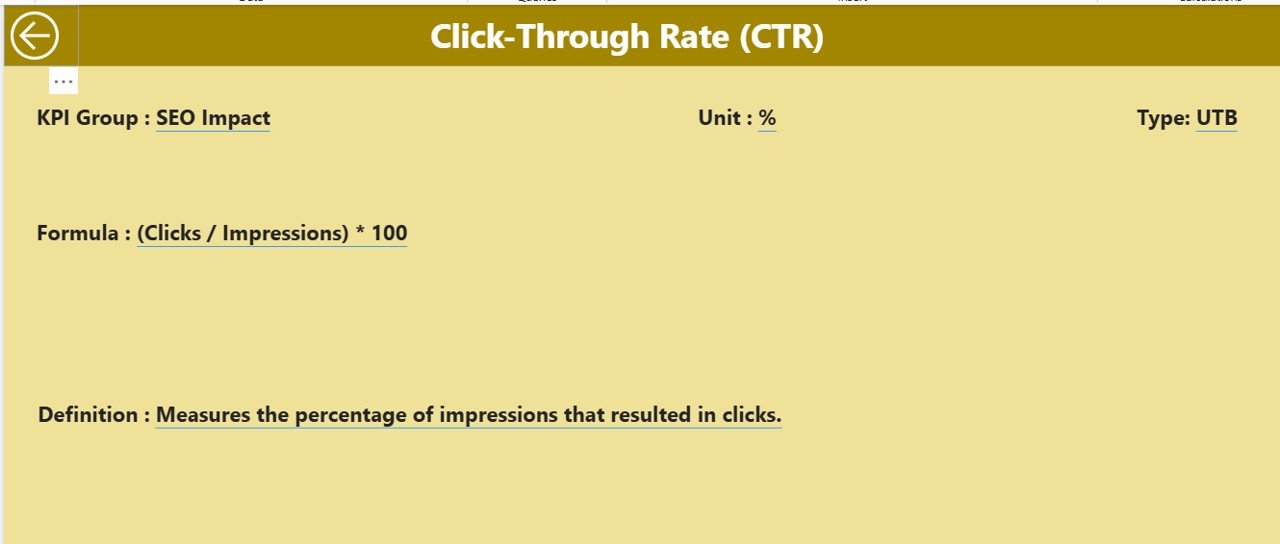
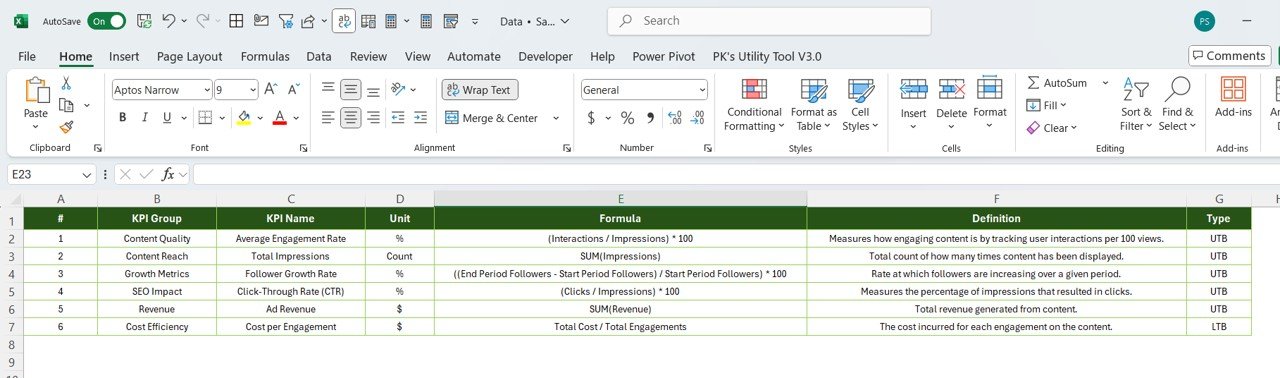
3️⃣ KPI Definition Page – Transparency in Every Metric
-
Drillthrough to understand formula logic and definitions
-
View how each KPI is calculated—perfect for presentations or team discussions
📂 What’s Inside the Content Creator KPI Dashboard
-
📁 Power BI (.PBIX) File
-
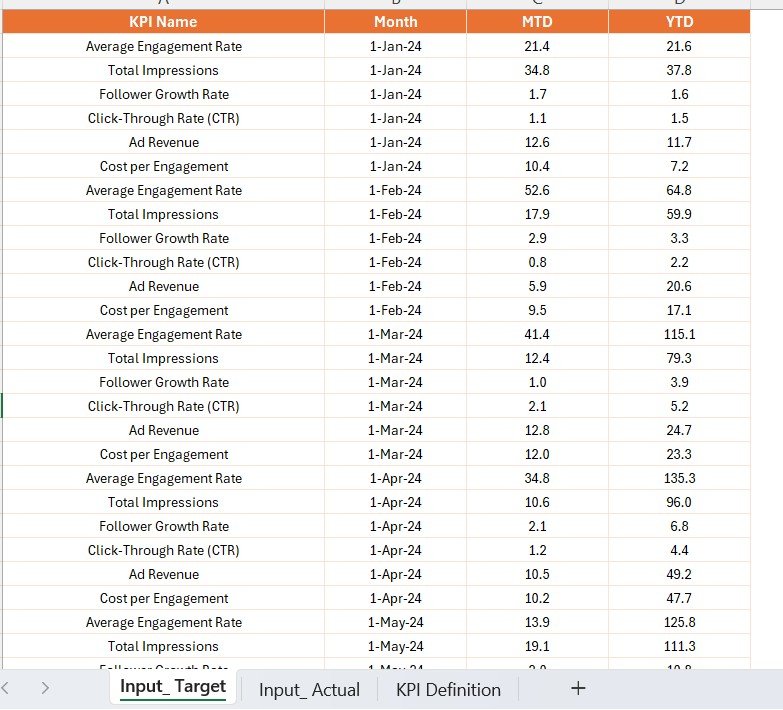
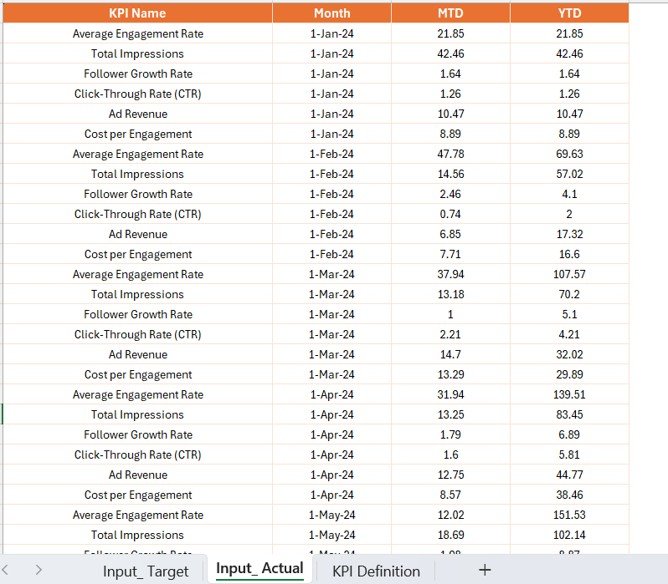
📊 Excel File with Three Tabs
-
Input_Actual: Your actual content metrics -
Input_Target: Monthly and annual goals -
KPI Definition: KPI metadata including formula, unit, UTB/LTB type
-
-
💡 Built-in icons for performance status (▲ or ▼)
-
🔄 Auto-refresh when Excel is updated
-
📈 Charts for MTD, YTD, and YoY analytics
🛠️ How to Use the Content Creator KPI Dashboard
-
📝 Fill in your Actuals and Targets in the Excel file (Month, KPI Name, MTD, YTD)
-
📤 Open Power BI and click Refresh to load new data
-
🎯 Use slicers to focus on specific KPI Groups and Months
-
📊 Use Summary for instant performance overview
-
📉 Head to Trend Page for insights over time
-
🔍 Drill into the KPI Definition for explanation or formula clarification
👥 Who Can Benefit from This Dashboard?
🎥 YouTubers – Track watch time, views, subscriber growth
📝 Bloggers – Monitor publishing frequency, traffic, and comments
📱 Social Media Managers – Measure likes, shares, engagement rate
🏢 Marketing Agencies – Show ROI and performance to clients
🎙️ Podcasters – Track downloads, episode reach, and listener growth
📈 Content Strategists – Drive data-backed editorial decisions
If you’re publishing on YouTube, Instagram, TikTok, Substack, Spotify, LinkedIn, or beyond—this dashboard is built for you.
🔥 Why This Dashboard is a Game-Changer
-
✅ Centralized KPI tracking in one dashboard
-
🧠 Smarter decisions with visual trends and indicators
-
🚀 Eliminate guesswork—go fully data-driven
-
📆 Monitor monthly performance and long-term growth
-
🔧 Easy customization using Excel backend
-
📤 Effortlessly share insights via PDF or Power BI service
📌 Best Practices to Get the Most Value
✔ Keep Excel updated monthly
✔ Use color-coded indicators to act fast on red zones
✔ Set realistic targets for actionable goals
✔ Organize KPIs by platforms or categories
✔ Present the dashboard to teams or clients for aligned decisions
🔁 Click here to read the Detailed Blog Post
📺 Visit our YouTube channel to learn step-by-step video tutorials
youtube.com/@PKAnExcelExpert


Reviews
There are no reviews yet.